Customizing the Splunk OpenTelemetry distribution to accommodate unsupported use cases
The Splunk OpenTelemetry Collector is a distribution of the OpenTelemetry Collector that provides a unified way for you to receive, process, and export metric, trace, and log data to Splunk Cloud Platform and Splunk Observability Cloud products. While Splunk provides support for a wide variety of OpenTelemetry components, unusual use cases or newer and less stable components aren't enabled by default in the distribution. If you want to experiment with an unsupported use case, extending the Splunk OpenTelemetry Collector distribution is relatively straightforward, even for someone without an extensive development background.
This article shows you an example of how this can be done by extending the Splunk OpenTelemetry collector to transport Google Cloud log messages from a Pub/Sub subscription to a Splunk HTTP Endpoint Collector (HEC). You'll do this through the following steps:
- This is an experimental approach and should not be used in a production environment. You will not receive support from Splunk or Google Cloud. For information on deploying a production-ready Google Cloud log export to Splunk platform, please refer to the official Google Cloud documentation.
- Custom distributions can also be built with the OpenTelemetry Collector Builder. Splunk has not yet migrated to using the builder and the process won't be covered here.
Prerequisites
- Familiarity with using the command-line interface (CLI)
- Familiarity with compiling your own code
- A working Go development environment
- (Optional) Docker or podman installed in development environment
- A Splunk instance with Splunk Add-on for Google Cloud Platform installed
Set up
Google Cloud
The following steps cover Google Cloud setup. Only run these commands within the context of a non-production project that is safe to use for experimentation. It is highly recommended that you create a dedicated Google Cloud project for the purposes of this exercise. For example, to create a new project titled "oteltest" and switch configuration contexts to this new project, issue the following commands:
$ gcloud projects create oteltest
$ gcloud config set project oteltest
- Export variables. Create or identify an existing Google Cloud project which can be used for this experiment. Export its name into an environment variable. Ensure this variable is set to the
projectIdas listed in the output fromgcloud projects list --format=flattened. For example:$ gcloud projects list --format=flattened --- createTime: 2022-06-30T21:56:08.101Z lifecycleState: ACTIVE name: oteltest parent.id: <REDACTED> parent.type: organization projectId: oteltest projectNumber: <REDACTED> --- ...
$ export GOOGLE_CLOUD_PROJECT=oteltest
Note that
Next, export the following shell variables:projectIdis not always the same asname.$ export SERVICE_ACCOUNT_SHORT=otel-test $ export SERVICE_ACCOUNT_FULL=${SERVICE_ACCOUNT_SHORT}@${GOOGLE_CLOUD_PROJECT}.iam.gserviceaccount.com $ export SERVICE_ACCOUNT_FILENAME=gcp.json $ export SINK_NAME=otel-log-sink $ export PUBSUB_TOPIC=otel-log-topic $ export PUBSUB_SUB=otel-log-sub - Create a service account:
$ gcloud iam service-accounts create ${SERVICE_ACCOUNT_SHORT} - Export the JSON key and download it to your development environment:
$ gcloud iam service-accounts keys create ${SERVICE_ACCOUNT_FILENAME} \ --iam-account=${SERVICE_ACCOUNT_FULL} - Enable the Pub/Sub API:
$ gcloud services enable pubsub.googleapis.com
- Create the Pub/Sub topic:
$ gcloud pubsub topics create ${PUBSUB_TOPIC} - Create the Pub/Sub subscription:
$ gcloud pubsub subscriptions create \ --topic ${PUBSUB_TOPIC} ${PUBSUB_SUB} - Bind the role to the service account:
$ gcloud pubsub subscriptions add-iam-policy-binding ${PUBSUB_SUB} \ --member="serviceAccount:${SERVICE_ACCOUNT_FULL}" \ --role="roles/pubsub.subscriber" - Create a log sink. The following command creates a log router that matches basic cloud audit logs along with a custom log:
$ gcloud logging sinks create ${SINK_NAME} \ pubsub.googleapis.com/projects/${GOOGLE_CLOUD_PROJECT}/topics/${PUBSUB_TOPIC} \ --log-filter='log_id("cloudaudit.googleapis.com/activity") OR log_id("cloudaudit.googleapis.com/policy") OR log_id("oteltest")' - Allow sink writer permission to topic. First, determine the identity of the log sink writer:
$ export SINK_SERVICE_ACCOUNT=`gcloud logging sinks describe ${SINK_NAME} --format="value(writerIdentity)"`Next, grant the log writer service account identity permission to publish to the topic:
$ gcloud pubsub topics add-iam-policy-binding ${PUBSUB_TOPIC} \
 --member="${SINK_SERVICE_ACCOUNT}" --role="roles/pubsub.publisher"
Splunk platform
The following steps create a Splunk platform index and HEC token. You must have administrative permissions to perform these operations. The index name and HEC token will be referenced in later steps.
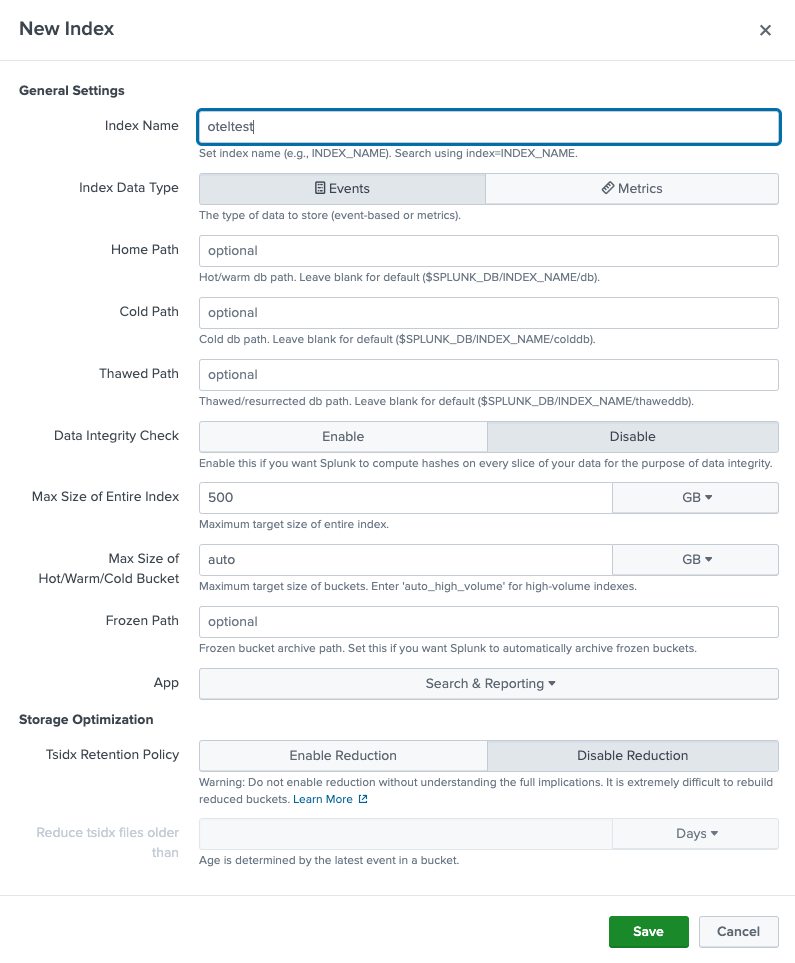
Create the index
- Click the Settings menu in the top right corner.
- Under the Data column, click on Indexes.
- Click the New Index button in the top right corner.
- In the Index Name field, enter "oteltest".
- Click Save.
Create HEC token
- Click the Settings menu in the top right corner. Under the Data column, click Data inputs.
- In the HTTP Event Collector row, click the Add new button under the Actions column.
- In the Name field, type "otelhec".
- In the top right corner, click Next.
- In the Select Allowed Indexes section, choose the oteltest item in the Available item(s) box. You should see oteltest appear in the Selected item(s) box. You should also see the Default Index update to oteltest.
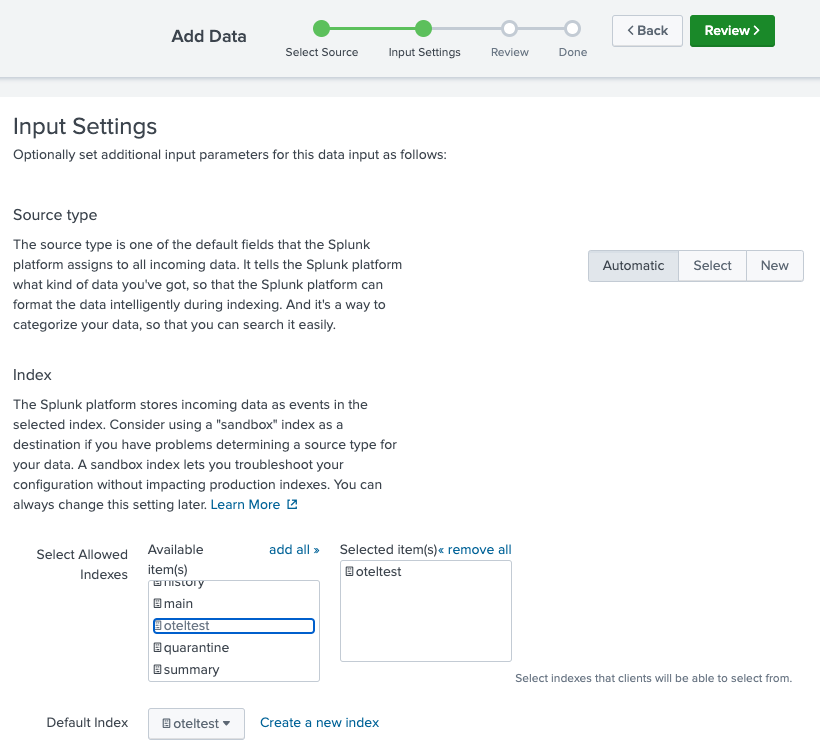
- In the top right corner, click the Review button.
- In the top right corner, click the Submit button.
- Copy the Token Value to a text file for later use.
- In your development environment, export this token as an environment variable:
$ export SPLUNK_HEC_TOKEN=<token>
Build
- Prepare the source.
- Clone the Splunk OpenTelemetry Distribution.
$ git clone https://github.com/signalfx/splunk-otel-collector
$ cd splunk-otel-collector
- Install tools. The
Makefileincluded with Splunk's OpenTelemetry distribution includes a target which installs prerequisite build tooling. Make sure you run this command to prepare your local development environment:$ make install-tools
- Edit source. Because the
googlecloudpubsubreceiverreceiver is not enabled by default in the Splunk OpenTelemetry Collector distribution, you will need to enable the component and create a custom build based upon these changes. Somediffexamples to illustrate the changes are below.internal/components/components.go. The following is adiffdemonstrating the changes made tointernal/components/components.go:diff --git a/internal/components/components.go b/internal/components/components.go index e300e577..e0e0be92 100644 --- a/internal/components/components.go +++ b/internal/components/components.go @@ -50,6 +50,7 @@ import ( "github.com/open-telemetry/opentelemetry-collector-contrib/receiver/collectdreceiver" "github.com/open-telemetry/opentelemetry-collector-contrib/receiver/filelogreceiver" "github.com/open-telemetry/opentelemetry-collector-contrib/receiver/fluentforwardreceiver" + "github.com/open-telemetry/opentelemetry-collector-contrib/receiver/googlecloudpubsubreceiver" "github.com/open-telemetry/opentelemetry-collector-contrib/receiver/hostmetricsreceiver" "github.com/open-telemetry/opentelemetry-collector-contrib/receiver/jaegerreceiver" "github.com/open-telemetry/opentelemetry-collector-contrib/receiver/jmxreceiver" @@ -137,6 +138,7 @@ func Get() (otelcol.Factories, error) { discoveryreceiver.NewFactory(), fluentforwardreceiver.NewFactory(), filelogreceiver.NewFactory(), + googlecloudpubsubreceiver.NewFactory(), hostmetricsreceiver.NewFactory(), jaegerreceiver.NewFactory(), jmxreceiver.NewFactory(),
internal/components/components_test.go. The following is adiffdemonstrating the changes made tointernal/components/components_test.go:diff --git a/internal/components/components_test.go b/internal/components/components_test.go index 88d44765..380e1ad6 100644 --- a/internal/components/components_test.go +++ b/internal/components/components_test.go @@ -48,6 +48,7 @@ func TestDefaultComponents(t *testing.T) { "discovery", "filelog", "fluentforward", + "googlecloudpubsubreceiver", "hostmetrics", "jaeger", "jmx",
- Clone the Splunk OpenTelemetry Distribution.
- Get dependencies. Before compiling, retrieve the new dependencies for the
googlecloudpubsubreceivercomponent:$ go get github.com/open-telemetry/opentelemetry-collector-contrib/receiver/googlecloudpubsubreceiver
- Make the binary. Now that the necessary changes have been made to the source code and the dependencies retrieved, you're ready to build new binaries. The
Makefileincluded with the project makes this easy. To build for the local operating system and platform, runmake otelcolas shown below:$ make otelcol
- (Optional) Generate all platform binaries. Because Go also supports cross compilation, you can generate binaries for target platforms other than the one you are building on. For example, you can easily generate a Linux x86 binary from a Darwin x86 machine:
$ make binaries-all-sys
- Inspect builds. After the build process is done, you will find the binary builds in the bin/ directory:
$ ls -alh bin
Output:
drwxr-xr-x  21 mhite  staff   672B May 15 15:13 ./
drwxr-xr-x  31 mhite  staff   992B May 15 15:09 ../
lrwxr-xr-x   1 mhite  staff    31B May 15 15:13 migratecheckpoint@ -> migratecheckpoint_linux_ppc64le
-rwxr-xr-x   1 mhite  staff   3.0M May 15 15:11 migratecheckpoint_darwin_amd64*
-rwxr-xr-x   1 mhite  staff   3.1M May 15 15:11 migratecheckpoint_linux_amd64*
-rwxr-xr-x   1 mhite  staff   3.1M May 15 15:12 migratecheckpoint_linux_arm64*
-rwxr-xr-x   1 mhite  staff   3.1M May 15 15:13 migratecheckpoint_linux_ppc64le*
-rwxr-xr-x   1 mhite  staff   3.5M May 15 15:13 migratecheckpoint_windows_amd64.exe*
lrwxr-xr-x   1 mhite  staff    21B May 15 15:13 otelcol@ -> otelcol_linux_ppc64le
-rwxr-xr-x   1 mhite  staff   202M May 15 15:11 otelcol_darwin_amd64*
-rwxr-xr-x   1 mhite  staff   201M May 15 15:09 otelcol_darwin_arm64*
-rwxr-xr-x   1 mhite  staff   204M May 15 15:11 otelcol_linux_amd64*
-rwxr-xr-x   1 mhite  staff   197M May 15 15:12 otelcol_linux_arm64*
-rwxr-xr-x   1 mhite  staff   201M May 15 15:13 otelcol_linux_ppc64le*
-rwxr-xr-x   1 mhite  staff   204M May 15 15:13 otelcol_windows_amd64.exe*
lrwxr-xr-x   1 mhite  staff    26B May 15 15:13 translatesfx@ -> translatesfx_linux_ppc64le
-rwxr-xr-x   1 mhite  staff   3.2M May 15 15:11 translatesfx_darwin_amd64*
-rwxr-xr-x   1 mhite  staff   3.2M May 15 15:11 translatesfx_linux_amd64*
-rwxr-xr-x   1 mhite  staff   3.2M May 15 15:12 translatesfx_linux_arm64*
-rwxr-xr-x   1 mhite  staff   3.3M May 15 15:13 translatesfx_linux_ppc64le*
-rwxr-xr-x   1 mhite  staff   3.3M May 15 15:13 translatesfx_windows_amd64.exe*
- (Optional) Build operating system packages. The
Makefilealso provides capabilities to generate rpm packages for installation on a Red Hat or CentOS system. Note for this to work you must also have Docker installed:$ make rpm-package
Similarly, the same can be done for a .deb package for use on an Ubuntu or other Debian-based distribution:
$ make deb-package
After the build process for the deb or rpm build is complete, you will find the package artifact in the
dist/directory:$ ls -al dist
Output:
drwx------@  4 mhite  staff        128 Jun 22 14:13 .
drwxr-xr-x  26 mhite  staff        832 Jun 22 14:12 ..
-rw-------@  1 mhite  staff  226006452 Jun 22 14:09 splunk-otel-collector-0.53.1~4_g5729a1e-1.x86_64.rpm
-rw-------@  1 mhite  staff  226641502 Jun 22 14:13 splunk-otel-collector_0.53.1-4-g5729a1e_amd64.deb
Configure
You need a configuration file to exercise the new Pub/Sub component. This file handles the following tasks:
- Using the
batchprocessor, log messages are batched into 10 second windows. - Using the
resourcedetectionprocessor, the agent hostname is detected. Messages delivered to HEC via this agent have theirhostmetadata attribute set to the local hostname of the agent machine. - Using the
logtransformerprocessor, the Pub/Sub transported Google Cloud log message is parsed as JSON and the timestamp is extracted. - The
googlecloudpubsubreceiver is configured to pull messages from a subscription that receives Google Cloud log messages. - The
splunk_hecexporter is configured to deliver messages to a Splunk HEC endpoint. - Finally, a log pipeline is constructed using all of these components.
This is the configuration file that will accomplish these tasks. Copy and save it using the name pubsub-otel.yaml:
processors:
  batch:
    # gather messages into 10s batches
    timeout: 10s
  resourcedetection:
    # this will ensure the "host" field of our hec message is populated
    detectors: ["system"]
    system:
      hostname_sources: ["os"]
  logstransform:
    operators:
      # this parses the payload as JSON and puts it in internal key "attributes"
      # everything in attributes ends up as a HEC "fields" key/value
      - type: json_parser
        parse_from: body
        # grab timestamp
        timestamp:
          parse_from: attributes.timestamp
          layout: '%Y-%m-%dT%H:%M:%S.%LZ'
      # now that we've parsed the payload as JSON, blow away current internal key "body"
      - type: remove
        field: body
      # hacky way to encapsulate parsed JSON inside "data" so it works with the GCP-TA
      - type: add
        field: body.data
        value: EXPR(attributes)
      # let's blow away attributes so we don't send any "fields" to HEC
      - type: remove
        field: attributes

extensions:
  health_check:
      endpoint: 0.0.0.0:13133
  pprof:
      endpoint: :1888
  zpages:

receivers:
  googlecloudpubsub:
    project: "${GOOGLE_CLOUD_PROJECT}"
    subscription: "projects/${GOOGLE_CLOUD_PROJECT}/subscriptions/${PUBSUB_SUB}"
    encoding: raw_text

exporters:
  splunk_hec:
    token: "${SPLUNK_HEC_TOKEN}"
    endpoint: "${SPLUNK_HEC_URL}"
    source: "otel"
    index: "${SPLUNK_INDEX}"
    sourcetype: "google:gcp:pubsub:message"
    max_connections: 20
    disable_compression: false
    timeout: 10s
    tls:
      insecure_skip_verify: true

service:
  extensions: [ pprof, zpages, health_check ]
  pipelines:
    logs:
      receivers: [ googlecloudpubsub ]
      processors: [ batch, resourcedetection, logstransform ]
      exporters: [ splunk_hec ]
Test
You are now ready to test and verify.
Export environment variables
Since your configuration file references multiple environment variables, you need to declare them in your shell environment before launching the agent.
These environment variables are described below:
SPLUNK_HEC_TOKEN- Splunk HEC tokenSPLUNK_HEC_URL- URL path to the Splunk HEC endpoint, such as https://mysplunkhec.com:8088/SPLUNK_INDEX- Splunk index name to store log messagesGOOGLE_APPLICATION_CREDENTIALS- Path to GCP service account JSON credentialGOOGLE_CLOUD_PROJECT- GCP project namePUBSUB_SUB- GCP Pub/Sub subscription name
Export each of them before launching the OpenTelemetry agent, as shown below:
$ export SPLUNK_HEC_URL="https://mysplunkhec.com:8088"
$ export SPLUNK_HEC_TOKEN="your-hec-token"
$ export SPLUNK_INDEX="oteltest"
$ export GOOGLE_APPLICATION_CREDENTIALS="/Users/mhite/repo/blog/custom-agent/splunk-otel-collector/gcp.json"
The GOOGLE_CLOUD_PROJECT and PUBSUB_SUB environment variables should already be present from previous setup steps.
Launch the agent
Launch your newly compiled agent, making sure to point to the correct platform binary, using the following command:
$ ./bin/otelcol_darwin_arm64 --config=./pubsub-otel.yaml
The output should look like this:
2023/05/15 15:39:15 settings.go:332: Set config to [./pubsub-otel.yaml]
2023/05/15 15:39:15 settings.go:385: Set ballast to 168 MiB
2023/05/15 15:39:15 settings.go:401: Set memory limit to 460 MiB
2023-05-15T15:39:15.632-0700    info    service/telemetry.go:113    Setting up own telemetry...
2023-05-15T15:39:15.632-0700    info    service/telemetry.go:136    Serving Prometheus metrics    {"address": ":8888", "level": "Basic"}
2023-05-15T15:39:15.632-0700    info    processor/processor.go:300    Development component. May change in the future.    {"kind": "processor", "name": "logstransform", "pipeline": "logs"}
2023-05-15T15:39:15.632-0700    info    service/service.go:141    Starting otelcol...    {"Version": "v0.76.1-50-gb57c7279", "NumCPU": 10}
2023-05-15T15:39:15.632-0700    info    extensions/extensions.go:41    Starting extensions...
2023-05-15T15:39:15.632-0700    info    extensions/extensions.go:44    Extension is starting...    {"kind": "extension", "name": "pprof"}
2023-05-15T15:39:15.632-0700    info    pprofextension@v0.77.0/pprofextension.go:71    Starting net/http/pprof server    {"kind": "extension", "name": "pprof", "config": {"TCPAddr":{"Endpoint":":1888"},"BlockProfileFraction":0,"MutexProfileFraction":0,"SaveToFile":""}}
2023-05-15T15:39:15.632-0700    info    extensions/extensions.go:48    Extension started.    {"kind": "extension", "name": "pprof"}
2023-05-15T15:39:15.632-0700    info    extensions/extensions.go:44    Extension is starting...    {"kind": "extension", "name": "zpages"}
2023-05-15T15:39:15.632-0700    info    zpagesextension@v0.77.0/zpagesextension.go:64    Registered zPages span processor on tracer provider    {"kind": "extension", "name": "zpages"}
2023-05-15T15:39:15.632-0700    info    zpagesextension@v0.77.0/zpagesextension.go:74    Registered Host's zPages    {"kind": "extension", "name": "zpages"}
2023-05-15T15:39:15.632-0700    info    zpagesextension@v0.77.0/zpagesextension.go:86    Starting zPages extension    {"kind": "extension", "name": "zpages", "config": {"TCPAddr":{"Endpoint":"localhost:55679"}}}
2023-05-15T15:39:15.632-0700    info    extensions/extensions.go:48    Extension started.    {"kind": "extension", "name": "zpages"}
2023-05-15T15:39:15.632-0700    info    extensions/extensions.go:44    Extension is starting...    {"kind": "extension", "name": "health_check"}
2023-05-15T15:39:15.632-0700    info    healthcheckextension@v0.77.0/healthcheckextension.go:45    Starting health_check extension    {"kind": "extension", "name": "health_check", "config": {"Endpoint":"0.0.0.0:13133","TLSSetting":null,"CORS":null,"Auth":null,"MaxRequestBodySize":0,"IncludeMetadata":false,"Path":"/","ResponseBody":null,"CheckCollectorPipeline":{"Enabled":false,"Interval":"5m","ExporterFailureThreshold":5}}}
2023-05-15T15:39:15.633-0700    warn    internal/warning.go:51    Using the 0.0.0.0 address exposes this server to every network interface, which may facilitate Denial of Service attacks    {"kind": "extension", "name": "health_check", "documentation": "https://github.com/open-telemetry/opentelemetry-collector/blob/main/docs/security-best-practices.md#safeguards-against-denial-of-service-attacks"}
2023-05-15T15:39:15.633-0700    info    extensions/extensions.go:48    Extension started.    {"kind": "extension", "name": "health_check"}
2023-05-15T15:39:15.633-0700    info    internal/resourcedetection.go:136    began detecting resource information    {"kind": "processor", "name": "resourcedetection", "pipeline": "logs"}
2023-05-15T15:39:15.645-0700    info    internal/resourcedetection.go:150    detected resource information    {"kind": "processor", "name": "resourcedetection", "pipeline": "logs", "resource": {"host.id":"BCB8A4F5-B5B2-5132-AB53-1320A7635FCE","host.name":"mattirl-en0.int.beatmixed.net","os.type":"darwin"}}
2023-05-15T15:39:15.730-0700    info    healthcheck/handler.go:129    Health Check state change    {"kind": "extension", "name": "health_check", "status": "ready"}
2023-05-15T15:39:15.730-0700    info    service/service.go:158    Everything is ready. Begin running and processing data.
2023-05-15T15:39:15.730-0700    info    internal/handler.go:117    Starting Streaming Pull    {"kind": "receiver", "name": "googlecloudpubsub", "data_type": "logs"}
Generate and verify delivery of a log message
To test the pipeline, write a message to Cloud Logging and search for it in the Splunk platform. To inject a test message, run the following command:
$ gcloud logging write oteltest "Test message"
Then, within the Splunk platform, search for the following:
index="oteltest" data.textPayload="Test message"
Ensure that you have selected an appropriately constrained time selection within the time picker.
Clean up
The following section summarizes cleanup steps for both the Google Cloud and Splunk platform environments.
Google Cloud
To avoid future charges, delete the following cloud resources created during this experiment:
- Log sink:
$ gcloud logging sinks delete ${SINK_NAME} - Pub/Sub subscription:
$ gcloud pubsub subscriptions delete ${PUBSUB_SUB} - Pub/Sub topic:
$ gcloud pubsub topics delete ${PUBSUB_TOPIC} - Service account:
$ gcloud iam service-accounts delete ${SERVICE_ACCOUNT_FULL}
Splunk platform
Delete the following Splunk platform resources created during this experiment:
Delete HEC token
- In the top right corner, click the Settings menu. Under the Data column, click Data inputs.
- Click the HTTP Event Collector hyperlink.
- In the filter box, type "otelhec" and select enter.
- Under the Actions column for the row labeled otelhec, click Delete.
- In the Delete Token popup, click Delete.
Delete index
- In the top right corner, click the Settings menu.
- Under the Data column, click Indexes.
- In the filter box, type "oteltest" and select enter.
- Under the Actions column for the row labeled oteltest, click Delete.
- In the Delete Index popup, click the Delete button.
You've now seen the basics of customizing the Splunk OpenTelemetry distribution. Using the guidance in this article, you can now handle your own custom agent use case. Remember that this will be unsupported by Splunk.
Next steps
These resources might help you understand and implement this guidance:
- Github: Splunk HTTP Event Collector (HEC) exporter
- Github: Google Pub/Sub receiver
- Github: Batch processor
- Github: Log processing operators
- Github: Resource detection processor
- Github: OpenTelemetry local development