Alerting on source type volume with machine learning
With Splunk software, nothing is more important than ensuring that your key data is being properly received. You can set an alert for when a source type completely disappears. However, there are many use cases where logs will still be present but will be abnormally high or low. For example:
- An active DDOS attack might result in abnormally high log volume
- A partial loss of data collectors might result in abnormally low log volume
You want to alert on scenarios like these as well.
How to use Splunk software for this use case
You can use machine learning to detect anomalies in the volume of logs. The following procedure analyzes each source type in the system and uses probability density functions (PDFs) to determine the "normal" volume for each hour of each source type.
The examples below use the following parameters, which will vary based on your needs and deployment:
- Day of the week (date_wday) and hour of the day (date_hour) are the training features. This means the model understands that 3AM on Saturday is different than 6AM on Monday.
- The events are bucketed into 60m time spans (span=60m). Chose your span of time depending on what resolution you'd like to see.
- The search time is set to 90 days. Since this example uses day of the week as a feature, each week gives an additional training data point. So here, cardinality is ~12 (90 / 7). Higher cardinality leads to more accurate results.
- The threshold is 0.5% (0.005) and has a forced normal distribution.
- Train the PDF model by saving the following search as a report and scheduling it to run weekly.
| tstats count WHERE index=mysplunk earliest=-91d latest=-1d@d BY sourcetype _time span=60m
| eval date_minutebin=strftime(_time, "%M")
| eval date_hour=strftime(_time, "%H")
| eval date_wday=strftime(_time, "%A")
| fit DensityFunction count by "sourcetype,date_hour,date_wday" into app:sourcetype_model threshold=0.005 dist=norm
Your results should look similar to this.

- Analyze the model by running the following search. Be sure to limit this to a single source type (for example
sourcetype="access_combined_wcookie") for proper analysis.| tstats count WHERE index=mysplunk earliest=-8d@d latest=-1h@h sourcetype="access_combined_wcookie" BY sourcetype _time span=60m | eval date_minutebin=strftime(_time, "%M") | eval date_hour=strftime(_time, "%H") | eval date_wday=strftime(_time, "%A") | apply sourcetype_model threshold=0.005 | eval leftRange=mvindex(BoundaryRanges,0), rightRange=mvindex(BoundaryRanges,1) | rex field=leftRange "-Infinity:(?<lowerBound>[^:]*):" | rex field=rightRange "(?<upperBound>[^:]*):Infinity" | eval lowerBound = case(lowerBound < 0, 0, lowerBound >= 0, lowerBound) | fields _time, count, lowerBound, upperBound, "IsOutlier(count)", *
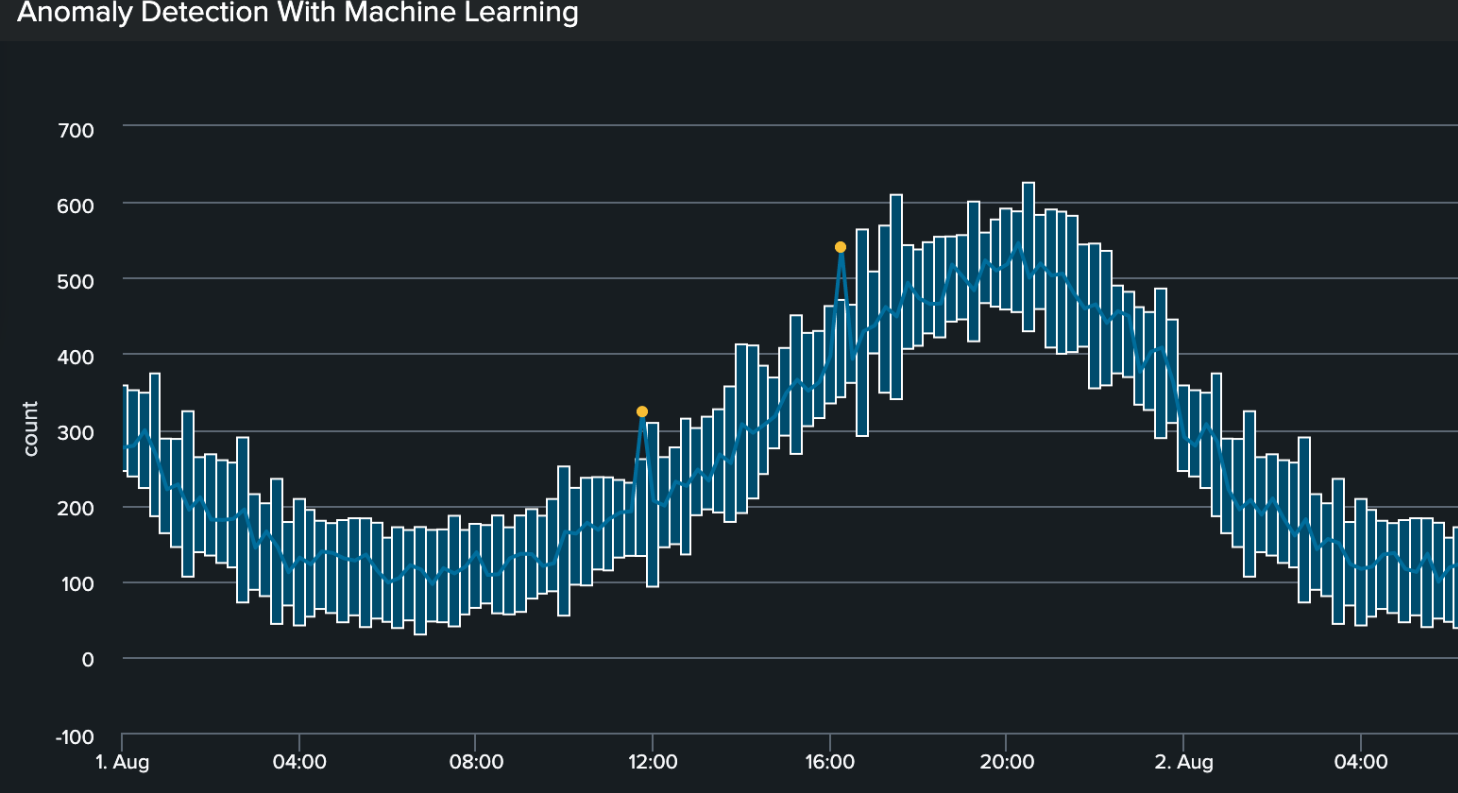
- Apply the Outliers Chart visualization to the results. Before implementing an alert, it is very important to explore your model visually to ensure you get the intended results. Refine the threshold and any other variables as needed. Here are example results that accurately define upper and lower boundaries, and identify outliers in the data.
- Build the alert. You can automate alerting of volume anomalies using the following search. Because the time span is 60m, this search is set to run from -2 hours to -1 hour. Avoid using the current hour (i.e. "now") so that you don't get partial results from having an incomplete timespan.
| tstats count WHERE index=mysplunk earliest=-2h@h latest=-1h@h BY sourcetype _time span=60m
| eval date_minutebin=strftime(_time, "%M")
| eval date_hour=strftime(_time, "%H")
| eval date_wday=strftime(_time, "%A")
| apply sourcetype_model threshold=0.005
| search "IsOutlier(count)" = 1
Next steps
These sample search results reveal an abnormally low volume of logs.

These additional Splunk resources might help you understand and implement this use case:
- Splunk Help: Deep dive: Using ML to identify network traffic anomalies
- Splunk Help: Custom visualizations in the Machine Learning Toolkit
- Splunk Help: DensityFunction