Monitoring and troubleshooting device temperature
Monitoring the temperature of devices is crucial for ensuring operational efficiency and preventing potential issues such as system overheating or outages. This use case shows you how to follow a troubleshooting flow that includes:
- Monitoring devices for high temperature alarms
- Checking device power consumption, in a single location or as a group
- Checking room temperature, which might be the cause of high device temperatures
Data required
To complete this procedure, you'll need data flowing into Splunk platform from a sensor, either via Syslog or a control system manager capable of sending data to the Splunk platform.
You might need to use a relevant add-on from Splunkbase to collect the data and format the source type. The IoT and industrial IoT data and Operational technology data descriptors provide more information. The procedures below use Kepware data as an example.
How to use Splunk software for this use case
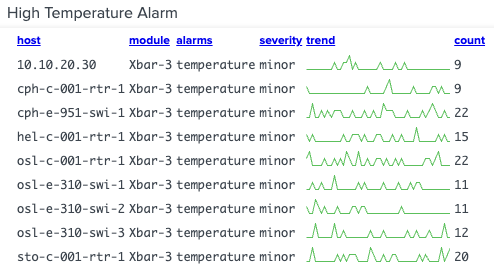
Monitoring temperature alarms
Run the following search. You can optimize it by specifying an index and adjusting the time range.
sourcetype=Kepware alarm temperature
| stats sparkline(count,15m) AS trend count values(alarm) AS alarms values(severity) AS severity BY host module
| table host module alarms severity trend count
Search explanation
The table provides an explanation of what each part of this search achieves. You can adjust this query based on the specifics of your environment.
| Splunk Search | Explanation |
|---|---|
sourcetype=Kepware alarm temperature |
Search for alarm and temperature data within the Kepware source type. |
|
|
Display a trend line of temperature alarms over the last 15 minutes. |
|
|
Display the results in a table with columns for host, module, alarms, severity, trend, and count. |
Results
Your results should look like this:
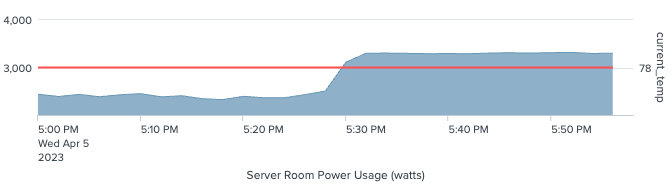
Checking power consumption in a single location
Now that you have noticed high temperatures you can now dive into potential root causes. One potential root cause could be high power consumption, which could lead to critical systems overheating and potentially cause outages.
This procedure can be applied to visualize sensor logs that collect power usage in watts from either a data center rack, or another device or room. Alerts can be customized with set threshold values when a higher than normal power utilization is observed.
Run the following search. You can optimize it by specifying an index and adjusting the time range.
sourcetype=Kepware units=W row=A rack=2
| timechart span=2m avg(Value) AS power
| eval current_temp=78
Search explanation
The table provides an explanation of what each part of this search achieves. You can adjust this query based on the specifics of your environment.
| Splunk Search | Explanation |
|---|---|
sourcetype=Kepware units=W row=A rack=2 |
Search Kepware data in row A, rack 2. |
| timechart span=2m avg(Value) AS power |
Generate a timechart that displays power usage in watts over time. |
| eval current_temp=78 |
Overlay the |
Results
Your results should look like this:
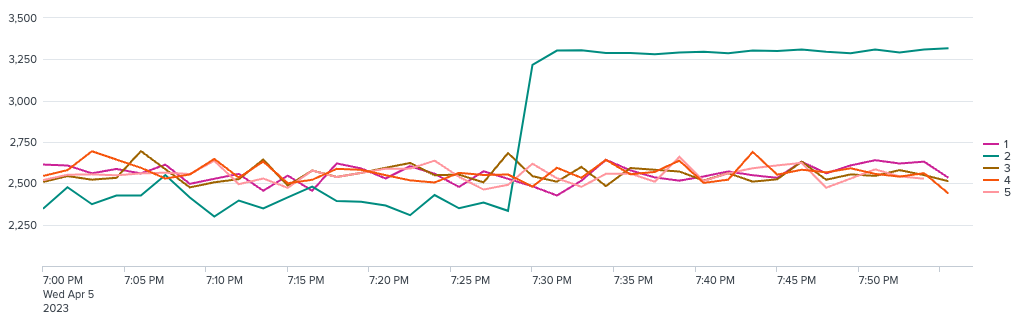
Comparing power consumption anomalies in a common location group
A variation of Checking power consumption in a single location can be used to overlay anomalies among multiple units in a common location group, to help you pinpoint the unit that is having an issue.
Run the following search. You can optimize it by specifying an index and adjusting the time range.
sourcetype=Kepware units=W
| bin _time span=1m
| stats avg(Value) AS Value BY device rack row _time
| search row=A
| timechart span=90s avg(Value) BY rack
Search explanation
The table provides an explanation of what each part of this search achieves. You can adjust this query based on the specifics of your environment.
| Splunk Search | Explanation |
|---|---|
sourcetype=Kepware units=W |
Search Kepware data in W unit. |
| bin _time span=1m |
Place continuous numerical values into discrete sets, or bins, grouped by a time span of a minute. |
| stats avg(Value) AS Value BY device rack row _time |
Calculate the average value of the Value field, grouping the data using the fields shown. |
| search row=A |
Search row A. |
| timechart span=90s avg(Value) BY rack |
Generate a timechart that displays the average value of the |
Results
Your results should look like this:
Checking room temperature
If the power consumption levels are fine, you should make sure the alarms are not caused by external factors, such as room temperature.
This query assumes data is coming in via Kepware Kepserverx which has connectors into industrial sensors and machines, including PLCs, RTUs, PACs, DAQs, and controllers.
Run the following search. You can optimize it by specifying an index and adjusting the time range.
sourcetype=Kepware units=W
| bin _time span=1m
| stats avg(Value) AS Value BY device rack row _time
| stats count AS value
| eval value = 78
| rangemap field=value none=0-99 low=100-199 guarded=200-299 elevated=300-399 high=400-499 severe=500-599 default=none
Search explanation
The table provides an explanation of what each part of this search achieves. You can adjust this query based on the specifics of your environment.
| Splunk Search | Explanation |
|---|---|
sourcetype=Kepware units=W |
Search the Kepware data center in W unit. |
| bin _time span=1m |
Place continuous numerical values into discrete sets, or bins, grouped by a time span of a minute. |
| stats avg(Value) AS Value BY device rack row _time |
Calculate the average value of the Value field, grouping the data using the fields shown. |
| stats count AS value |
Produce a single value result. |
| eval value = 78 |
Assign a constant value marker of 78 for all events in the dataset. |
| rangemap field=value none=0-99 low=100-199 guarded=200-299 elevated=300-399 high=400-499 severe=500-599 default=none |
Visualize the results in a marker gauge with pre-configured thresholds as shown. |
Results
Your results should look like this:
