Running Edge Processor nodes in Amazon EKS (Cloud)
Now that you have Edge Processor nodes running from containers, the next step in scaling Edge Processors is to to deploy, scale, and manage those containers with Kubernetes. In this series, we’re using Amazon EKS as our platform because it’s very common and a lot of the heavy Kubernetes lifting has been done by Amazon, in particular autoscaling, metrics, and load balancing. The details in this and the following article are generally compatible with other distributions of Kubernetes, but the specific implementation might vary slightly depending on the platform.
Prerequisite: Push the Edge Processor node container to a container registry
When you created the Edge Processor node container, it was done on a local server. Because of this, you will need to tag and push the container you created into a registry that is available to your Kubernetes environment. For EKS, a logical location is Amazon ECR, but any compatible registry will work. The steps for pushing container images to a registry are out of scope for this series.
As you will see in the Kubernetes deployment manifest section below, we include the container name and the path to that container. Whichever registry you use will be part of the manifest.
Determine Edge Processor GroupID management
As we saw in previous articles, each Edge Processor has a unique groupId that is supplied to the container in order for that node to be properly assigned to the corresponding Edge Processor. This groupId is a GUID and is not particularly reader-friendly when inspecting a deployment manifest, but the entrypoint script requires that a groupId GUID be provided. There are several possible approaches for adding it:
- Copy/paste: The
groupIdis in the UI for each Edge Processor. This ID can be copied from the UI and pasted directly into the manifest as the GROUP_ID environment variable. The manifest will require comments or manual inspection to understand which deployment belongs to which Edge Processor.
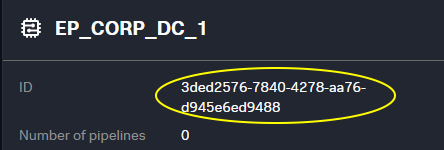
…manifest…
- name: GROUP_ID
  value: d81d22ae-6913-4ccf-a7d1-4afa6c7081bd
…manifest…
- Use a ConfigMap: The use of a ConfigMap allows for human readable manifests by pairing the name of the Edge Processor with its
groupId. A ConfigMap like this can be crafted manually or through the API.- Build a ConfigMap using the Splunk Cloud API. This approach requires a current token from https://console.scs.splunk.com/<your_tenant>/settings. It fetches the list of Edge Processors, uses jq to make key value pairs from the results, and then uses kubectl to create a ConfigMap called “ep-guids”. Here is an example:
curl --location 'https://<your_tenant>.api.scs.splunk.com/<your_tenant>/edge/v1alpha3/processors' --header 'Authorization: Bearer <your_token>' | jq -r '.[] | "\(.name)=\(.id)"' | xargs -I {} kubectl create configmap ep-guids --from-literal={} - Use the ConfigMap in the manifest. Now we can use the human readable form of the Edge Processor, and the value passed to the container will be the GUID value from the ConfigMap.
…manifest…
        - name: GROUP_ID
          valueFrom:
          configMapKeyRef:
          name: ep-guids
          key: EP_CORP_DC_1
        …manifest…
- Build a ConfigMap using the Splunk Cloud API. This approach requires a current token from https://console.scs.splunk.com/<your_tenant>/settings. It fetches the list of Edge Processors, uses jq to make key value pairs from the results, and then uses kubectl to create a ConfigMap called “ep-guids”. Here is an example:
Use Kubernetes secrets for service principal authentication
As we saw in the previous article that covered authentication requirements, the container’s entrypoint script calls the “auth” binary to retrieve a current API token during the container start process. We must supply the service principal name and private key to the auth binary. While we could use a configmap or hard-code this, the service principal name and private key are sensitive and should be stored securely. There are many ways to manage secrets, but a straightforward approach is to use Kubernetes secrets.
In this deployment example, we’ll use Kubernetes secrets to retrieve the name and key when provisioning the containers and pass them as environment variables to the init script. So we’ll first use the authentication bootstrap process to generate a service principal name and private key and then store them in secrets for later retrieval.
To create the service principal name secret from the bootstrap process, use something like:
kubectl create secret generic EdgeProcessorSecrets –from-literal=sp=<your service principal name> –from literal=pk='<your private key>'
The private key must be wrapped in single quotes to preserve the JSON formatting.
In the example above, we’re using kubectl to build the secrets on the command line for brevity. In practice, you might use manifests as we did with the configmap, in which case you will need to base64 encode the service principal values first.
Edge Processor deployment manifest
Download the deployment manifest here. Let’s take a look at the relevant items within the manifest:
apiVersion: apps/v1 |
Boilerplate deployment configuration. Customize to fit your environment as it relates to any annotations, labels, selectors, etc. The |
spec: |
Update the image location to point to your container registry and the name of the container for EP that you have built. |
env: |
Set the private key and service principal environment variables from the secrets you set above. These are required for retrieving a valid token during the bootstrap process. |
- name: GROUP_ID |
Set or retrieve the groupId GUID for the Edge Processor being configured. This example uses a human readable name “EP_CORP_DC_1” via a configmap. This could also be a hard-coded GUID. |
- name: SCS_TENANT |
Some final settings:
|
In your environment, you might choose to name your deployment something else, include additional annotations, set resource requests and limits, or put the deployment into a specific namespace. For purposes of this example, we’ve kept the deployment as straightforward as possible.
Apply the Edge Processor deployment
Now that we understand the main components of the deployment and have met the requirements, we can apply the manifest and watch the nodes come up using kubectl or other native tools.
Deploy from the command line
Run the following:
kubectl apply -f edgeprocessor.yaml
kubectl get pods
Monitor from the UI
| New instances will appear pending | They will transition to healthy |
|---|---|
 |
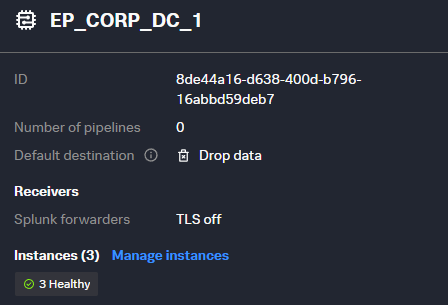 |
After the nodes have come up and are healthy, you are almost ready to send your data. In situations where the nodes are traditional servers, you could start sending data right away but because we’re in a containerized scenario, we need to expose access to the nodes through a load balancer. We’ll take a look at that in the next article. But before that, let’s briefly explore monitoring these nodes.
Monitor the Edge Processor deployment
As with all infrastructure, it’s important to monitor and measure your Edge Processors to ensure uninterrupted and reliable data flow. Additionally, while we’ll explore horizontal pod autoscaling in the next article, we can use the results from monitoring to decide when to scale up or down our Edge Processor deployment replica count. In this Kubernetes scenario, there are two distinct and complementary approaches to monitoring: monitoring natively in Splunk Observability Cloud, or monitoring metrics and logs in the Splunk platform.
Native Kubernetes monitoring in Splunk Observability Cloud
These Edge Processor resources can and should be monitored alongside other Kubernetes resources. This can be accomplished using Splunk Observability Cloud and the capabilities built into that platform for monitoring Kubernetes using the OpenTelemetry agents and instrumentation. This provides node and container level visibility with well-known metrics and topology views into the environment.
In addition to infrastructure level monitoring, the output from the Edge Processor runtime can be found in the pod logs as well as in the files located at /splunk-edge/var/log, in particular edge.log. These files can be included in your Kubernetes log monitoring regime.
However, as we’ll see next, Edge Processor nodes also send runtime logs and telemetry into your Splunk Cloud Platform environment, which can be used alongside native Kubernetes monitoring.
Edge Processor metrics and logs in the Splunk platform
Since the Edge Processors are provisioned and managed by Splunk Cloud Platform, the telemetry associated with the Edge Processor nodes (as opposed to the Kubernetes nodes) are automatically collected and sent to your Splunk indexers and can be used for reporting and alerting.
All the Edge Processor logs can be found in your Splunk _internal index using the source type splunk-edge. For example:
index=_internal sourcetype="edge-log"
This search shows the edge.log results for all of your Edge Processor nodes for troubleshooting and creation of searches, dashboards, and alerts.
In addition to the Edge Processor node logs, all of the nodes report a wide variety of performance metrics to the Splunk Cloud Platform _metrics index. You can explore these metrics using the Splunk analytics workbench or through search. You can discover all available metrics reported by Edge Processor using the following search:
| mcatalog values(metric_name) WHERE index=_metrics AND sourcetype="edge-metrics"
While we don’t explore the metrics and logs in this article, it’s worth exploring that data and considering your scale strategy based on the data provided.
Next steps
Now that we’ve got our Edge Processor deployment up and running and scaled for our needs, we need to create a path from our data sources into our Edge Processor nodes that are running in containers. To learn how, read the next article in this series, Load balancing traffic to Edge Processors in Amazon EKS.