Getting started with Splunk Essentials for the Financial Services Industry
Today, financial companies face immense pressure to safeguard customer data, meet strict regulatory requirements, and deliver exceptional customer service, all while managing an ever-growing influx of digital information. The rise of cyber threats, evolving compliance standards, and customer demands for seamless, secure experiences add to these challenges. Financial Services and Insurance (FSI) professionals must navigate fragmented data systems, identify risks, and make timely, informed decisions to stay competitive. Quick, clear access to unified data is critical for uncovering actionable insights, ensuring compliance, enhancing security, and improving operational efficiency.
Prerequisites
- Splunk Essentials for the Financial Services Industry
- Splunk platform
Data required
How to use Splunk software for this use case
The Splunk Essentials for the Financial Services Industry (FSI) app demonstrates how the Splunk platform can transform complex financial data into actionable insights. The app showcases example use cases for the finance vertical, with 144 use cases that show how the Splunk platform maximizes efficiency and allows practitioners to consolidate data into a single pane of glass. Each example's underlying data is derived from machine data, including application logs, metrics, and telemetry. The data is then refined through Splunk platform extensive intelligence capabilities using Splunk Search Processing Language (SPL).
Accessing the FSI Essentials Application
The Splunk Essentials for the Financial Services Industry app is available on Splunkbase. Alternatively, you can see the click-through demo to trial the app.
When you first access the FSI Essentials app, it opens to FSI use cases that are most common across the FSI industry:

FSI use cases
The app covers the most common use cases in the Financial Services Industry. These use cases are split into four different journey stages:
- Search & Investigation: Use search to refine the vast amount of data from various machine data sources. Next, investigate the refined data for details that impact the use case.
- Proactive Monitoring: Use the available machine data to monitor for specific occurrences. Generate notifications proactively based on the event's occurrence.
- Operational Visibility: Use advanced data sources to capture insights into your environment.
- Business Insights: As a business-aware analyst, apply data sources to correlate with real business KPIs.
The table below displays each use case and the associated examples in the FSI Essentials app.
| Use Case | Examples | Description |
|---|---|---|
| Banking Fraud | Duplicate Checks | When the same check number is used for the same customer more than once, it might be an attempt by an imposter to attempt fraud to steal funds. |
| Greater Than Balance | When a check is written that is greater than the account balance, it might be because someone has found a check and is impersonating the customer. | |
| No Check Number | When the check number is missing, it might be an attempt by an imposter to attempt fraud to steal funds. | |
| Order Check Non Active | When ordering checks for a terminated or suspended account, it might be an attempt by an imposter to attempt fraud to steal funds. | |
| Waiving Large Fee | Waiving a large fee by an insider for a customer is, by itself, not fraud, but the action should require a reasonable explanation to ensure that the insider and customer are not working together for actual fraudulent activities. | |
| Write Check Non Active | When writing checks for a terminated or suspended account, it might be an attempt by an imposter to attempt fraud to steal funds. | |
| Fast Transfers | An unusually high number of transfers within a short time could indicate account takeover for acts like money laundering. | |
| Large Withdrawal | When a large amount is withdrawn and it is the majority of the balance, it is important to flag this as an outlier to ensure that the customer is making the transaction. | |
| Multiple Balance Inquisitions in Short Period | It is unusual for a customer to check their account balance multiple times within a minute constantly. This could be a compromised account or the work of a bot checking the balance remotely. | |
| Multiple Deposits in Short Periods from Different Locations | It is unusual for customers to deposit funds into their account multiple times within a minute from different locations. This could be a compromised account where someone other than the customer has access to the account's credentials and is using the account for lateral movement for money laundering. | |
| Multiple IPs Accessing Short Period | It is unusual for a customer to perform actions against their account multiple times within a minute from different IP addresses. This could be a compromised account where someone other than the customer can access the account's credentials. | |
| Too Many 1 Cent Deposits | If multiple one-cent deposits happen per day for the same account, this could be a pivot point for money laundering. | |
| Too Many Transfers | An unusually high number of transfers compared to the normal distribution of transfers is worth investigating for either account takeover or laundering. | |
| Edit Profile with Large Withdrawal | Editing a profile and withdrawing a large amount is an example of event sequencing, where one event is followed by another in the fraud kill chain. Although there might be a legitimate reason for this, it must be investigated. | |
| Greater Than Balance for New Account | If the withdrawal exceeds the balance in a new account, suspect fraud as someone might be trying to take advantage of overdrafts and steal money. | |
| Greater Than Majority of Balance for New Account | If the withdrawal is greater than most of the balance in a new account, suspect fraud as someone might be stealing money with a fraudulent check that has not yet cleared or using this account as a pivot point for money laundering. | |
| Multiple Branches in Short Time Period | It is unusual for a customer to use multiple branches at almost the same time to withdraw funds. This is most likely fraud. | |
| Use Case | Examples | Description |
| Wire Transfer Fraud | New Account | Users who open up new accounts to transfer large amounts out on day one might be creating fraudulent accounts. |
| Denies | Users who login after a number of failures might be imposters who gained credential access. | |
| Multiple Client IPs | Users who transfer funds from multiple client IPs within a minute might commit fraud. | |
| Suspicious | Users who transfer significant funds to suspicious countries might have had their accounts taken over. | |
| Too Many | Users who are constantly transferring funds in a short amount of time might have had their accounts taken over. | |
| Use Case | Examples | Description |
| Payment Response | Missing | Payments requests that have no response indicate an error condition. |
| Outliers | Payments that take too long to process might be subject to fines and/or customer dissatisfaction. | |
| Statistics | By knowing who are the top users getting responses, you can gather insights on how to treat your best customers to better service. Also, over time, durations can tell how the system is performing. | |
| SLA Amounts | Payments that take too long to process might be subject to fines and/or customer dissatisfaction. It is essential to monitor response time for SLA infractions to improve customer experience. | |
| SLA Counts | Payments that take too long to process might be subject to fines and/or customer dissatisfaction. Visually seeing a count of payments that did not meet SLA due to their long durations can help speed up investigations into why. | |
|
Payment ITSI |
This example shows a Glass Table of a possible Payments Request Response service. Seeing the health scores of the KPIs in question can help determine the root cause quickly, if something goes wrong. |
|
| Use Case | Examples | Description |
|
ATM Fraud |
Example Risk Scores |
Finding out who are riskiest users can help determine if their questionable transaction activity might be involved in fraud. |
|
Fraud Outliers |
Users who use the ATM more than average users might have questionable motives or have their credentials stolen. Also, look at their risk scores. |
|
|
10000 Fraud |
Users who slip multiple transactions in a short amount of time just under government detection might be participating in money laundering schemes. |
|
|
Location Fraud |
Users who withdraw from multiple ATMs at almost the same time are most likely committing fraud. |
|
|
Testing Fraud |
Rarely do users withdraw very small amounts and very large amounts in a short one-minute window. These users might be testing the machine and then taking home a large payload |
|
| Use Case | Examples | Description |
|
MFID |
Time Drift |
Hosts that have a significant time drift might affect the best execution. |
|
Time Drift Impact on Buy Orders |
Hosts that have a large time drift might affect the best execution. Knowing what aggregate trade amounts were involved on that host at the time of drift is a key KPI for judging possible impacts. |
|
|
Time Drift Impact on Sell Orders |
Hosts that have a large time drift might affect the best execution. Knowing what aggregate trade amounts were involved on that host at the time of drift is a key KPI for judging possible impacts. |
|
|
Best Execution Buy Violations |
Violating Best Execution (FINRA Rule 5310) might result in penalties. |
|
|
Best Execution Sell Violations |
Violating Best Execution (FINRA Rule 5310) might result in penalties. |
|
| Use Case | Examples | Description |
|
Credit Card Fraud |
Rare Large Spending |
Rarely using a card and suddenly spending too much could signify a stolen credit card. |
|
Too Many Transactions |
Too many transactions in one minute could indicate a stolen card. |
|
|
Buy Small, Then Large Quickly |
Testing a card and using it immediately for a large purchase could indicate a stolen credit card. |
|
|
Large Spending on New Category |
Buying an expensive item from a new category could indicate a stolen credit card. |
|
|
Large Spending Quickly |
Going on a shopping spree in a short amount of time with many transactions might indicate fraud. |
|
| Use Case | Examples | Description |
|
Bank Account Compliance |
Dormant Accounts for Customer |
If a customer's other accounts, which are older than 6 months, have not been touched, then inform the customer so they can take action. |
|
Large Account Balance for Customer |
In certain countries, accounts are insured only up to a certain threshold. Inform the customer that their accounts are not totally insured after a certain total amount. |
|
|
Negative Account Balance |
A negative balance could indicate an overdraft or account takeover. |
|
|
Too Many Accounts for Customer |
Too many accounts might mean consolidation is called for or to check if accounts were created just for commissions. |
|
|
Zero Account Balance |
A zero balance could indicate a bogus account created for commissions. |
|
| Use Case | Examples | Description |
|
FIX Order |
All FIX Data Human Readable |
By making the FIX order logs human-readable, it makes searching easier. |
|
Getting Average Symbol Price from FIX |
By making the FIX order logs human-readable, searching becomes easier. An average price per symbol gives an at-a-glance report on how prices are doing for the symbols in the FIX orders. |
|
|
FIX Message Types Distribution |
By making the FIX order logs human-readable, searching becomes easier. This data can then be used for reports such as the distribution of message types. Decisions can then be made on this distribution. |
|
|
FIX Order Types Market Closing Distribution |
By making the FIX order logs human-readable, searching becomes easier. Reports on the type of order can then be created, which helps see how many orders will process immediately and how many will wait for a limit. |
|
|
Order Status Distribution for FIX Orders |
By making the FIX order logs human-readable, reporting becomes more straightforward. A distribution by order status gives a quick report on how FIX orders are flowing. |
|
| Use Case | Examples | Description |
|
Bitcoin |
Transaction Index Tracing |
By tracing the transaction flow for Bitcoin, you can troubleshoot and get insights. |
|
Average Block Fee |
Reports on average block fees can provide insights into how they are trending. |
|
|
Average Market Price |
Reports on the average market price of Bitcoin can help make decisions on investment. |
|
|
Average Miners Revenue |
The average miner's revenue over time report can be used to provide insights. |
|
|
Average Trade Volume |
The average trade volume of Bitcoin can be used to see the market's volatility. |
|
| Use Case | Examples | Description |
|
Trade - Where is it? |
Top Customers Trading |
By knowing who are your top customers trading, you can separate your high-value customers and also have insight who they are day to day. |
|
Where is it trading? |
"Where is my trade?" is a popular question. This is involved for troubleshooting as trades travel from the front to the back office (application to application) and for reporting. |
|
|
Statistics for Prices of Bought Symbols |
Statistics on buy orders such as min, max, mean, and standard deviation of price can help analysts make decisions in near-real time using machine data rather than relying on an hourly report. |
|
|
Statistics for Prices of Sold Symbols |
Statistics on sell orders such as min, max, mean, and standard deviation of price can help analysts make decisions in near-real time using machine data rather than relying on an hourly report. |
|
|
Trading Total Volume Bought By Symbol |
Knowing the highest quantity bought by symbol provides insights into market trends. This quantity and symbol list will change from hour to hour and day to day. |
|
|
Trading Total Volume Sold By Symbol |
Seeing what symbols are involved in sell orders by their quantity can help drive some decisions. This list will change from hour to hour and day to day. |
|
| Use Case | Examples | Description |
|
New User Login |
Authorized after Denial |
Customers register for the bank. They then try to login, but are denied on purpose for whatever business reason. They try again and now they are authorized. Something changed to allow for this. |
|
Denied |
After a customer registers for login at your web site, they are denied access. This example lists customers who were denied access for whatever reason. |
|
|
Errors |
After registering for a login, a customer receives an error upon logging in, leading to a bad customer experience. |
|
|
Action Location Chart |
This example counts the actions that occurred at given locations from where new users are logging in. |
|
|
Attempts over Time |
Viewing the types of action split by location over time is useful for analysts gauging customer experience. |
|
|
Authorized vs Denied over Time |
The purpose of this example is to show two actions (authorized and denied) split by location to show relative contrasts. |
|
|
Response Location Chart |
The purpose of this example is to monitor the average response time for new login attempts over time split by location. |
|
|
Response Time Outliers |
Response time outliers are customers who took the longest to log in. This group of customers had the worst customer experience regarding response time. |
|
|
Trellis Action Chart |
A trellis chart for different actions (authorized, denied, and error) is provided for this example for new account logins. Side-by-side comparisons provide useful information on trends. |
|
|
Response Time Comparisons |
The purpose of this example is to compare the average response time and counts of new account logins with different time periods. |
|
| Use Case | Examples | Description |
|
ATM Statistics |
Average Withdrawal and Deposit Amounts |
The example is used to provide two single numbers, average withdrawals and average deposit amounts to get a quick KPI of the ATM business. |
|
Withdrawal Top Users |
Getting the top users who withdraw money, in terms of counts for number of withdrawals and total amounts by user, is the purpose of this example. |
|
|
Deposit and Withdrawal Maps |
Maps of deposits and withdrawals are important visual KPIs for tracking ATM activities. |
|
|
Deposit and Withdrawal Trellis Charts |
A trellis chart of top users depositing and withdrawing is the purpose of this example. Analysts can understand typical behaviors by having the users' activities shown side-by-side. |
|
|
Durations at Locations Over Time |
We can compute the duration of a transaction in a maximum of 5 minute spans per locations. Showing a timeline view of these durations per location gives a linear view of the activity per location. Sparse activity might need to be investigated for locations that are expected to be busy. |
|
|
Fine Grained Location Usage Over Time |
A horizon chart will show color-coordinated relative increases and decreases of a KPI over time. This is useful for ATM location monitoring to understand the usage at each location. |
|
|
Withdrawal Split by User and Location |
A Sankey diagram shows the relative size of a KPI from a source to destination. This example uses a top user as the source and the location as the target. |
|
| Use Case | Examples | Description |
|
Wire Transfer Statistics |
Errors |
When a wire transfer attempt is made resulting in an error condition, it causes a bad customer experience. Look for these conditions proactively. |
|
Maps |
Providing a visual map for where wire transfers originate and terminate is the purpose of this example. |
|
|
Max Amounts |
Banks want to know the highest amounts being transferred out of their bank as this is something worth monitoring to understand if it is chronic for the same customer or is it a one-time anomaly. |
|
|
Actions |
Wire transfers result in a number of action results. In our example, actions might be authorized, canceled, denied, or in error. By seeing a distribution of these actions across time, analysts are in a better position to judge how the business is performing. |
|
|
Amount Outliers |
Users who have transferred amounts larger than the general population of users might be worth monitoring. Is this a one time large transfer or are they consistently on lists for the largest amounts being transferred? |
|
|
IPs |
The Maps example shows where wire transfers originate and terminate. This example shows the top originations and destinations over time. |
|
|
Sankey |
Linking the origination and destination for a wire transfer by the amount of times the two were used is useful for analysts. A Sankey diagram is a natural fit for this example. |
|
| Use Case | Examples | Description |
|
Transaction Statistics |
Transactions that only made 1, 2, or 3 steps |
The Splunk platform is used to monitor a four-step transaction. By monitoring the list of sessions that only made it partially to the end, analysts can make better decisions to improve the application. |
|
Average Duration Chart for Transactions that Completed |
The Splunk platform is used to monitor a four-step transaction. A timechart is used here to show the average duration of transactions that made it to all four steps. |
|
|
Categorizing Transaction Steps by Count by Step |
The Splunk platform is used to monitor a four-step transaction. Knowing the counts for how many transactions made it to a particular step is important for analysts to gauge the application. |
|
|
Counts for Terminated Transaction That Did Not Finish |
The Splunk platform is used to monitor a four-step transaction. Knowing how many terminated at each step helps analysts gauge the application. |
|
|
Outliers in Transaction Duration |
The Splunk platform is used to monitor a four-step transaction. This example is used to find outliers for the average duration for the transaction. |
|
|
Top Customers Completing Transactions |
The Splunk platform is used to monitor a four-step transaction. This example lists the top count of customers who had completed transactions. |
|
|
Transaction Steps Seen Over Time |
The Splunk platform is used to monitor a four-step transaction. This example shows a timechart for when each step of the transaction was reached. This will show when steps start and end over time. |
|
|
Average Duration in Between Steps of a Transaction |
The Splunk platform is used to monitor a four-step transaction. The average duration in between steps is listed in this example. |
|
|
Average Duration in Between Steps of a Transaction in Sankey |
The Splunk platform is used to monitor a four-step transaction. This example shows the average duration in between steps of the transaction as a Sankey diagram. |
|
| Use Case | Examples | Description |
|
Credit Limit Increase |
Authorization Details |
In this example the data in the Splunk platform, along with reference data, is used to authorize a credit limit increase for customers. |
|
Denial Details |
In this example the data in the Splunk platform, along with reference data, is used to provide reasons to deny a credit limit increase for customers. |
|
|
Authorization vs Denial over time |
In this example the Splunk platform is being used as a source, along with reference data, to decide whether to authorize or deny a credit limit increase for customers. The example shows the decision counts over time. |
|
|
New Credit Limit Requested Amount over Time |
In this example, the Splunk platform is used as a source, along with reference data, to make authorization decisions for customers' credit limit increases. This example then shows the average new limit over time. |
|
|
Denial Counts Side-by-Side |
In this example, the Splunk platform is used as a source, along with reference data, to use rules to deny a credit limit increase for customers. The reasons for the denial are shown side-by-side over time. |
|
| Use Case | Examples | Description |
|
Credit Card Statistics |
Authorization Issues |
A customer or entity might cancel a credit card authorization attempt. If they initiate it again and are authorized, this KPI needs to be noted just to see how many times this occurs in a given time period. Other customers might simply cancel and some customers might receive errors. Each of these should be reported. |
|
Usage Counts by Authorization Status |
Credit card authorization attempts can lead to authorized, denied, cancelled, or error response actions. Each subcontractor (partner) who licenses the credit card will provide a status. These statuses can be summed up and shown by the subcontractor. |
|
|
Authorization Response Times by Subcontractor |
Comparing the average response time for credit card authorization attempts over time split by subcontractor is the purpose of this example. |
|
|
Authorizations and Denials by Subcontractor |
Subcontractors for credit card authorization will provide response action statuses (authorized vs. denied) over time. By providing a report on this over time, a bank can gauge the performance of their underwritten cards issued to their partners. |
|
|
Authorizations Today vs. Yesterday |
Banks want to know the average daily response time for credit card authorization attempts. This example provides a report comparing one day to the day before. |
|
|
Usage Highest Response Times |
These are your outlier credit card authorization customers in terms of response time. They have the highest average response time compared to other customers in a given time period. |
|
|
Usage Top Customers' Authorization Counts |
These are your outlier credit card authorization customers. They have received the highest number of authorizations in a given time period. |
|
|
Authorization Counts by Subcontractor |
Banks want to monitor each one of their subcontractors to see how they are performing in terms of authorization attempts. This example provides reports split by each contractor on counts of actions that resulted per authorization attempt. |
|
|
Authorization ITSI |
This example shows a Glass Table of a possible credit card authorization service. Seeing the health scores of the KPIs in question can help determine the root cause quickly, if something goes wrong. |
|
| Use Case | Examples | Description |
|
Mobile Payments |
95th Percentile Split by Vendor |
Summarizing the payment amounts per vendor over time is one way to judge performance. Using the 95th percentile over time gives a view of the highest individual payments for each vendor during a time slice, another view into this data. |
|
Application Crashes and Last Operation Counts |
Knowing which operations occur the most right before the Mobile Payments app crashed helps narrow down which operations are more likely to lead to application crashes. |
|
|
Authorizations vs. Denials Over Time |
Mobile payments, like in-store payments, need to be monitored over time slices for authorizations and denials. This can help improve the process's efficiency and help troubleshoot if there are outliers for a particular time slice. |
|
|
Customers Making Most Payments |
It is always relevant to know which customers use the system most. This provides insights to customers and also helps to see if one segment of customers is dominating the results because of their location or if there is some added incentive to make mobile payments. |
|
|
Errors by Version and Mobile OS |
Knowing which application version and mobile OS combination produces the most errors makes troubleshooting easier. The next step is to drill down into the errors to understand the root cause. |
|
|
Help Section Clicks |
Knowing which help sections of the mobile app were clicked on most will improve that section. |
|
|
Highest Payments by Customer |
Finding the highest value customers based on payment amounts for a time period has uses in marketing and sales. It serves an indicator for how much money is being used by the top customers via mobile payments and this can be compared to regular credit card payments to see if there is an upward trend for the use of mobile payments. |
|
|
Response Times per Location |
By knowing the average response time per location, the bank can learn how each location performs with the payment app. Sometimes distance or a bad network plays into high response times. This is important to understand if a particular location is causing problems so that network providers can address it quickly before customers start complaining. |
|
|
Response Times per Mobile OS |
By knowing the average response time per mobile OS, the bank can learn how each mobile OS performs with the payment app. This is important to understand if a particular OS is causing problems so that an app developer can address it quickly before customers complain. |
|
|
Response Times per Vendor |
By knowing the average response time per the partners payment channel, the bank can decide who has met and not met SLAs. This is important for promoting what vendor to use and to understand which vendors are having trouble meeting the expected response times. |
|
|
Response Times without Outliers |
Removing outliers from the average response time gives a picture of what it should be or ought to be. Sometimes outliers that do not repeat get in the way of real analytics. This approach can help show the average response time in a more realistic view. |
|
|
Mobile OS vs. Locations |
Knowing which locations are using which Mobile OS is an important statistic for grouping users and troubleshooting. For instance, if you find that users in City A are using OS B and have the worse satisfaction, then it is time to investigate if the OS is causing application issues. |
|
|
Amount Outliers |
Anomalies in mobile payments can include outliers outside of degrees of standard deviation, which can help in several use cases, including marketing, security, and even troubleshooting. For instance, faulty software might be sending less than what was actually paid because the user is using an old version of an app. |
|
|
Amount Outliers using Average Plus Standard Deviation |
Finding customers that paid the most in a time period on average is an easy way to find high-value customers. |
|
|
Amount Outliers using IQR |
The interquartile range (IQR) is a stable measure of spread in that it is not influenced by unusually large or unusually small values for payment amounts. This keeps one or two extreme values from influencing the whole data set and makes it easier for analysts to target ranges for further work involving marketing or troubleshooting. |
|
|
Anomalous Values of Response Times |
Finding events with anomalous values for response time might assist in troubleshooting without looking through every event. The |
|
|
Future Counts |
Predicting the future count of mobile payments provides a forecast for marketing and sales marketing and sales, a capacity number for network engineers, and an idea for future scale for application developers. |
|
|
Future Response Times |
Predicting the future average response time for mobile payments provides networking engineers and application developers a sense of the capacity of the mobile payments system. |
|
|
OS Analytics |
Knowing which locations use which mobile OS to make payments is always relevant. This helps in the development of mobile apps and also provides insight into sales and marketing opportunities. |
|
|
Response Times Outliers using Mobile OS |
Finding response times that are the highest using customer and mobile OS combinations might help narrow down an SLA problem. |
|
|
Response Times Outliers using Vendors |
Finding response times that are the highest using customer and vendor combinations might help narrow down an SLA problem. |
|
|
Summarized Amounts by Vendor and OS |
By understanding which white-label vendor and mobile OS combination is involved in the most or least payment amounts, analysts can further investigate the reasons for the outliers and take any necessary corrective or reinforcement action. |
|
|
Unexpected Response Times by Location |
Finding events that are not expected based on response time and location groupings might assist in troubleshooting without having to look through every event. An unexpected score is assigned to each event, and using this can save time. The unexpectedness score of an event is calculated based on the similarity of that event's response time/location grouping to a set of previous events. |
|
|
Associated Actions |
Knowing which values for which operation, location, or application version decrease the entropy of the payment action, an analyst can use this information in further machine learning models. |
|
|
Average Payments Cluster |
Performing an average of payments over time does not give subtle information on what numbers comprise the average, as one number can skew the average. Breaking it into categories can provide more insight. |
|
|
Average Response Time of All Events |
Comparing the average response time for the mobile payments app in time slices against the overall average response time of all events within the same time chart provides a visual on the upward or downward ebbs and flows of the overall system. This can further be used to improve performance. |
|
|
Average Response Time per Help Section |
Having fine-grained views on the average response time for different parts of the mobile payments app gives a more precise understanding where to focus efforts to fix issues. |
|
|
Average Response Time with Trendline |
An upward or downward trend line can indicate changes in system performance that might lead to faster reactions for improvement, if necessary. |
|
|
Least Probable Events |
Anomalies in mobile payments can either be ignored (as in a marketing use case) or might stand out (as in a fraud use case). Either way, knowing which events are outliers can help analysts. |
|
|
Map of Amounts Authorized by OS |
Understanding the demographic breakdown of payment by locations and OS gives an analyst a real-time view of where to target promotions and where certain areas and mobile OS combinations might need more help with marketing. |
|
|
Tabular View Split by Location and Vendor |
A quick tabular view of mobile payment amounts for location and vendor combination gives a summary view of the business to see which location or payment vendor is doing best. |
Analyzing data and extracting SPL
When you have identified a potential FSI use case and example, the next steps are to analyze the extracted data further and customize the SPL.
As each use case example is expanded, search outputs are displayed. These illustrate what the search output provides. For instance, the search output for Duplicate Checks displays customer names who have used a duplicate check number. The search output also displays the check amounts and the recipient, as shown below:

As each use case example is expanded, the Sample Data Search is displayed. The SPL displayed here is an example. Most customers will build upon this to refine the search specific to their variables. For example, going back to the Duplicate Checks example, the associated SPL is:
| inputlookup check_num.csv
| eval _time=strptime(_time, "%Y/%m/%d %H:%M:%S")
| sort - _time
| eval amount=tostring(round(amount, 2),"commas")
| stats count values(amount) AS amount values(to) AS to BY customer, check_num
| where count>1
| eval isOutlier = 1
From the example use case window, users can also click “Show SPL” which opens a new window explaining the associated SPL, as displayed below:

To dive deeper into the SPL and customize it, click the View SPL option. As shown below, this opens the Search window.
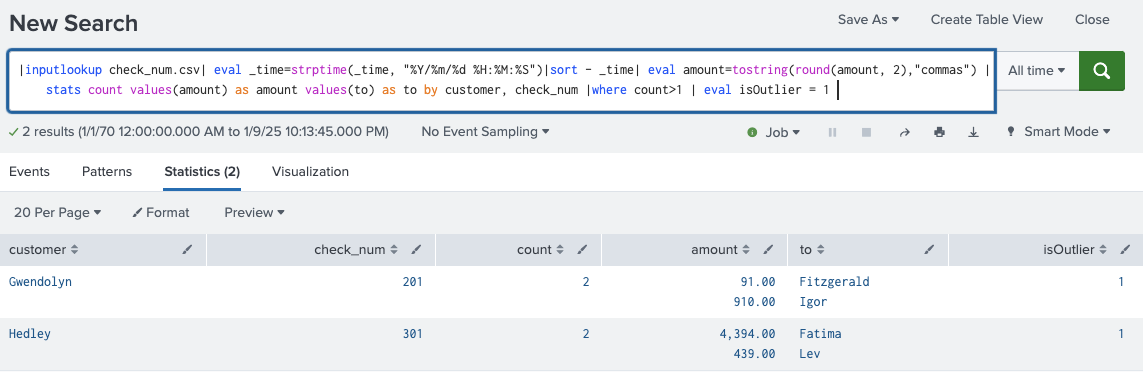
From here, you can fine-tune the variables specific to the environment for the use case and extract the refined data. You can also modify the time variables or format the display to meet reporting requirements.
FSI use case dashboards
An example dashboard is shown for several of the use cases. The dashboard is based on the search output and display options. It provides an example baseline and can be customized to meet specific organizational requirements. For example, the use case for ATM Example Risk Scores provides a dashboard with the “Top 5 Riskiest Users,” as shown below.

Next steps
These resources might help you understand and implement this guidance: