Improving hardware utilization by moving indexers into Kubernetes
This article discusses a project to make improvements to ingestion and search performance. After running bare metal indexer clusters for a number of years, we had large machines, with 96 logical processors and 192GB RAM. However, we rarely exceeded 30 percent CPU usage.
At the Splunk platform level, we could add more parallelIngestionPipelines to improve ingestion performance or adjust the batch_search_max_pipeline for better search performance (specifically for batch searches). However, neither of these settings appeared to make much difference. The parallelIngestionPipelines option has diminishing returns above two, and we saw minimal benefit to increasing this on the indexing tier. The batch search setting only affects batch searches, which represented a fraction of the overall search workload.
Increasing ingestion volume simply resulted in the queues filling on the indexers, even though the hardware seemed underutilized at all levels (CPU, memory, and I/O).
How to use Splunk software for this use case
Moving to Kubernetes (K8s), and, therefore, the Splunk Operator for Kubernetes (SOK), was an attempt to improve utilization of our hardware by running multiple indexers (or K8s pods) on each bare metal server.
This article focuses on indexing tier improvements. For a look into our lessons learned from implementing SOK, see Splunk Operator for Kubernetes: Initiial implementation learnings and Splunk Operator for Kubernetes: Advanced operational learnings.
What were the results?
The results varied depending on the search workload involved. With an extremely heavy search workload, we saw a 30 percent increase in ingestion per server with no decrease in search performance. Search performance actually appeared to improve, but due to difficulties in measuring that, we won't make the claim definitively. We were able to run two pods per server in this scenario.
On the indexers with a lower search workload, we saw 50 percent or more increase in ingestion per server. One cluster approached 1TB/day of ingestion per machine and managed to not completely fill the indexing queues. There was a small impact to search performance. In this scenario, we were able to run four pods/server.
While we tested four pods/server on the heavier workload and eight pods/server on the lighter workload, neither experiment ended well.
How did we measure performance?
Indexing tier
We used the following measures:
- Indexing queues fill % (TCP input and replication queues in particular)
- GB per day of data ingestion per indexer
- Searches per day for each indexer
- OS level and K8s pods performance (CPU, memory, and IO stats)
- Events/second benchmark
When using SmartStore, we also checked whether we were comparing with or without the cache full. When the cache is not at capacity, there are fewer evictions (deletions). If we combine this with minimal SmartStore downloads, there will be a lighter I/O workload on the server.
The Alerts for Splunk Admins app from Splunkbase contains the dashboards and reports that are mentioned within this presentation. In particular, the dashboard indexer_max_data_queue_sizes_by_name was used for many of the screenshots, along with splunk_introspection_io_stats to check I/O level stats.
The report IndexerLevel — events per second benchmark was used to approximate events/second coming back from the indexing tier without including any search head level overheads.
We welcome feedback on these criteria in the comments or on #splunk-operator-for-kubernetes on Splunk Community Slack.
Search head level
These criteria are my initial attempt to measure the indexer performance from a search point of view:
- Find searches that have not changed in the past 90 days
- Filter out those using
multisearch,append, andjoinsubsearches - Use
index=_introspection sourcetype=search_telemetryto determine indexer execution times usingphases.phase_0.elapsed_time_aggregations.avg - Further narrow down to indexes with a semi-consistent ingestion volume
I also created the report IndexerLevel — savedsearches by indexer execution time to help find searches with this criteria. In retrospect, the filtering might not have been required. Subsearches do not have their performance recorded in the introspection data at the time of writing. Additionally, I am unsure if the phase0 statistics from search_telemetry were different when using the multisearch search command, or if the statistics change when using subsearches.
After I had enough searches that matched the criteria, I built a dashboard to compare as we moved indexers into K8s to see if performance improved or degraded.
Again, we welcome feedback on these criteria in the comments or on #splunk-operator-for-kubernetes on Splunk Community Slack.
Performance comparisons
There were three unique indexer cluster setups, each with a distinct Splunk search and ingestion workload. The primary and the Splunk Enterprise Security (or security) cluster existed prior to the K8s project. The results of pre and post-migration to K8s are provided. The “other” cluster was built on K8s and, therefore, there is nothing to compare to.
We also ran a comparison in terms of attempting to run “more” pods per node than the initial setup (2–4 pods per node). This was inspired by the HPE, Intel, and Splunk Partner to Turbocharge Splunk Applications article that shows they were able to run 12 pods per node. While I was skeptical that our search workload would work well with more than four pods per node, I did quickly find the limits of pods per node with our current hardware.
The expandable sections below detail the measurements from the various indexer clusters.
- ► Indexer performance — primary cluster
-
- Performance prior to Kubernetes
- Performance on Kubernetes
- Performance on Kubernetes with two pods down
- Performance on Kubernetes with four pods per server
- Performance on Kubernetes — newer versus older generation hardware — two pods per server
Performance prior to Kubernetes
This section summarizes the workload of the “main” indexer cluster while running on bare metal servers.
Splunk profile
- 1.2-1.4 million searches/day
- Ingestion of 270GB-350GB/day/indexer
- Indexing queues sometimes blocked, replication delays of up-to 15 seconds
- Data ingestion delays of average of 20-30 seconds (HF tier -> Indexers)
Hardware setup
- 96 logical processors — Intel(R) Xeon(R) Gold 6248R CPU @ 3.00GHz
- 384GB RAM
- 28TB cache per-node (RAID 0 NVMe)
- CPU trend of 20-45 percent
- I/O trend of trend of 1500-3000 IOPS
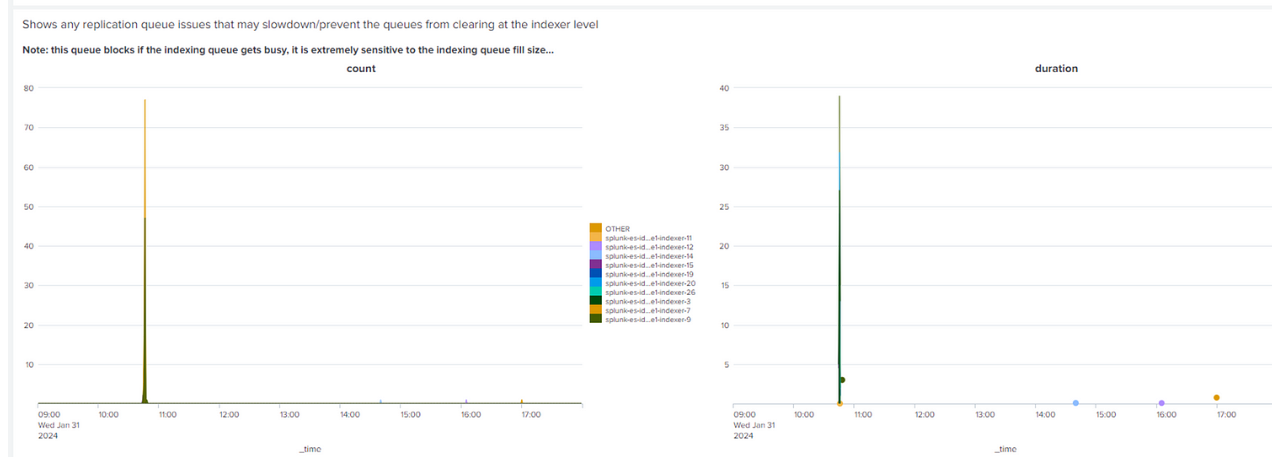
Indexing queues, 9AM — 6PM , five minute blocks, max fill %

Replication queues, 9AM — 6PM

Performance on Kubernetes
This section summarizes the workload of the “main” cluster built for K8s. It has the same configuration as the primary cluster but a newer generation of hardware with an equal amount of logical processors, memory, and total disk space. This setup has two K8s pods per node/bare metal server.
Splunk profile
- 1.2-1.4 million searches/day
- Ingestion of 215GB-250GB/pod/day, 500GB/day/server
- Close to zero indexing queue fill, no replication queue issues
- Data ingestion delays of average of 13 seconds (HF tier -> Indexers)
Hardware setup
- 96 logical processors — Intel(R) Xeon(R) Gold 6342 CPU @ 2.80GHz CPU
- 384GB RAM per server
- 44 logical processors/168GB RAM per pod
- 11.2TB cache per-pod (RAID 0 NVMe)
- CPU trend of 20-35 percent (OS level)
- I/O trend of 800-1000 IOPS (OS level)
Note that the SmartStore cache was not full. Additionally, the newer generation CPU has a slower clock speed but has improved performance.
Indexing queues, 9AM — 6PM , 5 minute blocks, max fill %

Replication queues, 9AM — 6PM

Summary — Legacy (prior to K8s) compared to K8s
K8s had a Splunk level data ingestion of 250GB/pod/day or 500GB/day/server. Non-K8s had a Splunk level data ingestion of 330GB/day.
The results on K8s were an approximately 50 percent increase in ingestion data. There were also fewer indexing queue issues on the K8s cluster. This K8s hardware has a newer CPU spec and newer NVMe disks, so this is not a fair comparison.
SmartStore downloads did block the indexing/replication queues. This occurred on both K8s and bare metal.
Performance on Kubernetes with two pods down
This setup is identical but we had one node down (two pods), resulting in a higher workload for the remaining pods. This comparison is useful as we’re closer to the upper limits of what can be done with this search/ingestion workload. The ingestion per day per pod was close to 270GB/indexer pod (or 540GB/server/day).
Indexing queues, 9AM — 6PM , 10 minute blocks, max fill %, two pods down

Queues were measured using the maximum value (max), the pods actually performed very well. Minimal difference was found in search and indexing performance.Replication queues, 9AM — 6PM, two pods down

Summary — Kubernetes with two pods downNo issues were noticed, excluding SmartStore downloads blocking indexer and replication queues. Searches manually measured appeared to be 5–10 percent slower. However, this is not objective enough for a conclusion.
- CPU trend of 40-50 percent (OS level)
- I/O trend of 1500-3000 IOPS (OS level)
- SmartStore cache was not filled. SmartStore had active downloads in this test.
After the SmartStore cache was filled, minimal difference was found in the months after these screenshots. Heavy SmartStore downloads did block the indexing queues. However, the downloads appear to have less impact since Splunk version 9.1.3 and SOK version 2.5.0.
Performance on Kubernetes with four pods per server
This is the same hardware setup as described previously. Instead of running two pods on a node, we tested running four pods on a node to attempt to further utilize the hardware we had available.
Splunk profile
- 1.2-1.4 million searches/day
- Ingestion of 144GB/pod/day, 576GB/day/server
- Indexing queue heavily filled
- Data ingestion delays of average of 76 seconds (HF tier -> Indexers)
Hardware summary
- 96 logical processors — Intel(R) Xeon(R) Gold 6342 CPU @ 2.80GHz CPU
- 384GB RAM per server
- 22 logical processors, 90GB RAM/pod
- 5.6TB cache per-pod
- CPU trend of 50-98 percent (potential CPU throttling due to heat issues)
- I/O trend of 1000-3000 IOPS
- SmartStore cache was not filled. Ingestion delay spikes were much higher than previously measured.
Indexing queues, 9AM — 6PM, five minute blocks, max fill %

Summary — Legacy to K8s — all scenarios- Legacy or prior to K8s achieved 330GB/server/day.
- K8s with two pods/server resulted in 500GB/server/day — 50 percent more data per server than legacy.
- K8s with two pods/server, with two pods down in the cluster, 540GB/server/day— 63 percent more data/server than legacy.
- K8s with four pods per server resulted in 576GB/server/day — 75 percent more data/server than legacy.
- Four pods per server did not work well in terms of ingestion, search performance was likely degraded as well.
- The two pods per server appears to be the preferred setup for this hardware/search workload combination and did not result in any measurable decrease in search performance.
Performance on Kubernetes — newer versus older generation hardware — two pods per server
The indexer clusters for K8s had a mix of older and newer hardware as nodes. Therefore it was possible to directly compare the differences for an identically configured indexer cluster.
Splunk profile
- 1.4 million searches per day
- 235GB/day/pod, 470 GB/day/server, newer hardware
- 210GB/day/pod, 420 GB/day/server, older hardware
- Close to zero indexing queue fill, minimal replication queue issues
- Data ingestion delays of average of 13 seconds (HF tier -> Indexers)
Hardware summary
- 96 logical processors
- Intel(R) Xeon(R) Gold 6342 CPU @ 2.80GHz CPU, newer hardware
- Intel(R) Xeon(R) Gold 6248R CPU @ 3.00GHz, older hardware
- 384GB RAM per server
- 44 logical processors/168GB RAM per pod
- CPU trend of 25-50 percent (OS level), newer hardware
- CPU trend of 35-55 percent (OS level), older hardware
- I/O trend of 1000-3000 IOPS (OS level), both types of hardware
- Two disks (RAID 0 NVMe), newer hardware
- Four disks (RAID 0 NVMe), older hardware
- 11.2TB of cache per-pod
- SmartStore cache not filled
Summary — Kubernetes newer vs older generation hardware
The newer hardware utilized less CPU for a workload with more data. Additionally, the search performance was slightly faster on the new hardware.
- ► Indexer performance — Splunk Enterprise Security cluster
-
The indexer cluster that hosts security related indexers had identical hardware to the primary cluster. However, it had a different search workload.
- Performance prior to Kubernetes
- Performance on Kubernetes
- Performance on Kubernetes with four pods per node — sixteen pods down
Performance prior to Kubernetes
This section summarizes the workload while running on bare metal.
Splunk profile
- 350K searches/day
- Ingestion of 190GB-200GB/day
- Indexing queues mostly free, close to zero replication queue issues
Hardware summary
- 96 logical processors
- 384GB RAM
- CPU trend of less than 10 percent
- I/O trend of 1500 IOPS
- 28TB cache per server
Performance on Kubernetes
This section summarizes the workload of the ES cluster built for K8s, the bare metal hardware mentioned above was used for the K8s nodes. Four pods per node were configured.
Splunk profile
- 350K searches/day
- 125GB/pod/day, 500GB/server/day
- A peak of 200GB/pod/day, 800GB/server/day
- Indexing queues slightly filled, close to zero replication queue issues
Hardware summary
- 24 logical processors/90GB RAM per pod
- CPU trend of 20-35 percent, newer hardware
- CPU trend of 25-40 percent, older hardware
- I/O trend of 1500-3000 IOPS
- One disk (no RAID), newer hardware
- Two disks (RAID 0), older hardware
- 5.2TB cache per node
- SmartStore cache filled
Indexing queues, 9AM — 6PM , five minute blocks, max fill %

Replication queues, 9AM — 6PM
Performance on Kubernetes with four pods per node — sixteen pods downDuring a patching procedure, it was requested the servers come back online afterhours, so we had four servers down (16 pods) and this tested the limits of the pods.
Indexing queues, 12:30PM — 6PM , 10 minute blocks, max fill %, 16 pods down (four servers)

Replication queues, 12:30PM — 6PM, 16 pods down (four servers)

Summary — Legacy to Kubernetes — Splunk Enterprise Security- Legacy or prior to K8s we indexed 200GB/server.
- K8s with four pods/server achieved 500GB/server or 125GB/pod/day.
- K8s with four pods/server during downtime achieved 720GB/server or 180GB/pod/day.
- The data ingestion was increased by 2.5X per server, indexer queues appear to be not filled and there was no noticeable difference in search performance.
- Even with four physical nodes down the impact on ingestion/search performance was minimal.
Hardware summary
- CPU utilization of 40-60 percent with spikes close to 100 percent.
- Disk service times were slower, but no noticeable search performance difference.
- phase0 response times in the
search_telemetrydata decreased by approximately 10-20 percent on the new hardware. Only five searches were sampled as this was quite a time consuming exercise. - Note that SmartStore downloads can push the servers to 100 percent CPU as was seen some months down the track.
- ► Indexer performance — other cluster
-
This cluster was created after the K8s project started, so there is no previous cluster to compare to. This is K8s setup with four pods per node.
- Performance on Kubernetes
- Performance on Kubernetes with four pods per node — heavy usage
- Performance on Kubernetes with eight pods per node
Performance on Kubernetes
Splunk profile
- 220K searches/day
- 125GB/pod/day, 500GB/server/day
- 190GB/pod/day, 760GB/server/day later in the year
- Indexing queues were lightly used, close to zero replication queue issues
- Search pattern — one to seven days lookback for most searches
Hardware summary
- 24 logical processors/90GB RAM per pod
- CPU trend of 15-25 percent
- CPU trend of 15-45 percent later in the year
- I/O trend of 1200-7000 IOPS
- 5.2TB cache per-node
Indexing queues, 9AM — 6PM , five minute blocks, max fill %

Replication queues, 9AM — 6PM

The following graph shows the impact of SmartStore uploads/downloads on the replication queues.SmartStore 8AM — 12PM

SmartStore 8AM — 12PM

Replication queues, 8AM — 12PM

Performance on Kubernetes with four pods per node — heavy usageThis setup was identical but under a heavier workload in terms of the data ingested per pod per day.
Splunk profile
- 220K searches/day
- Ingestion of 255GB/pod/day, 1020GB/server/day
Hardware summary
- 24 logical processors per pod
- 90GB RAM per pod
- 5.2TB cache per-node
Indexing queues, 9AM — 6PM , five minute blocks, max fill %

Replication queues, 9AM — 6PM

Splunk profile- Minimal SmartStore downloads
- Replication queue delays of 1-2 seconds
Hardware summary
- CPU trend of 15-45 percent
- I/O trend of 900-8000 IOPS
Performance on Kubernetes with eight pods per node
This setup utilized the same hardware as the “other” cluster, but instead of attempting to run four pods/node we tested running eight pods/node in an attempt to further utilize the hardware.
Splunk profile
- 220K searches/day
- Ingestion of 112GB/pod/day, 896GB/server/day
- Indexing queue heavily filled
Hardware summary
- 2.8TB cache per node
- 12 logical processors/70GB RAM per pod
- CPU trend of 36-99 percent CPU
- I/O tend of 700-3000 IOPS
Indexing queues, 9AM — 6PM , five minute blocks, max fill %

Replication queues, 9AM — 6PM

I suspect the replication issues were actually worse during the afternoon but the graph did not reflect this.Summary — Kubernetes other
- K8s 500GB/day/server, four pods/server, minimal queuing issues
- K8s 896GB/day/server, eight pods/server, queues were blocked
- K8s 1020GB/day/server, four pods/server, minor queuing issues
- Eight pods/server is clearly too much for this hardware and search combination
There was a mix of the newer and older hardware within this cluster. A manual comparison of six searches showed that the difference in performance at the indexing tier (phase0 response times) was under three percent. I suspect this is due to the searches running over less data compared to the Splunk Enterprise Security cluster.
Conclusions
More is not always better when it comes to the number of K8s indexer pods to run on a bare metal server. Heavier search workloads require more hardware for the pods to run well. Thus, the primary cluster has two pods/server and the other clusters have four pods/server.
In our environment, moving to K8s has allowed more ingestion of data per day and resulted in better utilization of our hardware. In terms of whether this would work in other companies, the main question would be, do you have the appropriate hardware? Alternatively, do you have the ability to obtain hardware that can run multiple pods/server? Finally, are you comfortable learning and implementing K8s?
There are some additional conclusions that I have tested during the creation of the newer indexer clusters that apply to both K8s and non-K8s indexer cluster builds:
- Cluster size matters. More buckets/cluster results in more recovery time from restarts or failures
- Building smaller clusters, even with identical configuration, results in more cluster managers but less issues in our experience. The improvements were found to be:
- Reduced recovery time for the cluster after an indexer restart or failure
- Less chance of indexer by indexer restart if the search/rep factor is not met and searchable rolling restart is in use
- Fewer replication queue issues
- Finally, cluster managers prefer faster CPUs. This applies to K8s and non-K8s since parts of the CM are single threaded.
Next steps
These additional resources might help you understand and implement this guidance:
- Splunk Lantern: Understanding how to use the Splunk Operator for Kubernetes
- Splunk Lantern: Enabling access between Kubernetes indexer clusters and external search heads
- Splunkbase: Alerts for Splunk Admins