Low inventory items detection
This article is designed to show you how to detect low inventory items by analyzing EDI transactions to prevent stock outs and align procurement with demand, which is important for any organization looking to optimize their inventory. By leveraging EDI 846 (Inventory inquiry/advice) and EDI 850 (Purchase order), this article identifies items that are nearing stock out thresholds, triggers replenishment alerts, and automates procurement workflows.
Key features of the procedures in this article include:
- Real-time inventory tracking: Monitor inventory levels using EDI 846 (Inventory updates).
- Dynamic threshold alerts: Flag items below predefined or demand-based thresholds.
- Automated replenishment: Integrate with procurement systems to generate EDI 850 (Purchase orders).
- Demand-driven adjustments: Adjust thresholds based on historical EDI 850 (Purchase order) trends.
Benefits of these procedures include:
- Prevent stockouts: Reduce stockout risk by 40%.
- Optimized inventory: Maintain lean stock levels without overstocking.
- Cost efficiency: Reduce emergency procurement costs and excess inventory.
- Demand alignment: Ensure stock levels match customer demand patterns.
Data required
- Primary data sources:
- EDI 846 (Inventory inquiry/advice) for real-time inventory levels.
- EDI 850 (Purchase order) for demand signals.
- Supporting data sources:
- EDI 856 (Advance ship notice) for inbound/outbound shipment tracking.
- EDI 855 (Purchase order acknowledgment) for supplier confirmation.
Sample EDI events
EDI 850 (Purchase order)
EG*00*NE*PO12345*20231015
LIN*1*VP*SKU1001*25 (Ordered 25 units of SKU1001)
EDI 856 (ASN)
BSN*00*SHIP789*20231016
LIN*1*VP*SKU1001*25 (Shipped 25 units of SKU1001 to Warehouse A)
EDI 846 (Inventory update)
LIN*1*VP*SKU1001*20 (Warehouse A reports 20 units in stock)
DTM*007*20231017
How to use Splunk software for this use case
This section provides a quick overview of the process you'll use to ingest EDI data, process it, and analyze low inventory items in the Splunk platform.
- Set up EDI integration:
- Ingest EDI 846 and EDI 850 data into the Splunk platform.
- Map fields:
edi_item_code,edi_quantity,edi_code.
- Calculate demand and stock levels: Use
evalto separate demand (EDI 850) and inventory (EDI 846) data. - Define dynamic thresholds: Set thresholds based on demand (for example, 120% of expected demand).
- Flag low-stock items: Use
evalto compare current stock with thresholds. - Trigger automated alerts: Configure alerts for items flagged as low stock.
- Visualize results: Build a dashboard with:
- Table: List of low-stock items.
- Gauge: Current stock versus threshold.
- Timechart: Historical stock trends for at-risk items.
Base search
For the base search, we will use a search that looks at all inventory status. Then we will extend the search to identify the potential stock shortages.
index=supply_chain_edi sourcetype="edi:x12" edi_code IN (846 856) source=edi_quantumline_customer
| rex field=_raw max_match=2 "HL.*[\r\n]+(?<edi_asn_item>LIN\|.*[\r\n]+.*)"
| rex field=_raw max_match=2 "N1.*[\r\n]*(?<edi_inv_update>LIN\|.*[\r\n]+.*[\r\n]+.*[\r\n]+.*)"
| rex field=edi_inv_update max_match=2 "(?<edi_inv_update>LIN\|.*[\r\n]+.*)"
| stats list(edi_asn_item) AS edi_asn_item, list(edi_inv_update) AS edi_inv_update, values(edi_code) AS edi_code, latest(_time) AS _time BY edi_tr_id
| table _time, edi_code, edi_tr_id, edi_asn_item, edi_inv_update
| eval zip_item=mvzip(edi_asn_item,edi_inv_update)
| mvexpand zip_item
| table _time, edi_tr_id, zip_item
| eval edi_asn_item=mvindex(split(zip_item,","),0), edi_inv_update=mvindex(split(zip_item,","),1)
| table _time, edi_tr_id, edi_asn_item, edi_inv_update
| rex field=edi_asn_item "LIN\|[^\|]*\|BP\|(?<asn_prod_name>\w+)"
| rex field=edi_asn_item "QTY|SN1\|[^\|]*\|(?<asn_cnt>\w+)"
| rex field=edi_inv_update "LIN\|[^\|]*\|BP\|(?<inv_prod_name>\w+)"
| rex field=edi_inv_update "(QTY|SN1)\|[^\|]*\|(?<inv_cnt>\w+)"
Search explanation
| Splunk search | Explanation |
|---|---|
|
|
Filters EDI X12 data for inventory updates (EDI 846) and shipment records (EDI 856) from the specified data source. |
|
|
Extracts ASN (Advance Shipment Notice) line items from raw EDI data. |
|
|
Extracts inventory update records from raw EDI data. |
|
|
Refines extracted inventory update records by ensuring correct formatting. |
|
|
Groups shipment and inventory update events by transaction ID, preserving the latest timestamp for each transaction. |
|
|
Displays key fields for analysis, including timestamps, transaction IDs, and extracted shipment/inventory data. |
|
|
Merges ASN shipment and inventory update data into a single field for easier processing. |
|
|
Expands the merged field into multiple rows to ensure each shipment-inventory pair is treated separately. |
|
|
Displays the expanded dataset, focusing on transaction timestamps, IDs, and merged shipment-inventory data. |
|
|
Splits the merged data back into separate shipment (ASN) and inventory update fields. |
|
|
Organizes and presents the cleaned dataset with shipment and inventory details. |
|
|
Extracts product names from ASN shipment records. |
| rex field=edi_asn_item "QTY|SN1\|[^\|]*\|(?<asn_cnt>\w+)" |
Extracts the quantity of items in ASN. |
|
|
Extracts product names from inventory update records. |
| rex field=edi_inv_update "(QTY|SN1)\|[^\|]*\|(?<inv_cnt>\w+)" |
Extracts updated inventory count from ASN shipment records. |
Extending the base search
The following searches show a few examples of further inventory analysis that you can perform by using the base search:
- Inventory shortages based on inventory amounts
- Stock-out products and amounts or demand
- Stock-out products in the warehouse
- Stock level status based on stock level category
Inventory shortages based on inventory amounts
This search adds a conditional evaluation for "status" based on inventory levels after replenishment and shipments to customers. In the following example, inventory is classified as "Normal" if it is 200 or more, "Low" if it falls between 0 and 200, and "Short" if it drops below 0. These thresholds can be adjusted as needed based on the type of inventory or the warehouse location.
... Base search omitted (Refer to the base search provided above and add here).

| eval status=case(item_inv_tot<200 AND item_inv_tot>0,"low",item_inv_tot<0, "short", item_inv_tot>200,"normal")
| sort + item_inv_tot

Stock-out products and amounts or demand
By using the search command, we can apply a filter as shown in the example below. The results will display only the SKUs that fall under either the "Short" or "Low" status categories.
... Base search omitted (Refer to the base search provided above and add here).

| search item_inv_tot<200

Stock-out products in the warehouse
This search uses the combo field (which combines the warehouse ID and product) along with the item_inv_tot field (representing the total inventory quantity).
... Base search omitted (Refer to the base search provided above and add here).

| search item_inv_tot<200
| table combo item_inv_tot

Stock level status based on stock level category
This search shows how you can compare stock levels categorized as “Normal" versus "Low". To achieve this, the stats command can be used to calculate the total count of SKUs based on their status.
... Base search omitted (Refer to the base search provided above and add here).

| stats count BY status
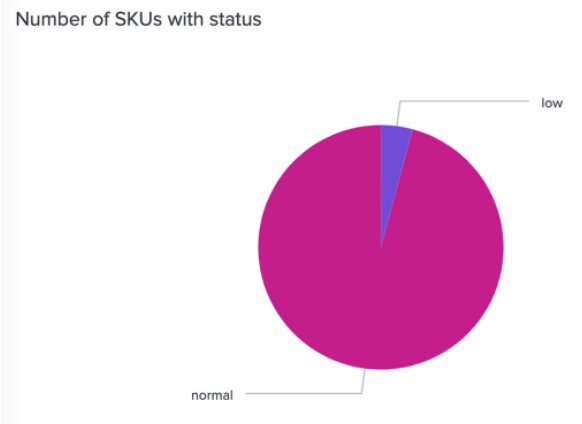
For this type of visualization, circle charts, bar charts, or column charts are all effective ways to represent the data.
Next steps
- Pilot implementation: Test with high-risk items and critical suppliers.
- Refine thresholds: Adjust buffer percentages based on lead times and demand variability.
- Automate procurement: Integrate with ERP systems to auto-generate EDI 850 (Purchase orders).
- Expand scope: Apply to all SKUs and warehouses.