Hiding rows or panels in dashboards with XML
Some Splunk customers might need to hide or show information on a dashboard based on some other input or condition. This could be the role of the current user, what inputs they select on the dashboard, or even the values returned by a search. This article shows you how to hide elements on a dashboard using SimpleXML, by setting and unsetting tokens and specifying the “depends” attribute in the panel or row.
This approach is only for SimpleXML (legacy) dashboards. This does not apply to dashboards created using the new Dashboarding Framework that is now standard with Splunk v9.0+.
For this example scenario, the following table of data is used. The data contains CPU and memory utilization for hosts located in three different groups.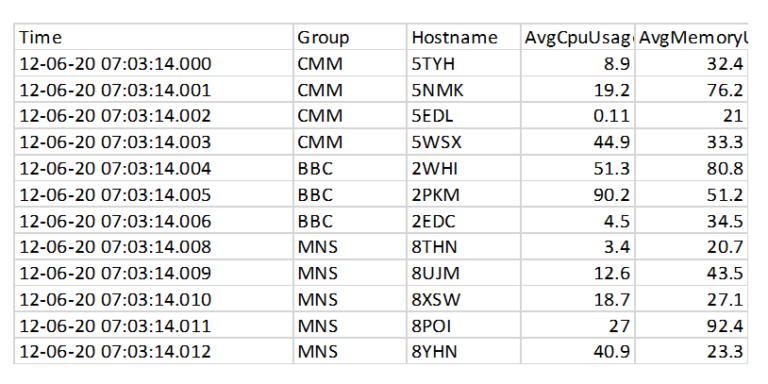
This article explains how to hide or show information on a dashboard using two scenarios.
In the first scenario, users can pick which group they want to see information for by hiding or showing rows. They can pick either a single group, or all groups. Each group’s information should be on a single row, and if all groups are selected, there will be multiple rows.
In the second scenario, users can hide or show panels to choose if they want to see CPU information, memory information, or both within each row.
Scenario 1: Hide or show rows
Create your dashboard with all of the rows and panels that you will need. Use one row per group, with both CPU and memory graphs in each row. An example of this is shown below.
![Hide-Rows-or-Panels-in-Splunk-Dashboards-Blog-image1[2] (2).png](https://lantern.splunk.com/@api/deki/files/2289/Hide-Rows-or-Panels-in-Splunk-Dashboards-Blog-image1%255B2%255D_(2).png?revision=1&size=bestfit&width=1130&height=670)
After you have created the rows and panels needed, create an input with a value for each application group. Use the “Dropdown” input type as this allows you to specify a list of values to choose from, from which only one value is picked. You can list an “All” option, and an option for each individual Group. The example input configuration looks like this:
![Hide-Rows-or-Panels-in-Splunk-Dashboards-Blog- image2[2] (1).png](https://lantern.splunk.com/@api/deki/files/2290/Hide-Rows-or-Panels-in-Splunk-Dashboards-Blog-_image2%255B2%255D_(1).png?revision=1)
![Hide-Rows-or-Panels-in-Splunk-Dashboards-Blog-image3[2] (1).png](https://lantern.splunk.com/@api/deki/files/2291/Hide-Rows-or-Panels-in-Splunk-Dashboards-Blog-image3%255B2%255D_(1).png?revision=1)
The mechanism to hide or show rows or panels relies on a “depends” attribute on the <row> or <panel> tag within the source code of the dashboard. The “depends” attribute lists one or more tokens. If all of the tokens listed are set (i.e. they have a value), then that row or panel is displayed. If any of the tokens are unset (i.e. they do not have a value), then the row or panel is hidden from the user.
To hide individual rows (for the groups), define a token for each group, and use that token in the “depends” attribute for the <row> tag. If the token is set, the row is displayed, and if unset, it is hidden.
To set and unset these tokens when the user picks what group they wish to show, add a “change” section in the XML for the dropdown input. This section defines what happens when a value is selected for the dropdown. Use a <condition> that matches each of the values in the dropdown, and then set or unset the individual “row group” tokens appropriately. Here is the example change section in the dashboard XML:
<change>
<condition label=”All”>
<set token=”CMM_token”>true</set>
<set token=”BBC_token”>true</set>
<set token=”MNS_token”>true</set>
</condition>
<condition label=”CMM”>
<set token=”CMM_token”>true</set>
<unset token=”BBC_token”></unset>
<unset token=”MNS_token”></unset>
</condition>
<condition label=”BBC”>
<set token=”BBC_token”>true</set>
<unset token=”CMM_token”></unset>
<unset token=”MNS_token”></unset>
</condition>
<condition label=”MNS”>
<set token=”MNS_token”>true</set>
<unset token=”CMM_token”></unset>
<unset token=”BBC_token”></unset>
</condition>
</change>
The example snapshot below shows a section of the XML, including how the "depends attribute" is specified for each row or panel that may be hidden. Manually add the “depends” attribute to each <row> tag, being careful to use the corresponding token for each row.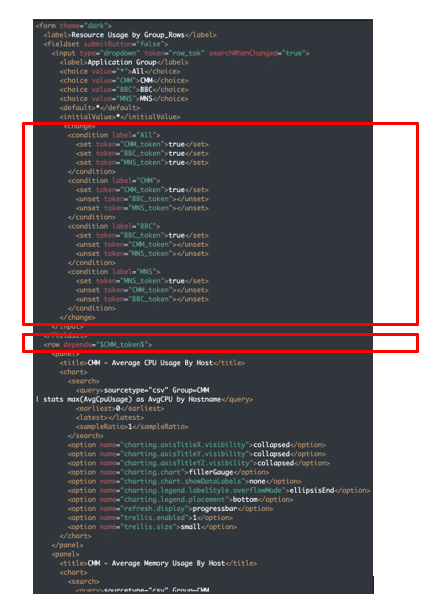
After configuring the hidden rows, you can use the "Group" dropdown to select only a single row to be visible.
Scenario 2: Hide or show panels
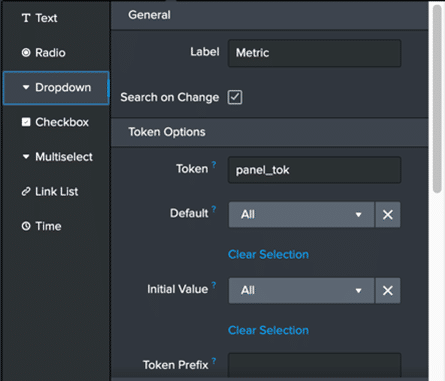
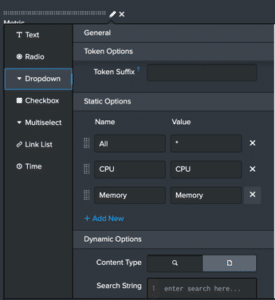
Follow the steps in Hide or show rows to create a dropdown input on the dashboard with three options that control which metrics to show within each row - CPU, memory, or all (both). After you select the dropdown input, your configuration should look similar to this.
As before, create a <change> section within the <input> (dropdown) that will set/unset tokens based on the user’s input. Then, add the “depends” attribute to the <panel> tags in each row to control when to display that individual panel (graph). Below is a snapshot of a section of the XML: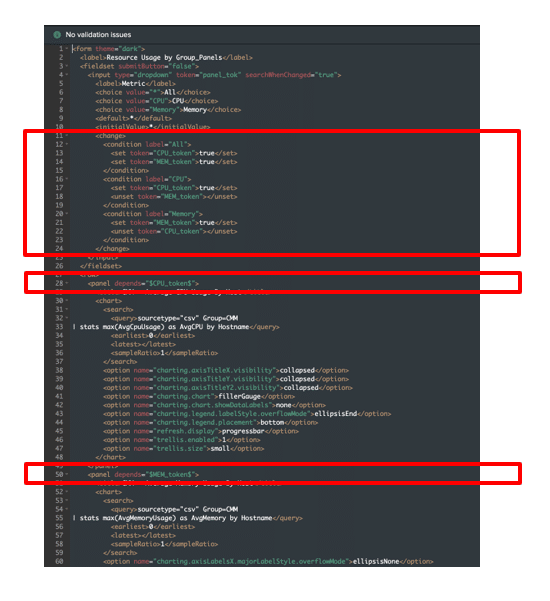
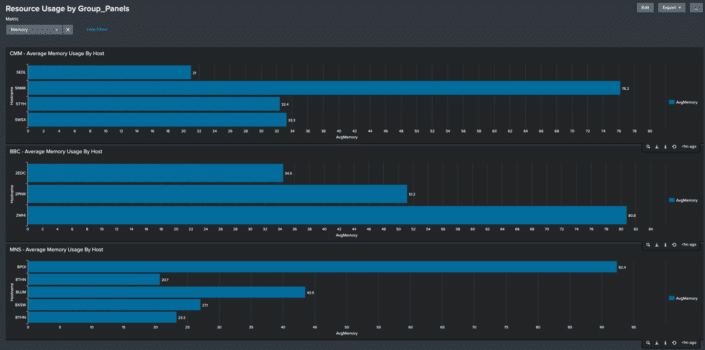
In the screenshot below, only panels with memory metrics are selected.
Next steps
TekStream accelerates clients’ digital transformation by navigating complex technology environments with a combination of technical expertise and staffing solutions. We guide clients’ decisions, quickly implement the right technologies with the right people, and keep them running for sustainable growth. Our battle-tested processes and methodology help companies with legacy systems get to the cloud faster, so they can be agile, reduce costs, and improve operational efficiencies. And with hundreds of deployments under our belt, we can guarantee on-time and on-budget project delivery. That’s why 97% of clients are repeat customers.
The user- and community-generated information, content, data, text, graphics, images, videos, documents and other materials made available on Splunk Lantern is Community Content as provided in the terms and conditions of the Splunk Website Terms of Use, and it should not be implied that Splunk warrants, recommends, endorses or approves of any of the Community Content, nor is Splunk responsible for the availability or accuracy of such. Splunk specifically disclaims any liability and any actions resulting from your use of any information provided on Splunk Lantern.

