Using Ingest Processor to convert JSON logs into metrics
In data-driven environments, converting log data into actionable metrics is essential for effective monitoring and analysis. Splunk Ingest Processor pipeline templates provide a streamlined approach to transforming JSON log data into metrics that can be directly routed to a Splunk metrics index or Splunk Observability Cloud.
How to use Splunk software for this use case
In this article, you'll learn how to load Splunk Ingest Processor pipeline templates to create your own SPL2 pipeline. The example used here is drawn from the Ingest Processor pipeline template “JSON data: Generate metrics from log data”. This, along with many other SPL2 pipeline templates, can be found directly in the Splunk Ingest Processor UI. You can also find more advanced examples that leverage logs collected by the Splunk Add-on for Unix and Linux, firewalls, and many more types of logs. These prebuilt templates can help inspire your own SPL2 pipeline creation process.
To view a list of the available pipeline templates log in to your Splunk Ingest Processor tenant, navigate to the Pipelines page, and then filter by available Templates. For detailed instructions on how to build a pipeline from a template, see Use templates to create pipelines for Ingest Processor.
Loading the template
Using the template “JSON data: Generate metrics from log data”, we'll convert simple JSON objects that contain the environmental variables shown below into metric and dimension key-value pairs.
{
"humidity": 79,
"temperature": 68,
"wind": 12,
"time": 1552401398,
"city": "San Jose"
}
Use SPL2 pipeline syntax to do the following:
- Pull in the JSON events, as defined by
$source. - Convert the JSON objects into fields with the
flattencommand. - Normalize the
_timefield as required by Splunk Observability Cloud with therenamecommand.
The standard $pipeline destination preview shows both the original _raw JSON objects, as well as the extracted fields.

Creating and running the pipeline
- From the Actions panel, select Create metricization rule.

- The "Create metrics from logs" window will pop up. Here you can define metric rule parameters such as name, metric type, source field, and dimensions. The metric preview window allows you to validate results before applying the settings.

- Click Apply. You will see additional lines have been automatically added to the SPL2 pipeline:
- The
logs_to_metricsfunction. - The
thrucommand, which generates the new metric, then sends it to the metrics destination specified in the pipeline settings.
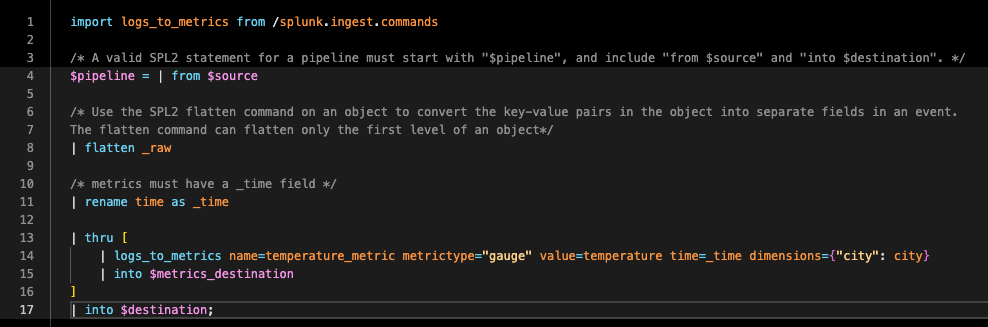
- The
- Run the pipeline again with the
log_to_metricstatements to generate a$metrics_destinationpreview that shows the converted metric data. This lets us validate that the new fields are ready to send directly to a Splunk metrics index, or Splunk Observability Cloud, as defined by$metrics_destination.
Next steps
These resources might help you understand and implement this guidance: