Configuring Log Observer Connect
You can use OpenTelemetry to get Docker, Kubernetes, and other log data in Splunk Cloud Platform. As a next step, you might also want to bring correlated metric, log, and trace data into Splunk Observability Cloud so you can troubleshoot application issues. This article describes how to configure Splunk Log Observer Connect to bring those logs into Splunk Observability Cloud.
Splunk Log Observer Connect is an integration that allows you to query your Splunk Cloud Platform logs directly from Splunk Observability Cloud. It allows you to troubleshoot your application and infrastructure behavior using high-context logs, without having to know Search Processing Language (SPL). Seeing your log data correlated with metrics and traces in Splunk Observability Cloud helps your team to locate and resolve problems faster. In this article, we’ll walk through the process of Setting up Splunk Log Observer Connect.
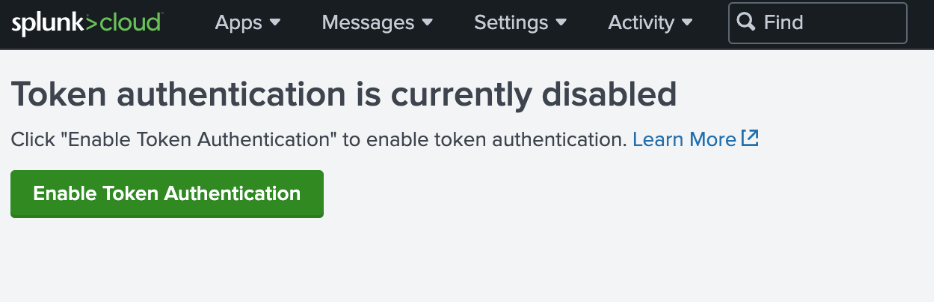
Enable token authentication
The first step is to enable token authentication in Splunk Cloud Platform by going to Settings > Tokens. Then click the Enable Token Authentication button to enable it.
Add the Splunk Log Observer Connect connection
- In Splunk Observability Cloud, go to Settings > Log Observer Connect.
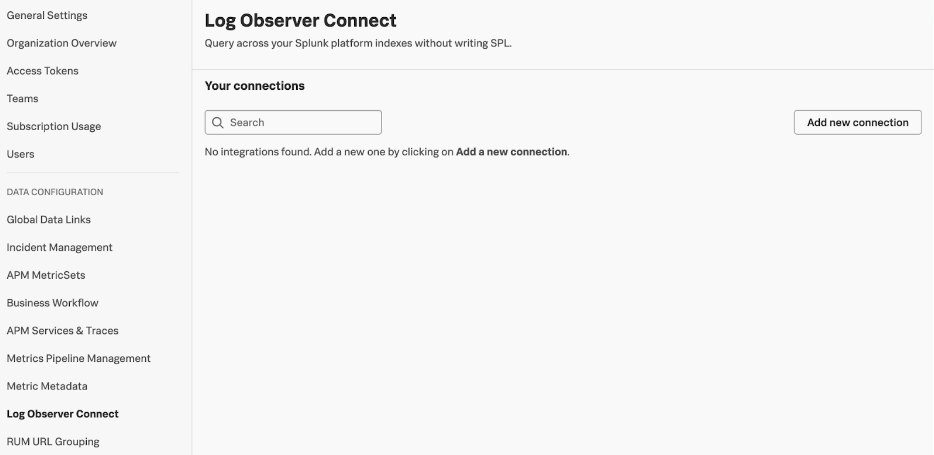
- Click Add new connection to bring up the following screen.
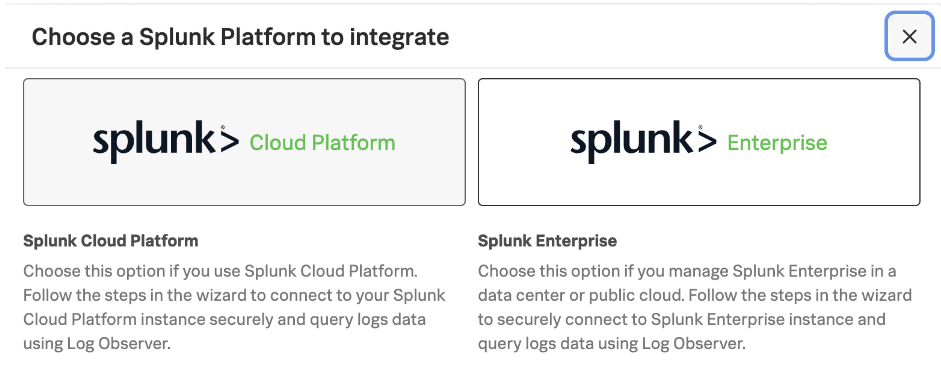
- While we’ll choose Splunk Cloud Platform for our example, the steps with the Splunk Enterprise option are almost identical.
Create a new role in Splunk Cloud Platform
Next, let’s follow the steps in the guided wizard to connect the service account in Splunk Cloud Platform.
- Log in to your Splunk platform instance and navigate to Settings > Roles.
- In the Actions column, next to user, click the Edit menu and select Clone.
- Give your new role a name.
- On the Indexes tab, deselect *(All internal indexes) in the Included column.
- In the Included column, select the indexes that you want to query in Log Observer.
- On the Capabilities tab, ensure edit_tokens_own is selected.
- On the Capabilities tab, ensure indexes_list_all is not selected.
- On the Resources tab in the User search job limit field, set an appropriate search limit based on the number of users that will access Log Observer simultaneously. Splunk Log Observer runs a minimum of 4 searches per user. For detailed instructions, see Set up Log Observer Connect for Splunk Enterprise.
- Click Save.
Let’s assume our new role is named log_observer_connect.
Create a new user in Splunk Cloud Platform
Next, we’ll continue following the guided wizard to configure users in Splunk Cloud Platform.
- Navigate to Settings > Users and click New User.
- Give your user a name and password. Save these credentials because you will need them to complete the integration wizard.
- In the Assign roles field, remove user from the Selected Item(s) box.
- In the Available Item(s) box, select the role you created here.
- Deselect the >Require password change on first login option.
- Click Save.
- In Splunk Cloud Platform, log in with the newly created user and accept the terms of service.
Let’s assume our new user is named log_observer_connect_user.
Secure the connection to Splunk Cloud Platform
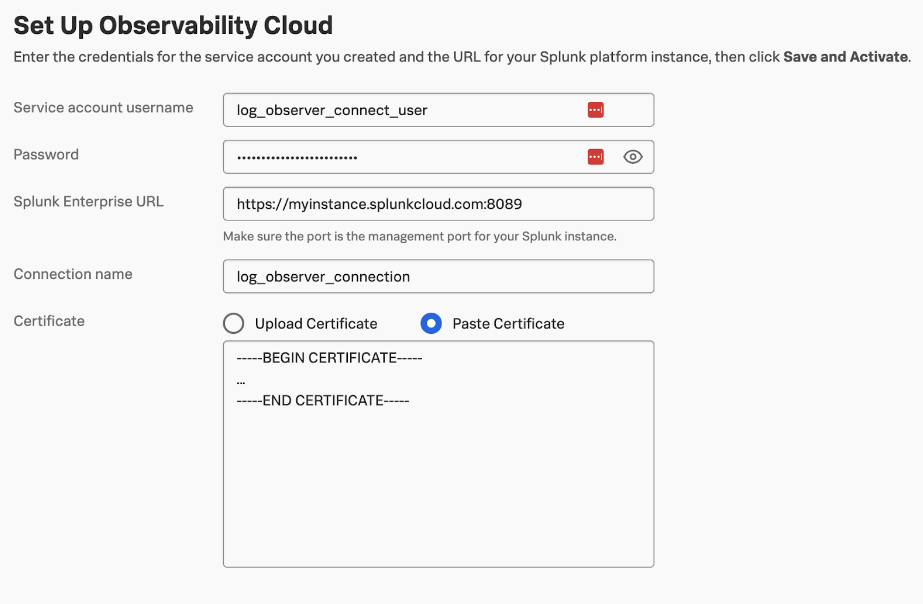
Next, we’ll use the guided wizard to secure the connection to Splunk Cloud Platform. This requires running a script on the command line, which will output a certificate we need for our setup.
After we have the certificate from the script output, we paste it into the next page of the guided wizard to securely connect Splunk Log Observer Connect and our Splunk Cloud Platform instance.
Ensure you include “BEGIN CERTIFICATE” and “END CERTIFICATE” when pasting the certificate value. Only the first certificate from the script’s output is required.
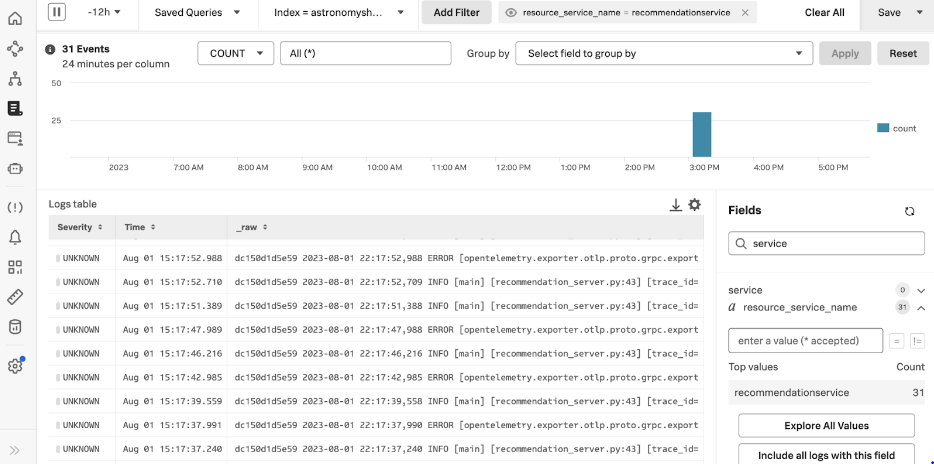
Verify log data in Splunk Observability Cloud
After the setup is complete, navigate to Splunk Log Observer in Splunk Observability Cloud, and verify that you can see the logs successfully.
Next steps
After you have metrics, logs, and traces in Splunk Observability Cloud, you'll want to know how to use that information troubleshoot application issues.
In addition, the following resources might help you set up Splunk Log Observer Connect:
- Splunk Docs: Introduction to Splunk Log Observer Connect
- Splunk Docs: Set up Log Observer Connect for Splunk Cloud Platform
Splunk OnDemand Services: Use these credit-based services for direct access to Splunk technical consultants with a variety of technical services from a pre-defined catalog. Most customers have OnDemand Services per their Success Plan. Engage the ODS team at ondemand@cisco.com if you would like assistance.