Checking for KPI search success
This task assesses the success rate of KPI searches to identify whether any KPI searches are failing. If failures are identified, further information is collected to identify the specific problematic searches for remediation.
This article is part of the Splunk ITSI Owner's Manual, which describes the recommended ongoing maintenance tasks that the owner of an ITSI implementation should ensure are performed to keep their implementation functional. To see more maintenance tasks, click here to see the complete manual.
Why is this important?
Key Performance Indicators (KPIs) are used to monitor and measure the performance of various components within an IT environment. KPI searches are used to populate the current state of the KPIs used to monitor services in Splunk ITSI (ITSI).
When KPI searches are skipped, the underlying KPI that is populated by that search then has a gap in its dataset, meaning that the KPI is now inaccurate. Without accurate KPI metrics, the overall service health insights provided by ITSI are then inaccurate, causing ITSI to present an incorrect view of the current service state of the organization.
KPI searches are the foundational point of instrumentation within ITSI. It is critical that they function correctly to ensure the accuracy of the data provided by ITSI.
Schedule
Every month
Prerequisites
- Appropriate search access to the underlying Splunk environment is required to perform this activity.
- This procedure requires the ITSI REST API to be enabled and accessible from Splunk search.
Notes and warnings
- This task may involve collaboration with the Splunk platform administrator if issues with the KPI searches are identified. Early collaboration with that function when performing this procedure is ideal.
- This activity specifically targets searches relating to ITSI KPI search execution. Broader search issues can exist within a Splunk platform that are not identified by this task.
How to use Splunk software for this use case
If you prefer to follow along with this procedure in video format, click here to jump to the bottom of this page.
Step 1: Identify the percentage of KPI searches being skipped
- In the top left corner of the screen, click the Splunk logo.
- On the left-hand side of the screen, select IT Service Intelligence.
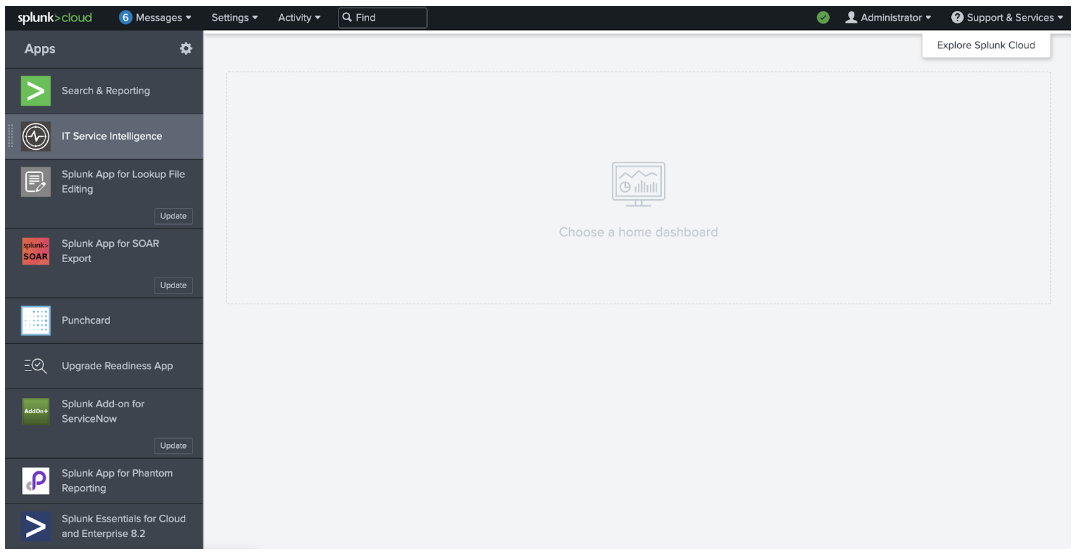
- In the menu at the top of the page, click Search.
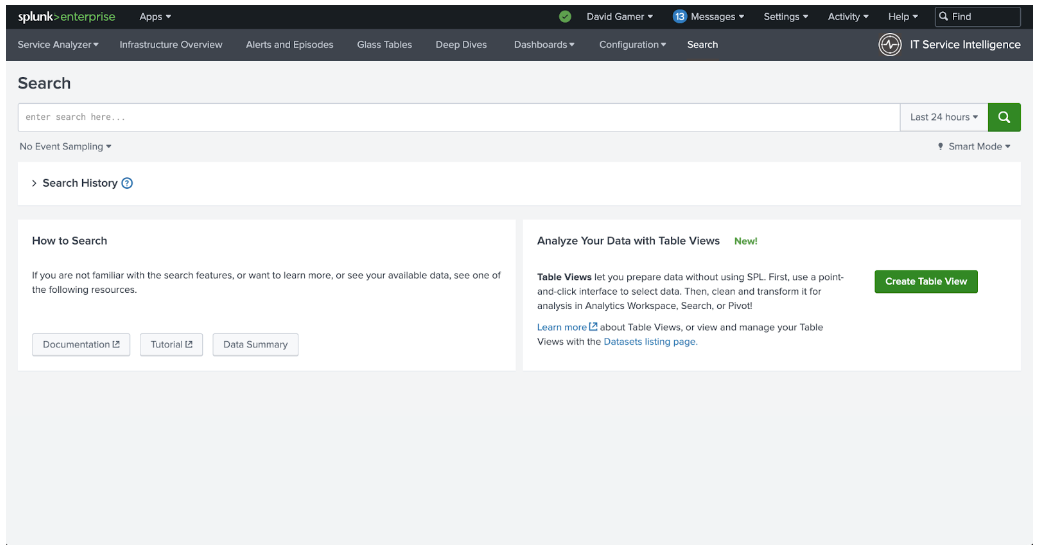
- Copy the following search into the search bar and press Enter to run the search:
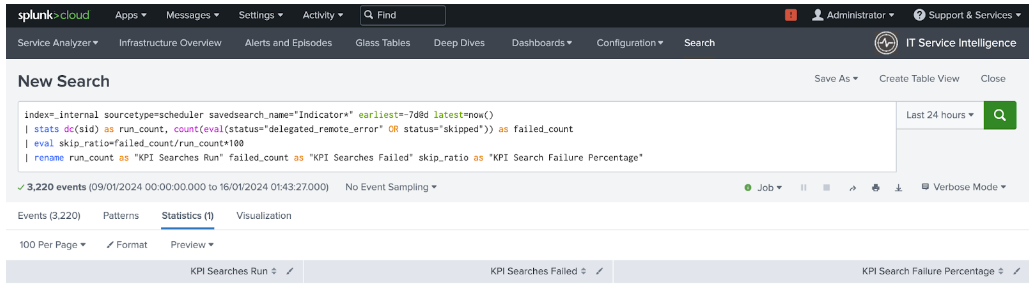
index=_internal sourcetype=scheduler savedsearch_name="Indicator*" earliest=-7d@d latest=now()
| stats dc(sid) AS run_count, count(eval(status="delegated_remote_error" OR status="skipped")) AS failed_count
| eval skip_ratio=failed_count/run_count*100
| rename run_count AS "KPI Searches Run" failed_count AS "KPI Searches Failed" skip_ratio AS "KPI Search Failure Percentage"
- Review the search results in the panel below the search bar. Look at the value in the KPI Search Failure Percentage column.
- If this value is greater than 0, there is a problem with searches running in ITSI that needs to be investigated further. Move on to Step 2 below.
- If that value is 0, this task is complete.
Step 2: Investigate KPI search skip rate further
Further investigation is required if the failure percentage identified in the previous step is greater than 0.
- Copy the following search into the search bar and press the enter key on your keyboard to run the search:
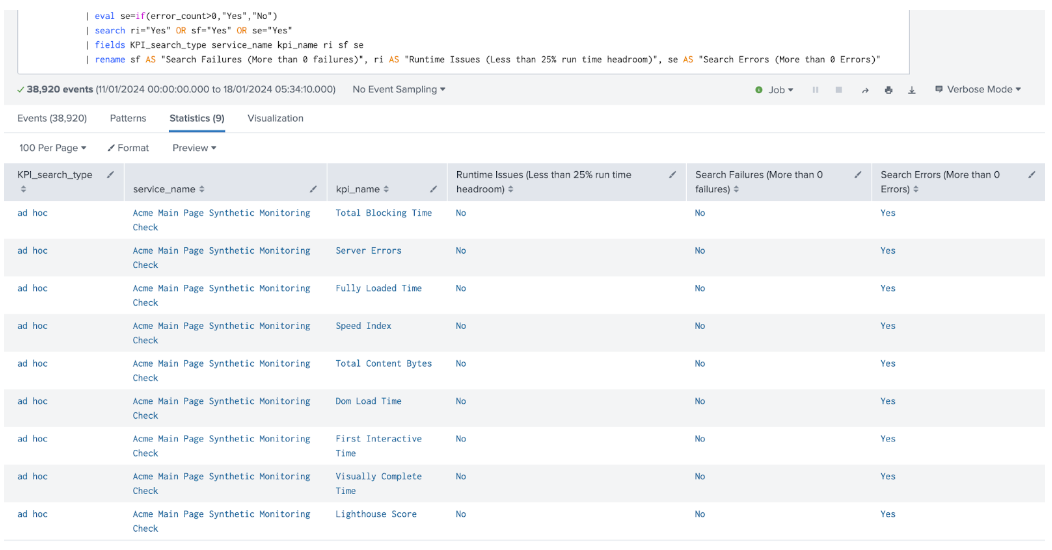
index=_internal sourcetype=scheduler savedsearch_name="Indicator*" earliest=-7d@d latest=now() | stats dc(sid) AS run_count, count(eval(status="delegated_remote_error" OR status="skipped")) AS failed_count, max(run_time) AS max_runtime, earliest(_time) AS first, latest(_time) AS last BY savedsearch_name | eval KPI_search_type=if(savedsearch_name like "%Shared%", "base", "ad hoc") | eval runtime_headroom_pct=round((100-(max_runtime/((last-first)/(run_count-1))*100)),1) | join type=outer savedsearch_name [search index=_internal sourcetype=scheduler savedsearch_name="Indicator*" | join sid [ search index=_internal sourcetype=splunk_search_messages app="itsi" log_level=ERROR] | stats count(savedsearch_name) AS "error_count" by savedsearch_name] | rex field=savedsearch_name ".* (?<base_id>.*?) - ITSI Search$" | lookup itsi_kpi_attributes kpiid AS base_id OUTPUTNEW kpi_name service_name | lookup kpi_base_search_title_lookup _key AS base_id OUTPUTNEW title AS kpi_name | eval ri=if(runtime_headroom_pct<25,"Yes","No") | eval sf=if(failed_count>0,"Yes","No") | eval se=if(error_count>0,"Yes","No") | search ri="Yes" OR sf="Yes" OR se="Yes" | fields KPI_search_type service_name kpi_name ri sf se | rename sf AS "Search Failures (More than 0 failures)", ri AS "Runtime Issues (Less than 25% run time headroom)", se AS "Search Errors (More than 0 Errors)" - Review the results from the search. Each row identifies a KPI search that has a problem. The search shows the type of KPI (base search or ad hoc search), the associated service for ad hoc searches and the KPI name to allow for easy identification of the KPI in the ITSI interface. The last three columns in the search results indicate the detected problem for each KPI search. The three problems detected by this search are:
- KPI searches with failures in execution (Search Failures column)
- KPI Searches that are taking too long to run based on their schedule (Runtime Issues column)
- KPI Searches that have search errors flagged by the Splunk platform (Search Errors column)
- Investigate every KPI search identified in these search results in depth to identify the root cause of the issue and be remediated. If you need assistance with this task, please contact your Splunk account team to engage professional services support.
Video walk-through
In the following video, you can watch a walk-through of the procedure described above.
Additional resources
These resources might help you understand and implement this guidance:
- Splunk Lantern Article: Choosing KPI base searches over ad hoc searches