Using Azure DevOps integrations for events and alerting
You are working with microservices in a large distributed environment. While many of the processes you run are optimized and efficient, you're finding that you're working many incidents that require hours of sleuthing, only to end with a single team needing to roll back a deployment.
You're aware that event-based CI/CD data can mean the difference between MTTD/MTTR that takes a few minutes versus a few hours, but you're not sure where to get started to leverage events and alerting to their utmost potential.
How to use the Splunk Observability Events integration for this use case
You can use Azure DevOps integrations for sending events to Splunk Observability and Alert based Release Gating, allowing you to start integrating CI/CD context into your monitoring practices. Deployment-based events and alerts can help you answer questions such as:
- Do I know when my software is being deployed?
- How many clicks do I have to invest to know when a deployment happened?
- Do I know when upstream services my software depends on are being deployed?
- How do I know when those service’s deployments are impacting my software?
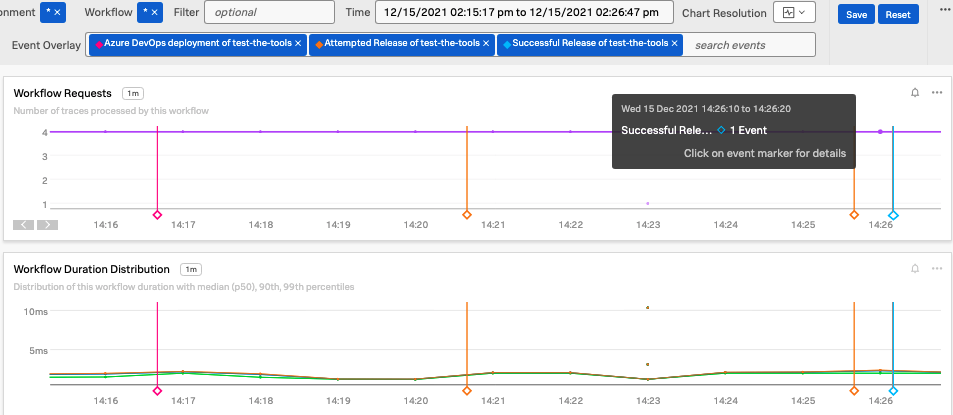
Events in Splunk Observability Cloud are highly visible, easily overlaid on dashboards with event markers / lines, and are essentially “free real estate” with no specific associated charges. You can get much more context included on your dashboard with Event Markers for deployment start, deployment success, deployment failure, etc. The information included doesn't just cover your own services, but also the upstream services you depend on.
How your tech organization can benefit from CI/CD Events
Successful monitoring (and by association incident management) is all about context and communication. By helping teams to quickly establish if a deployment has impacted their service’s performance, or another service’s performance, your software teams can decrease mean time to detect (MTTD) and mean time to recovery (MTTR).
- IT Operations / Support Analysts: As a member (or head) of the IT Operations team, you want up to date build information on important services, to quickly notify software teams if recent deployments are causing or related to a service interruption.
- DevOps / SRE: As a member (or head) of a DevOps or SRE team, you need to ensure services are healthy, and if not, quickly track down the cause. The ability to provide stakeholders with visibility into issues caused by deployment of applications and infrastructure will help them improve their software development and deployment practices.
- Software Developers: As a member (or head) of a Software Development team, you want to know if a recent deployment of your own software or upstream services is causing an issue, before customers are impacted and without jumping between different tools and UIs.
The ultimate goal is to ensure less jumping between multiple tools, gaining increased context in a single UI.
How to use the Splunk Observability Alert Gate integration for this use case
There is great value in creating alerts and/or events related to software deployments. Knowing when your service or upstream services have been deployed is a vital signal for Development, SRE, CI/CD, and DevOps teams. But the next logical step is to be proactive and start gating your releases based on Splunk Observability Cloud alerts.
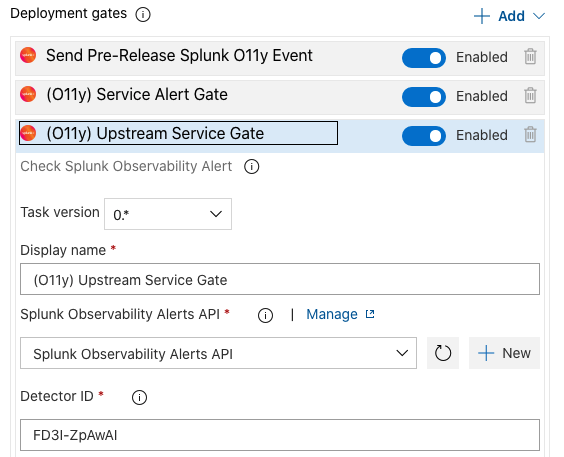
The example alert below has three steps. First it sends an event to Splunk Observability Cloud on pipeline start so that deployment is marked in observability, then it checks the service’s alert to make sure it isn’t firing, and finally checks the upstream service’s alert to make sure it isn’t firing either, before finally moving through the rest of the release process.
Gating releases based on alerting for your own services is a natural place for teams to start. But, this may be counterproductive during incidents involving your service. The last thing you need during a stressful incident is something preventing you from deploying a fix. In these cases, gates in Azure DevOps pipelines can be easily ignored with a single click in the interface.
More useful in most cases is gating your deployment or release based on the health of upstream services that influence the health of your own software. Here is a list of examples that may make your release gating practices more effective:
- If your company’s edge router is having issues, you’re going to have a hard time determining that a given deployment is healthy or not. Consider holding off on deploying until those issues and associated alerts have settled down and consumer responses are flowing again.
- If you depend on another team’s service for correct and timely responses you may consider a release gate based on the health of their service. The last thing you want to do is to compound an incident already in progress by deploying more changes into the environment.
- Dependencies in the cloud, fully managed or otherwise, such as DynamoDB or BigQuery can also face outages. Gating on these sorts of things will prevent deploying changes when circumstances outside of your control make establishing the health of a deployment more difficult.
- Alerts based on Splunk Application Performance Monitoring, Splunk Synthetic Monitoring, or Splunk Real User Monitoring metrics will give you a release gate focused more closely on a specific web property or user experience. For more advanced organizations this can function as a final check directly related to how customers interact with your software.
Release Gates are a prime tool for protecting the integrity of your overall software environment. The ability to prevent further changes during ongoing incidents will help protect the availability KPIs of your service. Proactively preventing errant deployments during times of trouble will also likely make you some friends with your co-workers in incident management!
Summary
Events and alerts in Splunk Observability Cloud have no specific cost associated with their ingest, storage, or usage. This sort of “free real estate” goes untapped by most organizations but can provide enormous value to software teams, incident management, and CI/CD processes.
Events marking deployments, releases, and even infrastructure changes can provide much needed context to your monitoring.
Alerts, commonly used to indicate service health and notify on-call resources, can spread some of that contextual awareness of your software environment to your deployment pipelines.
But alerts and events don't need to be constrained to internal factors. Alerting and event reporting based on other Splunk Observability products can help provide even more untapped context to your organization.
- Synthetic Testing: “Is the AWS Status page showing US-West-2 is down? When did that start?”
- Real User Monitoring (RUM): “It looks like mobile users are seeing a slow and steady increase of latency in the EU that starts around the time we changed our CDN configuration last Tuesday…”
- APM: “Users started having intermittent issues finishing checkout after last month’s AMI changes.”
By looking outside in addition to inside your environment you can get a more detailed understanding of the impacts of change to SaaS service, vendor’s configurations, or external processes, and how they may impact your software.
Next steps
The content in this article comes from a previously published blog, one of the thousands of Splunk resources available to help users succeed. In addition, these resources might help you understand and implement this guidance: