Troubleshooting application issues
Now that we have metrics, logs, and traces in Splunk Observability Cloud, let’s explore how we can troubleshoot application issues. To do this, this article will demonstrate three processes:
- Enabling feature flags to generate errors
- Investigating application errors using traces and logs
- Using Related Content to jump between logs, traces, and infrastructure data
This article assumes you have configured Splunk Log Observer Connect to send logs from Splunk Cloud Platform to Splunk Observability Cloud. If you don't have that integration set up, follow the steps in this article first.
How to use Splunk software for this use case
Enable feature flags to generate errors
- First, we’ll run the following command to make the feature flag service endpoint available on our local machine.
kubectl port-forward svc/frontend-proxy 8080:8080 -n otel-demo
- Then we can connect to the feature flag service by navigating to the following URL with our browser: http://localhost:8080/feature/

- Next, let’s enable both the
productCatalogFailureandadServiceFailurefeature flags.

The final result should look like this, with Enabled set to true on the feature flags of interest.

Investigate application errors using traces and logs
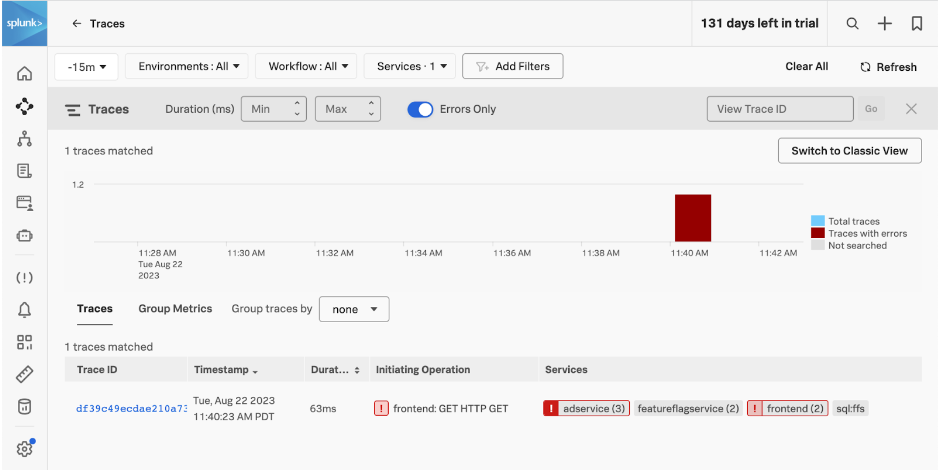
We know that the ad service is experiencing errors in our demo application since we enabled that feature flag. To investigate what might be causing these errors, let’s start by using Trace Analyzer to find traces involving ad service that have errors.
Let’s click the Trace ID to drill into the trace and take a closer look. The waterfall view of the trace shows us which components are taking the most time. We can see that an error occurs when the frontend service calls adservice, and we can click on the span for further details. And at the bottom of the trace, there’s a button that we can use to find log events that are related to this particular trace.
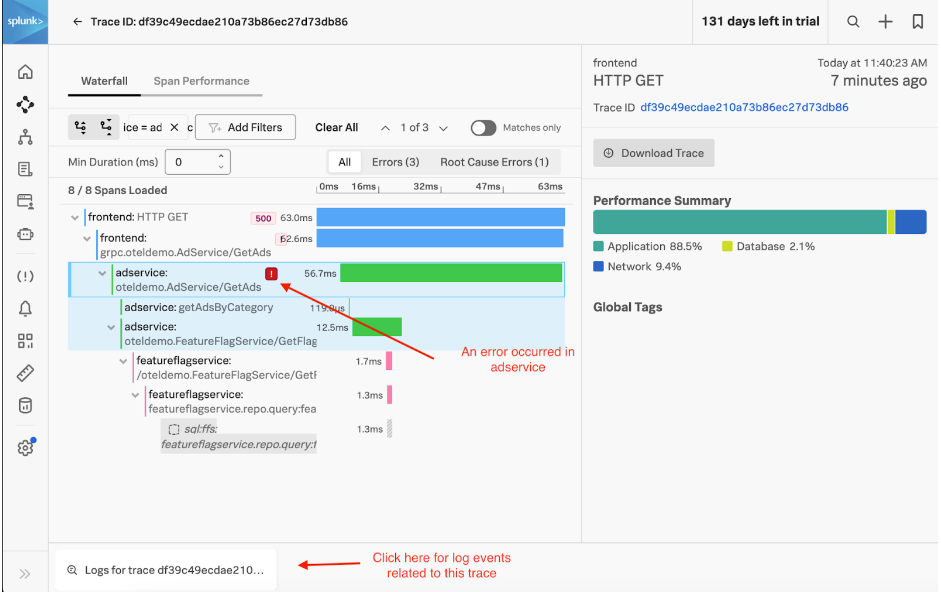
Click the button to go to Log Observer, which is pre-filtered on the trace_id of interest.
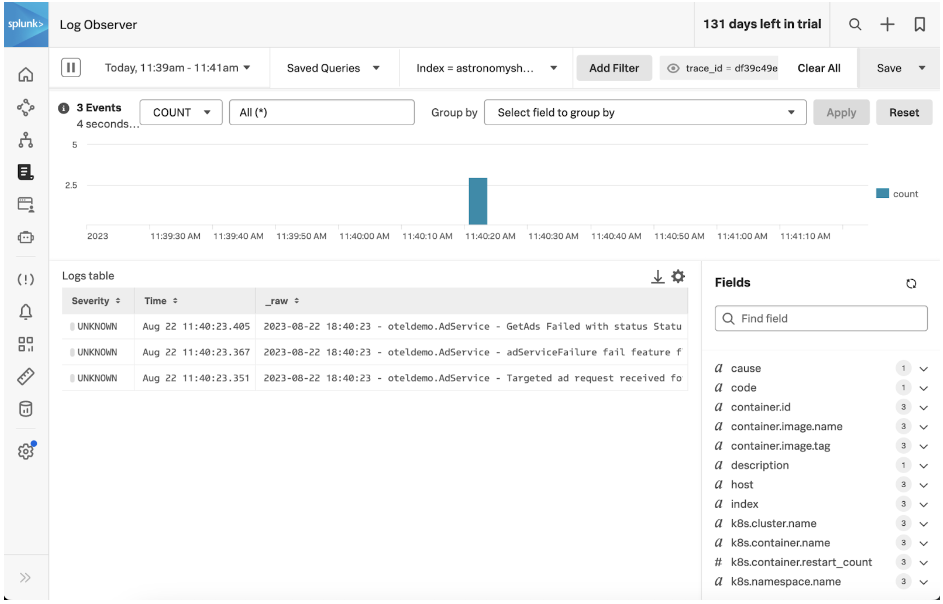
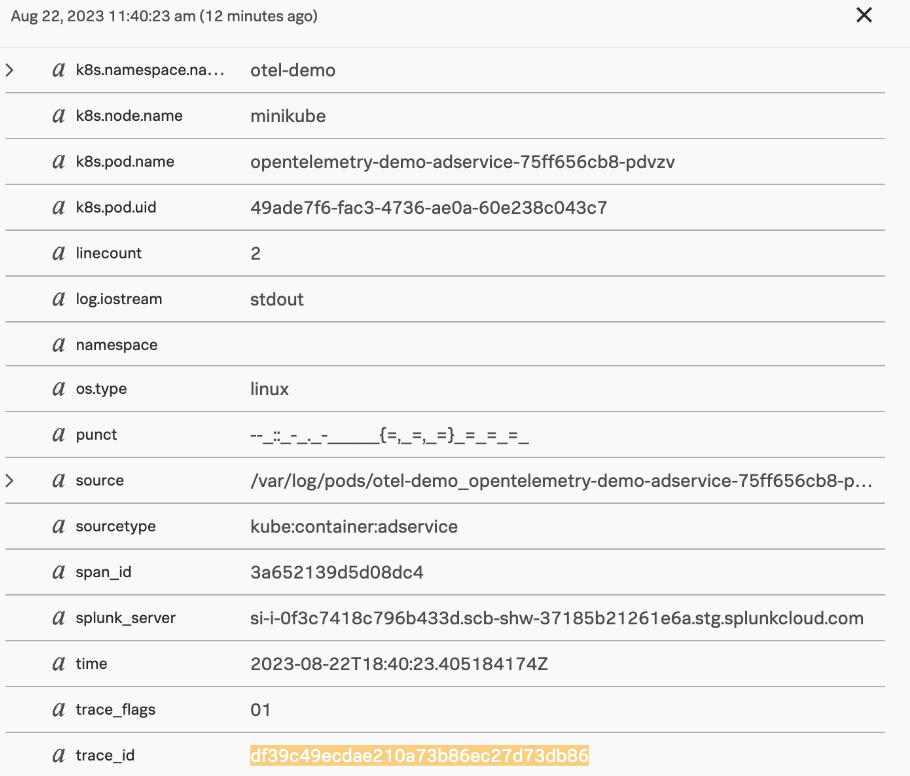
We can select a log event to drill into it for further details. The log event details show that GetAds failed with a status code of “RESOURCE_EXHAUSTED”.
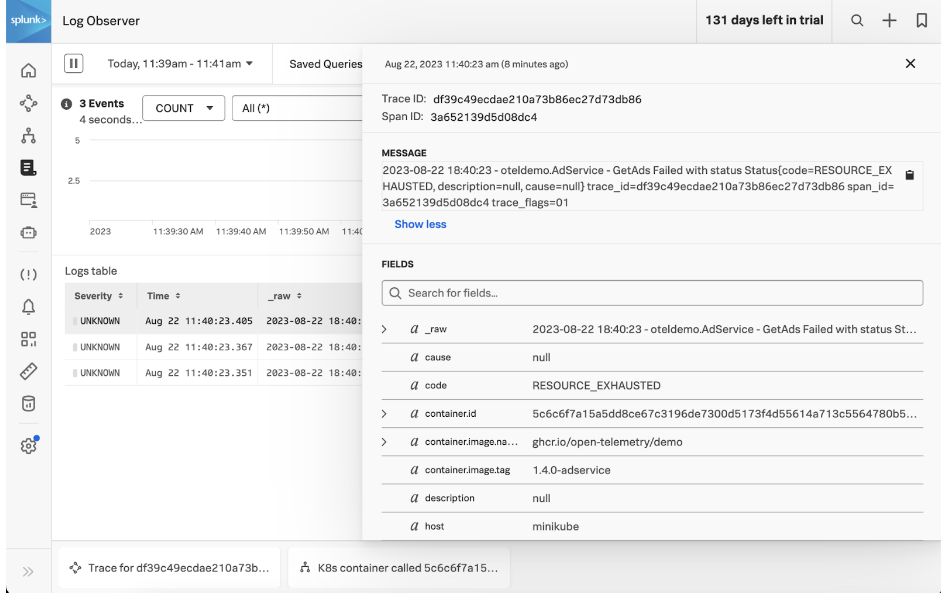
Scrolling down further on the list of fields, we can see that the trace_id, span_id, and trace_flags attributes were included with this log event. The presence of these attributes allows Splunk Observability Cloud to correlate traces with logs.
Use Related Content to jump between logs, traces, and infrastructure data
While the first troubleshooting scenario started by looking at traces, we could also start troubleshooting by looking at logs. For example, let’s use Splunk Log Observer to search for all log events associated with the recommendation service.
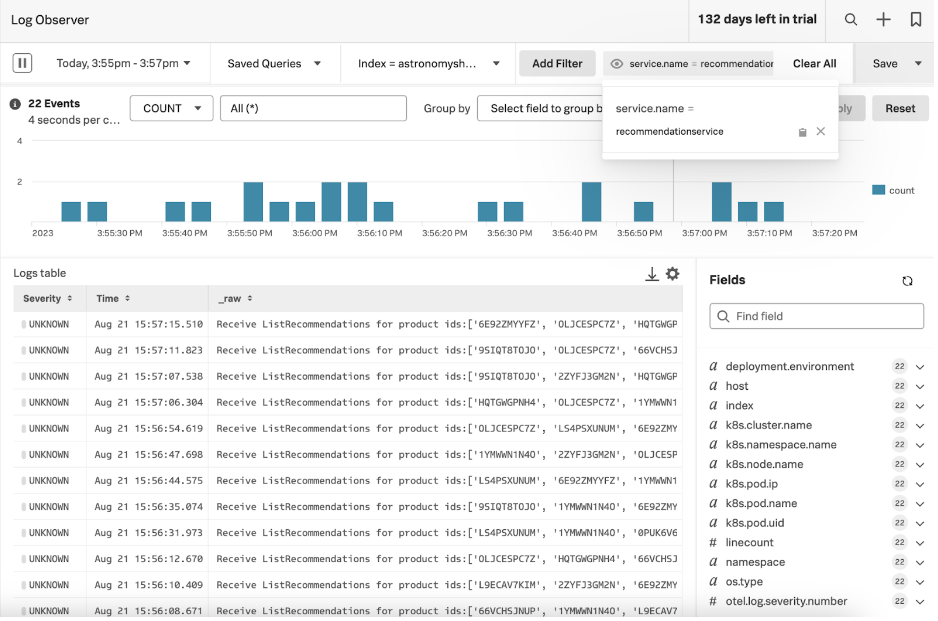
Click one of the log entries to see further details.
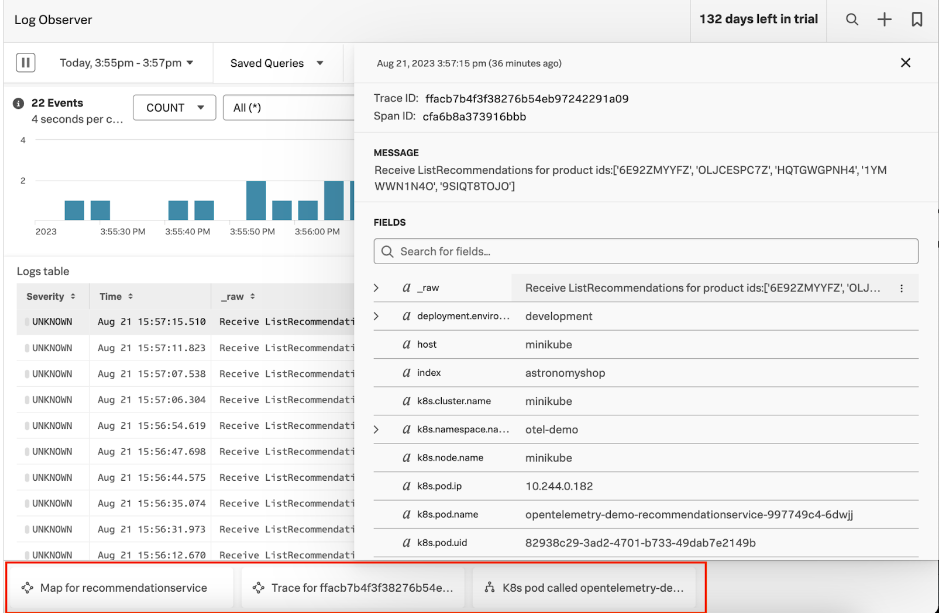
At the bottom of the screen, we can see three buttons that take us to Related Content. Specifically, the buttons link to:
- The service map for the recommendation service.
- The trace associated with this particular log entry.
- The Kubernetes pod this instance of recommendation service runs on.
Click the first button to go to the service map for the recommendation service, which has its own set of related content at the bottom of the screen.
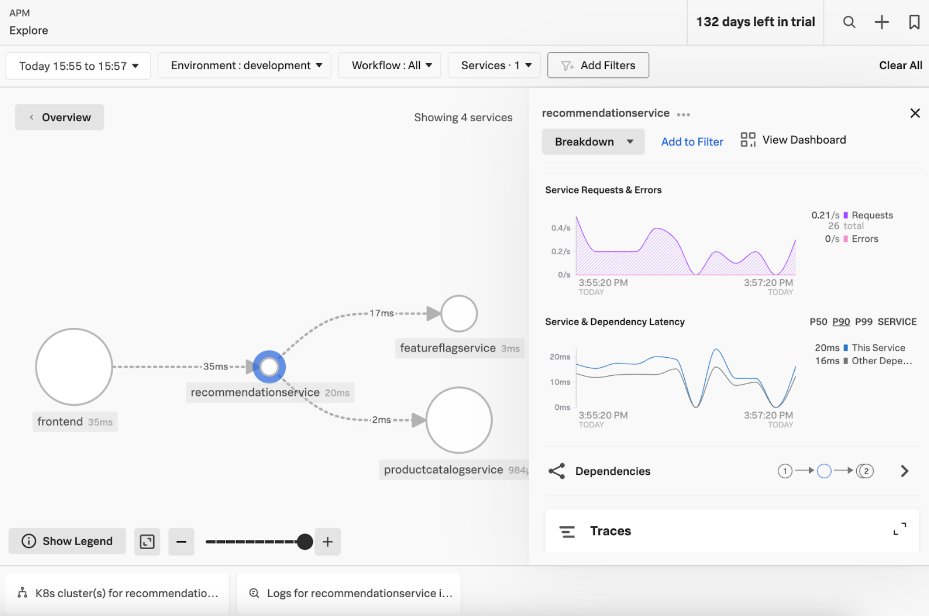
With metric, log, and trace data flowing to Splunk Observability Cloud, we can leverage the Related Content bar to seamlessly navigate from one view to another. Maintaining context as we jump from one signal to another allows us to troubleshoot issues more quickly.
Cleanup
If you want, you can clean up the application deployment by running the following commands:
kubectl delete --namespace otel-demo -f ./splunk/opentelemetry-demo.yaml
helm uninstall <helm release name>
Summary
In this article, we demonstrated how correlated log, trace, and metric data in Splunk Observability Cloud can be used to rapidly troubleshoot application issues. Looking for more useful advice on using Splunk Observability Cloud? Browse the Observability Use Case library.