Monitoring for KPI search lag
This task identifies any data source a Splunk ITSI (ITSI) search uses that has ingestion latency outside of the configured monitoring lag. The task also then adjusts the monitoring lag for each search to an appropriate level.
This article is part of the Splunk ITSI Owner's Manual, which describes the recommended ongoing maintenance tasks that the owner of an ITSI implementation should ensure are performed to keep their implementation functional. To see more maintenance tasks, click here to see the complete manual.
Why is this important?
Ingestion latency refers to the time delay between the occurrence of an event in your IT environment and its visibility in the Splunk platform. When a search interacts with a data source with ingestion latency, it receives inaccurate results, as events relevant to the prescribed time window are not retrieved due to the ingestion latency.
ITSI has built-in settings to cater for ingestion latency, where KPI searches will add a buffer to their time window to make sure they receive all the relevant events for the time window. This setting is fixed when the KPI is created and is not adjusted over time. It is essential that this Monitoring Lag setting is continuously reviewed to ensure that it is appropriate for the data sources being searched by a KPI search.
Failure to maintain these Monitoring Lag settings can cause KPI searches to retrieve an incomplete set of data, resulting in inaccurate KPI metrics, ITSI services and compromising the accuracy of ITSI as a whole.
Schedule
Every month
Prerequisites
- Appropriate search access to the underlying Splunk environment is required to perform this activity.
- This procedure requires the ITSI and Splunk Core REST APIs to be enabled and accessible from Splunk search.
- This procedure requires admin access to ITSI.
Notes and warnings
Extremely long monitoring lag settings can cause KPI searches to display a delayed view of the underlying data. Where an extremely long recommended monitoring lag is identified, it is best practice to first attempt to resolve the underlying cause of ingest latency before resorting to the monitoring lag settings.
How to use Splunk software for this use case
If you prefer to follow along with this procedure in video format, click here to jump to the bottom of this page.
Step 1: Check for ingest latency issues
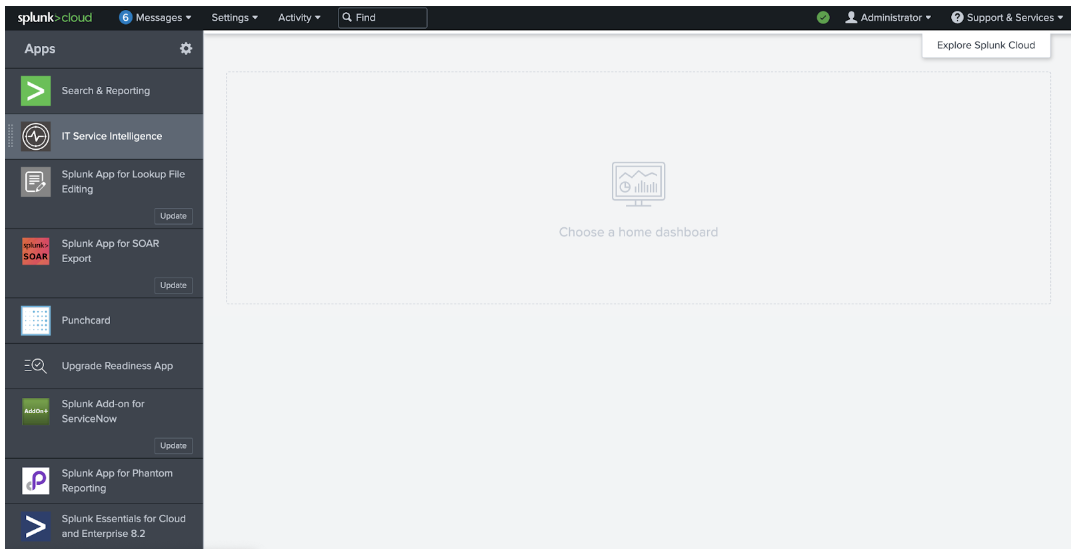
- In the top left corner of the screen, click the Splunk logo.
- In the menu on the left-hand side of the screen, select IT Service Intelligence.
- In the menu at the top of the page, click Search.
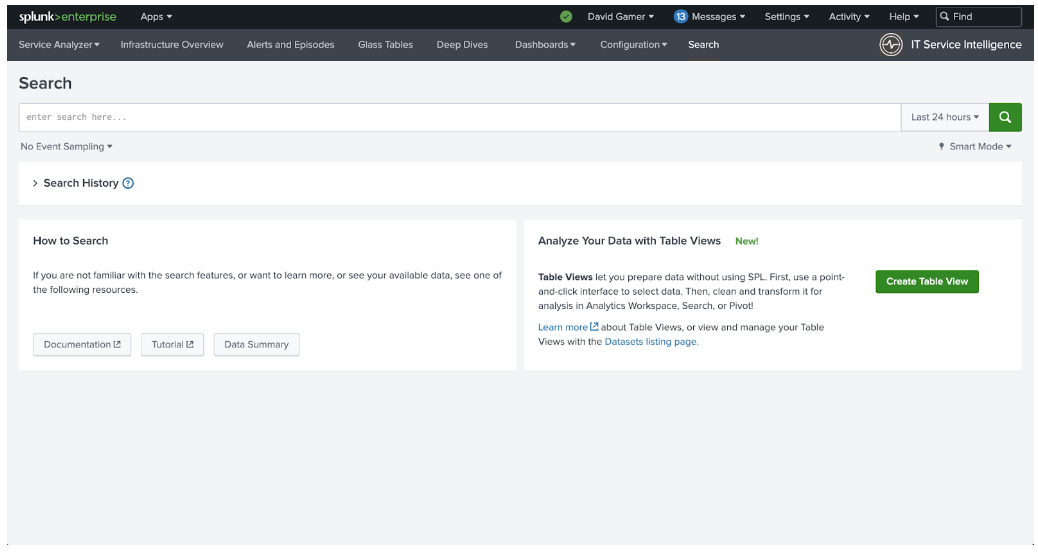
- Copy the following search into the search bar and press Enter to run the search.
| rest /servicesNS/-/-/saved/searches splunk_server=local
| join title [| rest /servicesNS/-/-/search/jobs splunk_server=local
| dedup label
| rename label AS title
| fields title optimizedSearch]
| search disabled=0 description="Auto created scheduled search during kpi creation" OR description="Auto generated shared base search"
| rex field=dispatch.earliest_time "(?<earliest>.*)"
| rex field=dispatch.latest_time "(?<latest>.*)"
| eval run_time_setpoint=if(next_scheduled_time!="",round(strptime(next_scheduled_time,"%Y-%m-%d %H:%M:%S %Z"),0),now())
| eval offset_seconds=round((run_time_setpoint-(relative_time(run_time_setpoint,latest))))
| eval offset_seconds=if(offset_seconds>0,offset_seconds,0)
| eval search=if(optimizedSearch!="",optimizedSearch,qualifiedSearch)
| stats values(offset_seconds) AS offset_seconds values(search) AS search values(eai:acl.app) AS app BY title
| rex field=search max_match=100 "index=(?!\")\s*(?<index>.*?)[\s\|\)]"
| rex field=search max_match=100 "index=\"\s*(?<index>.*?)(?<!\\\)\"[\s\|\)]"
| rex field=search max_match=100 "sourcetype=(?!\")\s*(?<sourcetype>.*?)[\s\|\)]"
| rex field=search max_match=100 "sourcetype=\"\s*(?<sourcetype>.*?)(?<!\\\)\"[\s\|\)]"
| rex field=title ".* (?<base_id>.*?) - ITSI Search$"
| search index=* OR sourcetype=*
| eval index=if(index!="",index,"*"), sourcetype=if(sourcetype!="",sourcetype,"*")
| append [| tstats count AS events WHERE index=* BY _time _indextime index span=10s
| eval indexing_lag=floor(_indextime - _time)
| stats perc98(indexing_lag) AS "ingest_latency" BY index
| where index!="\*"
| eval sourcetype="*"]
| append [| tstats count AS events WHERE sourcetype=* BY _time _indextime sourcetype span=10s
| eval indexing_lag=floor(_indextime - _time)
| stats perc98(indexing_lag) AS "ingest_latency" by sourcetype
| where sourcetype!="\*"
| eval index="*"]
| append [| tstats count AS events WHERE sourcetype=* index=* BY _time _indextime index sourcetype span=10s
| eval indexing_lag=floor(_indextime - _time)
| stats perc98(indexing_lag) AS "ingest_latency" BY index sourcetype]
| stats values(base_id) AS base_id values(offset_seconds) AS offset_seconds values(ingest_latency) AS ingest_latency BY index sourcetype
| search base_id!=""
| where ingest_latency>offset_seconds
| lookup itsi_kpi_attributes kpiid AS base_id OUTPUTNEW kpi_name service_name
| fields - base_id
| eval kpi_path=mvzip(kpi_name, service_name, "&&&")
| stats values(offset_seconds) AS offset_seconds values(ingest_latency) AS ingest_latency BY kpi_path
| rex field=kpi_path "(?<KPIs>.*)&&&(?<Service>.*)"
| eval ingest_latency=ceiling(ingest_latency)
| stats values(KPIs) AS KPIs values(ingest_latency) AS "Required Ingest Lag" values(offset_seconds) AS "Current Ingest Lag" BY Service
| fields Service KPIs *
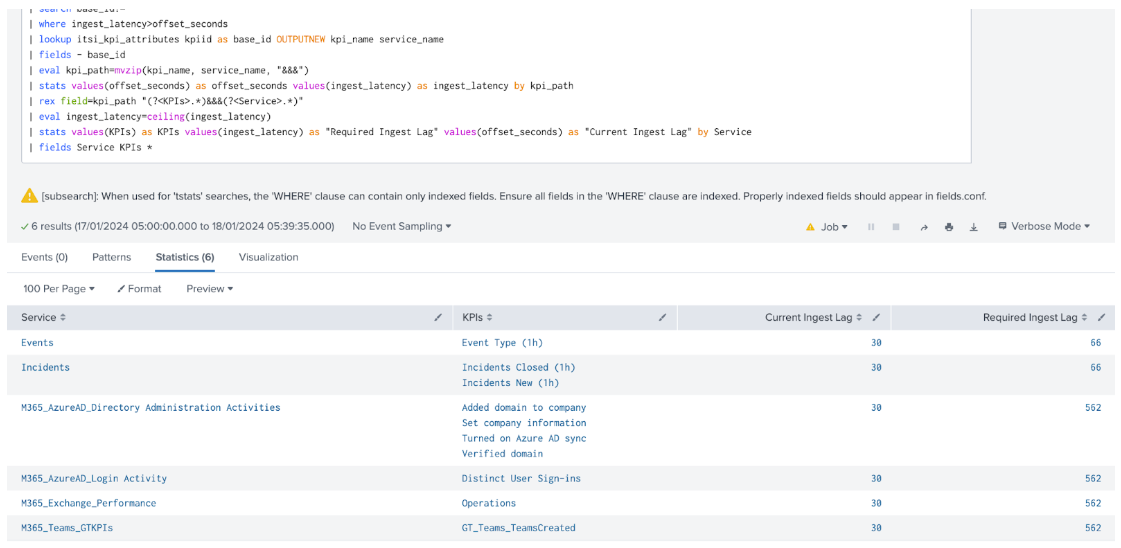
- Each line returned in the search results represents an index, source type and host combination that is used by ITSI and is experiencing ingest latency greater than 5 minutes. This can cause issues with KPI searches that are using this data, as the ongoing KPI search may not be looking back far enough to see the high latency events when they are eventually indexed at the correct time.
Step 2: Fix monitoring lag values
- Scroll to the top of the page and, in the top menu, click Configuration.
- Right-click Services in the subsequent dropdown menu and select Open in new tab.
- Return to the previous search results tab and perform the following steps for every line in the search results:
- Copy the value from the Service column, then switch to the tab containing the Services menu in ITSI.
- Paste the copied value into the Filter box at the top of the page and click on the Title of the service in the list that matches the copied value.

- Perform the following steps for each KPI listed in the KPI column from the search results tab, corresponding to the service name at the top left of the Service Definition tab.
- On the Service Definition tab, click the KPI name in the list on the left-hand side of the screen.
- Click the Search and Calculate option in the middle of the screen to expand that section.
- Click Edit on the Unit and Monitoring Lag line.
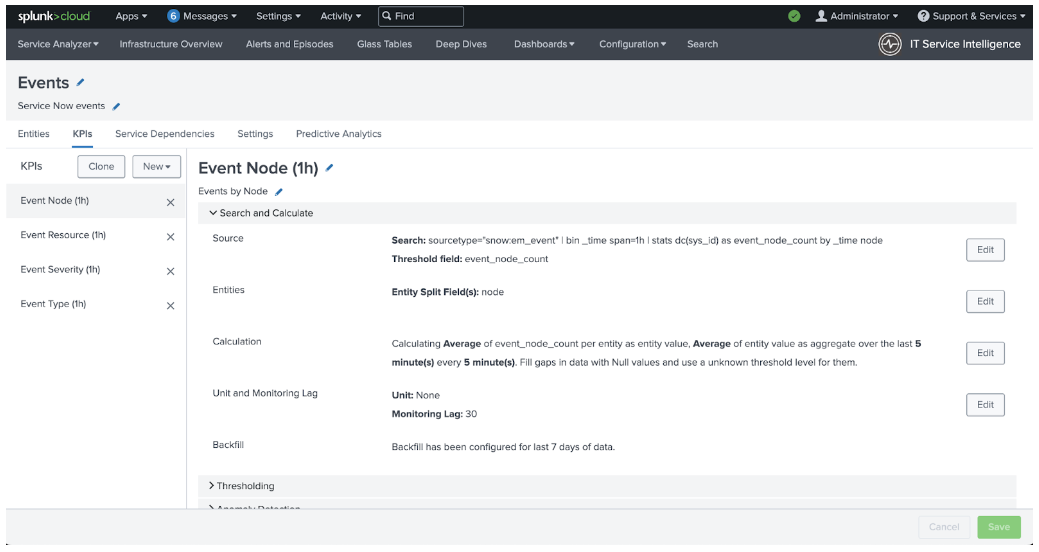
- Copy the Required Ingest Lag value from the search results tab for the Service that you are editing, then paste it into the Monitoring Lag (in seconds) box on the Service Definition tab.
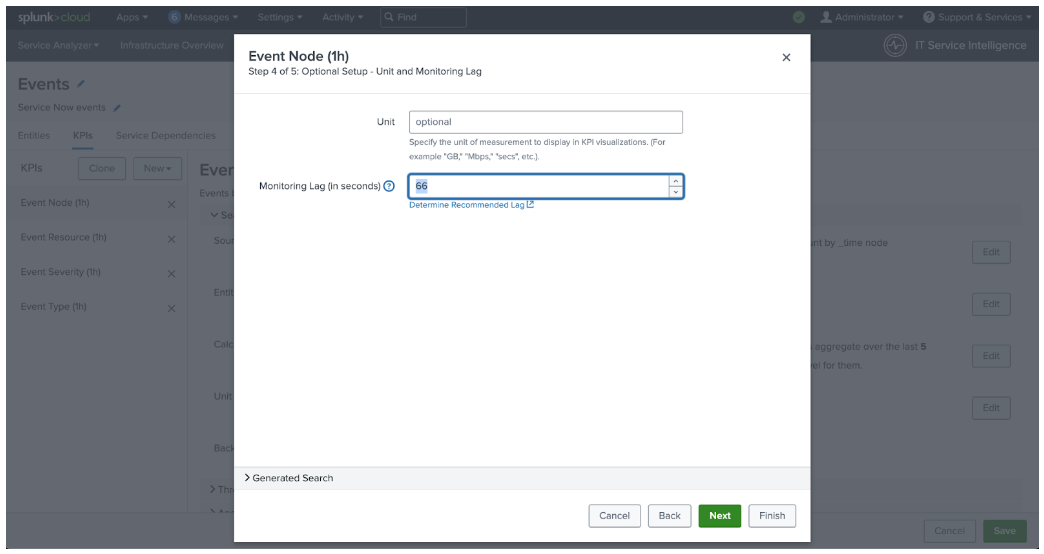
- Click Finish.
- After the Monitoring Lag has been updated for every required KPI in this service, click the green Save button in the bottom right of the screen and move-on to the next service and perform the same steps.
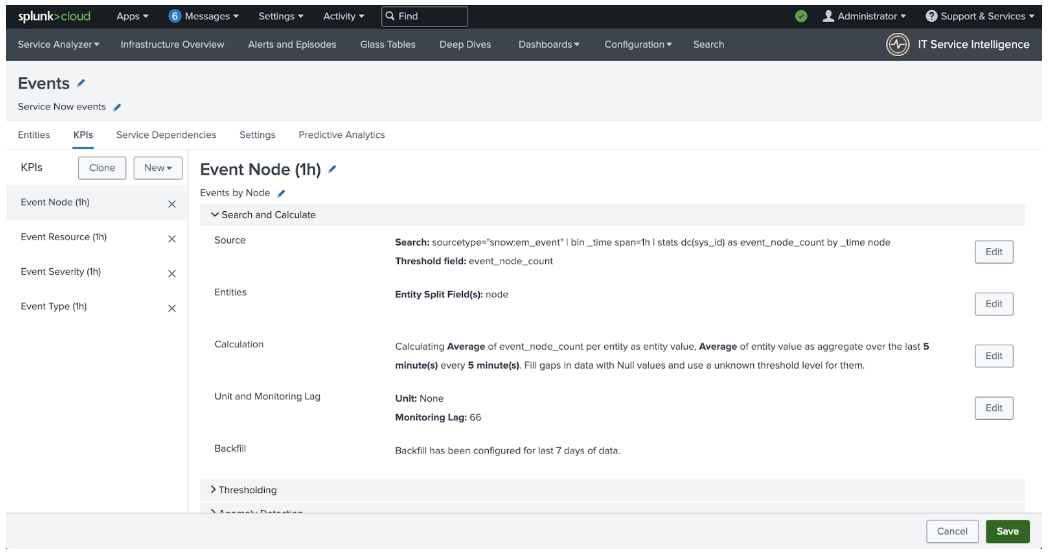
- After the Monitoring Lag has been updated for every KPI in every service from the search results, this activity is complete.
Video walk-through
In the following video, you can watch a walk-through of the procedure described above.
Additional resources
These resources might help you understand and implement this guidance:
- Splunk Help: Define KPI unit and monitoring lag in ITSI

