Reviewing your ITSI environment
Because of the complexities in changing IT environments, over time you might find that your Splunk ITSI environment is not performing as expected. You want to perform periodic checks to make sure that it is healthy and to find ways to optimize it.
This article is part of the Definitive Guide to Best Practices for IT Service Intelligence. ITSI end users will benefit from adopting this practice as they work on Service Insights.
How to use Splunk software for this use case
First, outside of Splunk ITSI, review your services to make sure the architecture hasn't changed, or to make sure any changes are reflected in your environment. After you have done that, use the ITSI Health Check Dashboard, the Event Analytics Monitoring Dashboard, and the Cloud Monitoring Console to verify that Splunk ITSI is healthy.
- Check your ratio of base searches to ad hoc searches.
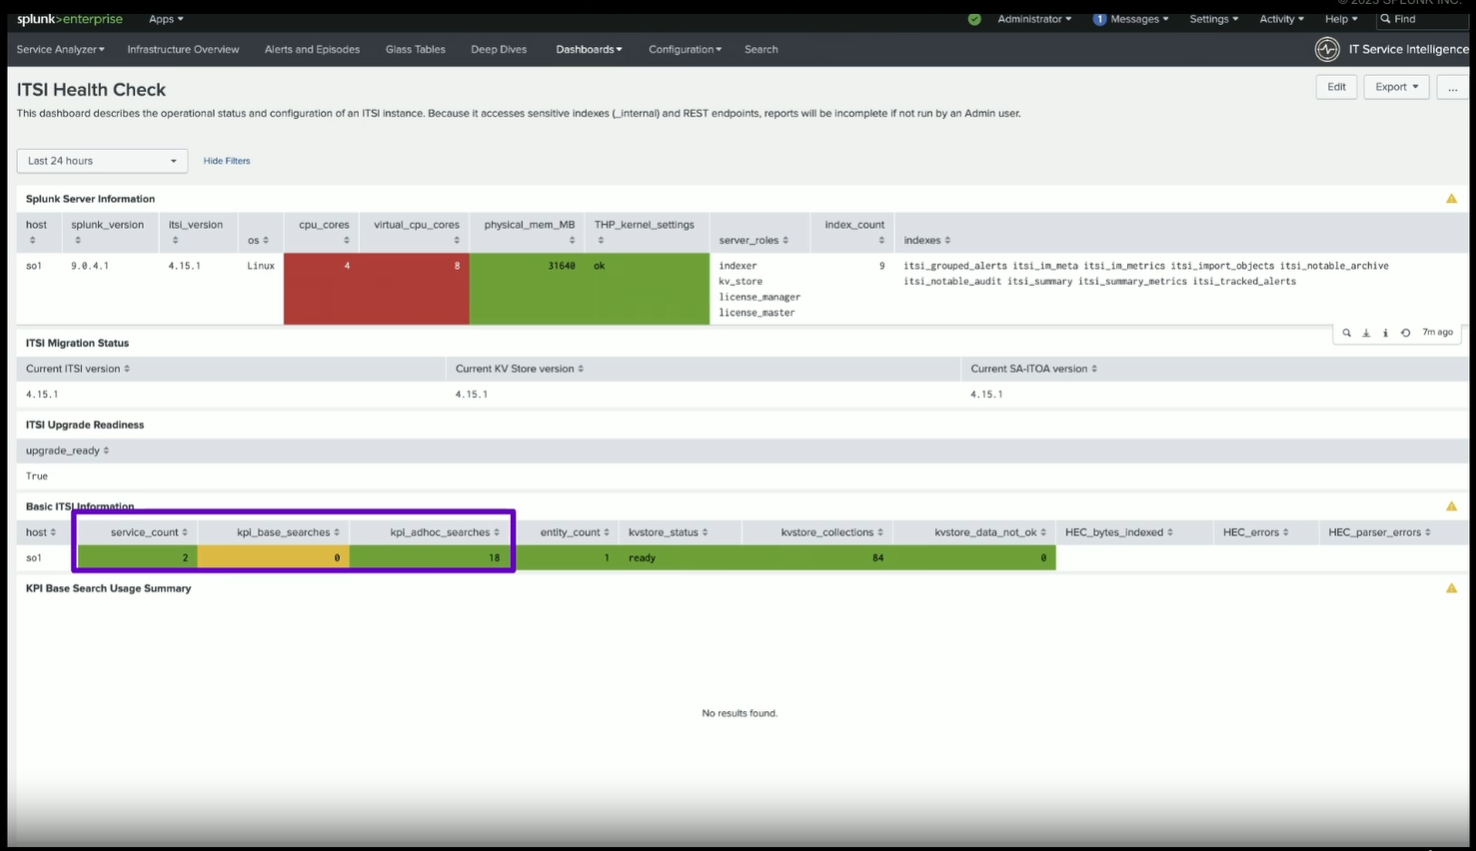
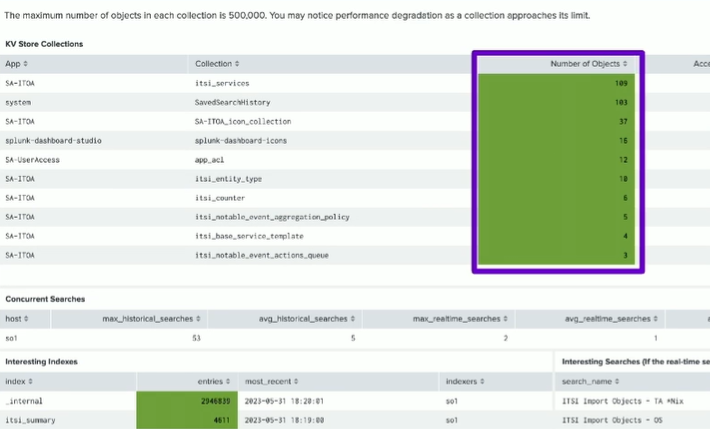
- Look at your KV store. Is it growing too large and unmanageable? This is especially a concern in a cluster environment where you can start to run into replication issues.
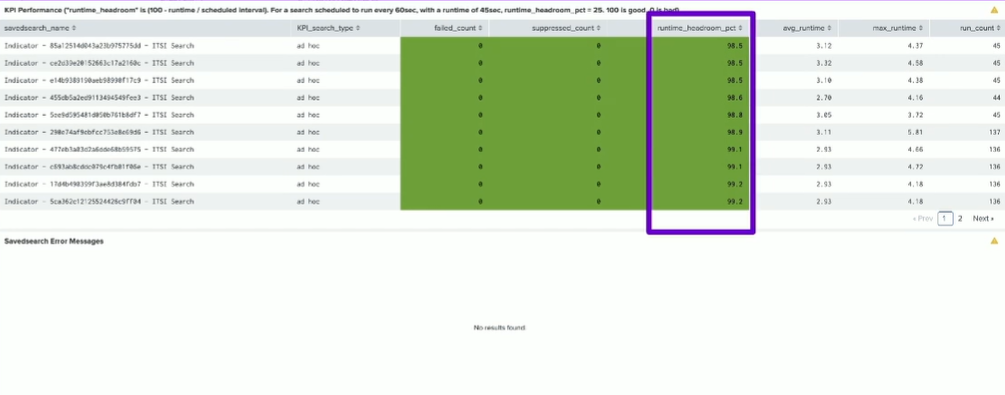
- In the KPI Performance panel, look at the runtime headroom for your searches. If your KPI is set to refresh every 5 minutes, but your search is so dense that it takes 10 minutes to execute, that's not going to produce meaningful value. Headroom lets you see the searches that aren't completing in the right amount of time.
- Look at the Concurrent Searches panel to see if searches are being skipped.

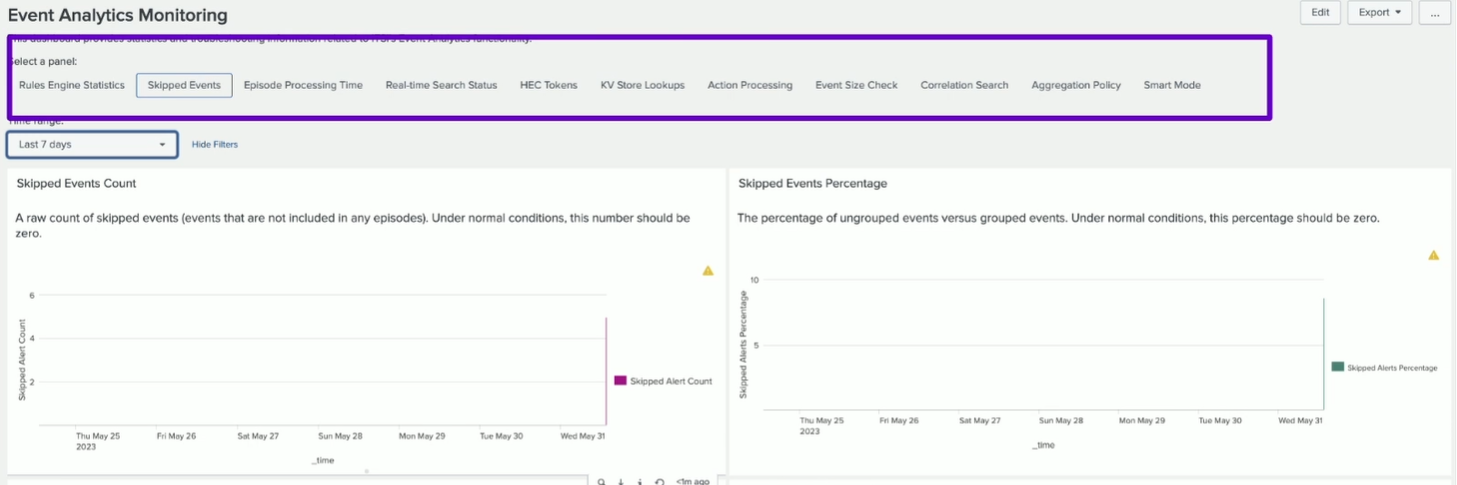
Event Analytics Monitoring Dashboard
Select the Skipped Events panel to see whether skipped events to make sure they are being aggregated correctly. The Event Time Processing Panel will tell you how long it takes them to run and help you determine whether you need to make adjustments.
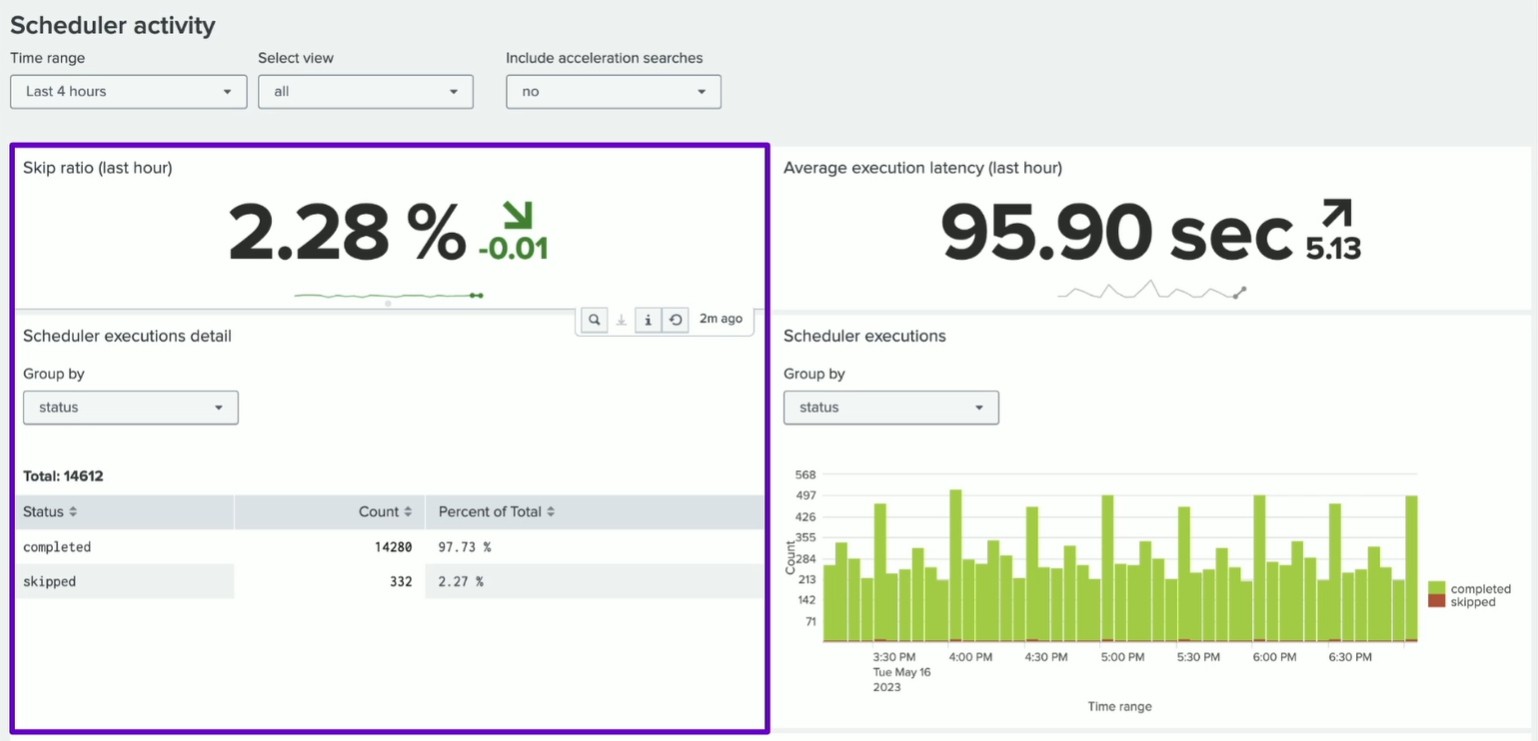
Cloud Monitoring Console - Scheduler Activity Dashboard
If you are a Splunk admin (not an ITSI admin), you can use the Cloud Monitoring Console to look at the skip ratio for searches. This can help you determine whether any KPIs need to be refactored.
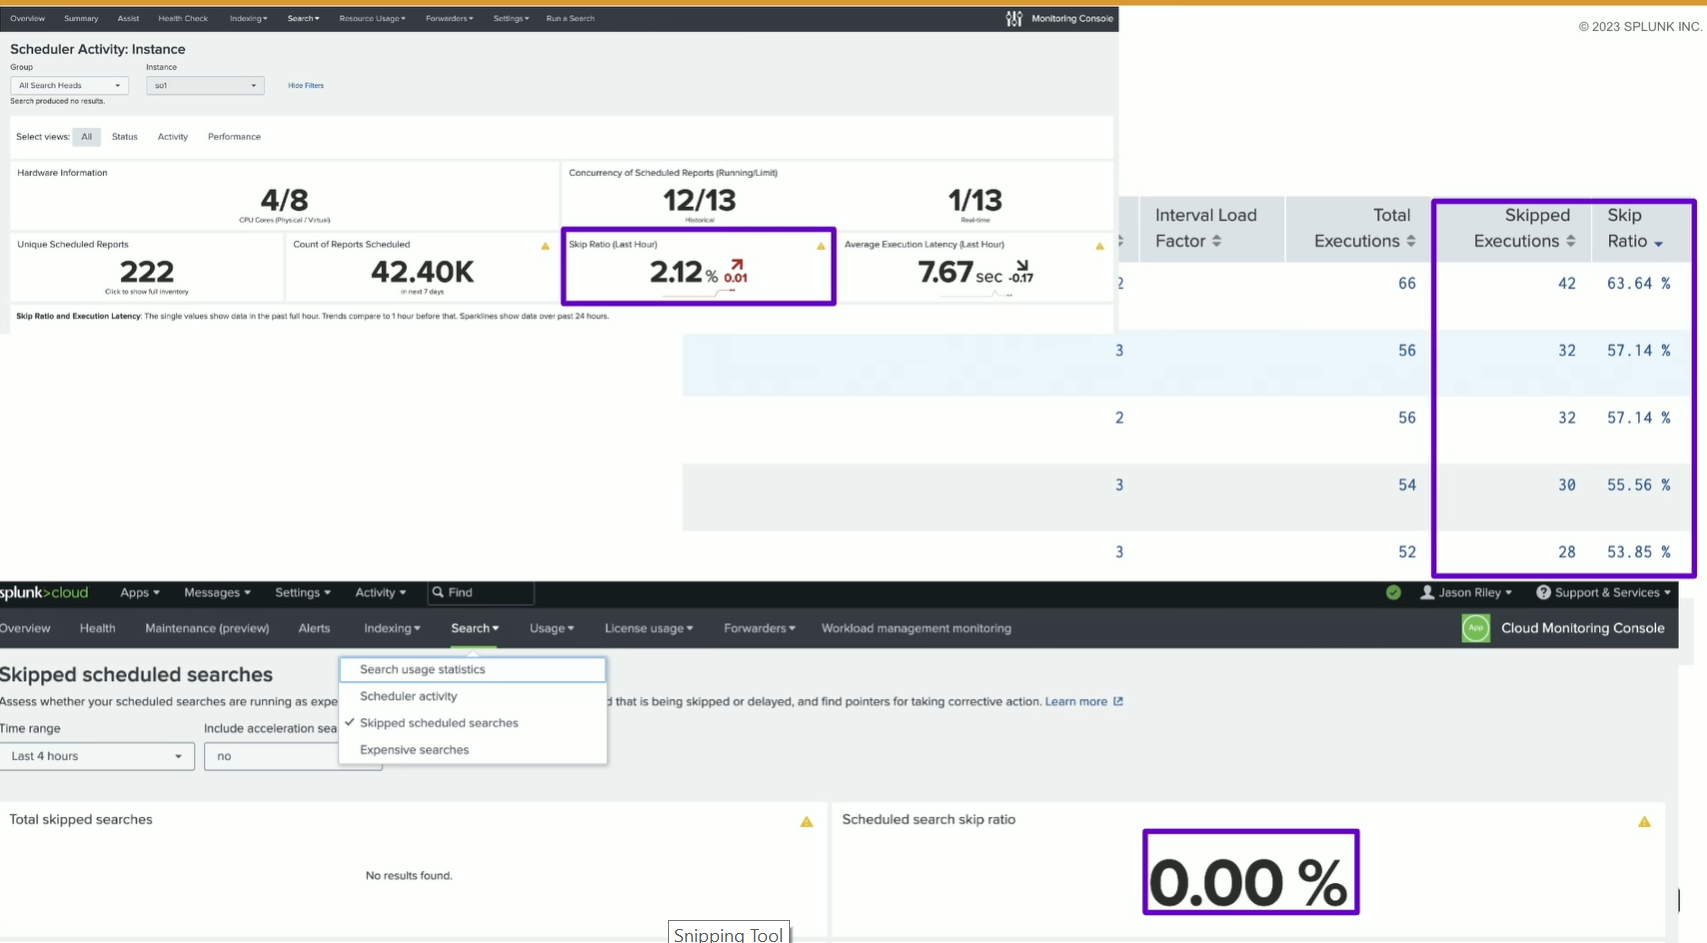
You can also dig into detail about skipped searches.
Next steps
You might also be interested in the following Splunk resources:
- Splunk Help: Service insights manual
- Splunk Lantern Article: Reducing skipped searches