Combining multiple compound detector conditions into a single detector
If you have multiple thresholds that must be met before a behavior is verified as alertable, Splunk Observability Cloud detectors can use compound alerts.
Combining multiple detector conditions into a single detector can be a requirement for more complex alerting. For example, you might need an alert that only fires when both CPU and disk utilization are over a certain threshold that indicates a specific failure mode.
To combine multiple single detector conditions into a single detector, see this article.
Using SignalFlow for detectors
To combine multiple compound alerting conditions into a single detector you can use the custom threshold option or use SignalFlow for more detailed configurations. SignalFlow can also be used in your detector configurations defined with the Terraform provider.
Using SignalFlow for detectors is easiest to accomplish with specific query parameters on your URL that look like the following:
- Create new detectors:
https://app.us1.signalfx.com/#/detector/v2/new?SignalFlow - Edit existing detectors:
https://app.us1.signalfx.com/#/detector/v2/<Detector_ID>/edit?detectorSignalFlowEditor=1
The realm (for example, us1) might need to be changed in the above URLs to match your realm. <Detector_ID> needs to be replaced with the ID of the detector you want to edit.
When every threshold matters
In this example, your instance needs to be restarted and you need to be alerted if:
cpu.utilizationfor a host.name is over 50% grouped and summed byhost.name,host.id, andcloud.availability_zonedisk.utilizationfor a host.name is over 90% grouped and summed byhost.name,host.id, andcloud.availability_zone- Both
CPUcondition andDISKcondition thresholds are being breached before the detector fires the alert
This means that for any distinct instance name or ID in a given availability zone, if both conditions are breaching stated thresholds, the alert will fire.
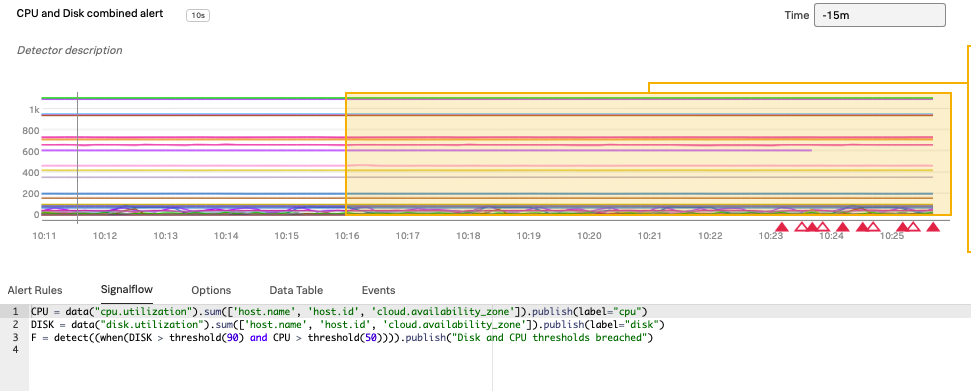
Example SignalFlow
CPU = data("cpu.utilization").sum(['host.name', 'host.id', 'cloud.availability_zone']).publish(label="cpu")
DISK = data("disk.utilization").sum(['host.name', 'host.id', 'cloud.availability_zone']).publish(label="disk")
F = detect((when(DISK > threshold(90) and CPU > threshold(50)))).publish("disk.utilization")
Alert message context
It's important to use the appropriate variable tags to pass context along within your alert rules. Use the detector message tagging to pass along valuable context from dimensions like servicename, host, or any other dimension contained in the alerting metric signal.
You can find variable tag naming references at Splunk Docs.
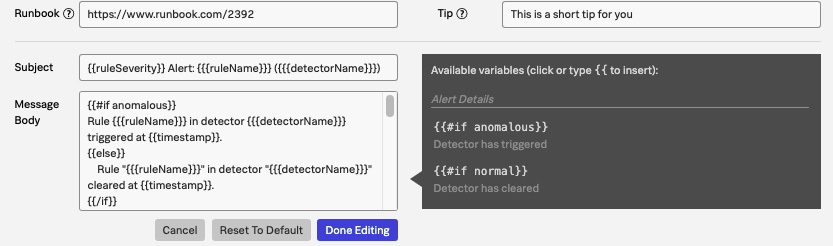
For example, a set of variable tags like the ones in the screenshot above provide the host and region information along with the signals and dimensions the alert is concerned with in the message body of the alert email.
{{#if anomalous}}
Rule {{{ruleName}}} in detector {{{detectorName}}}
triggered at {{timestamp}}.
{{else}}
Rule "{{{ruleName}}}" in detector "{{{detectorName}}}" cleared at {{timestamp}}.
{{/if}}
{{#if anomalous}}
Triggering condition: {{{readableRule}}}
{{/if}}
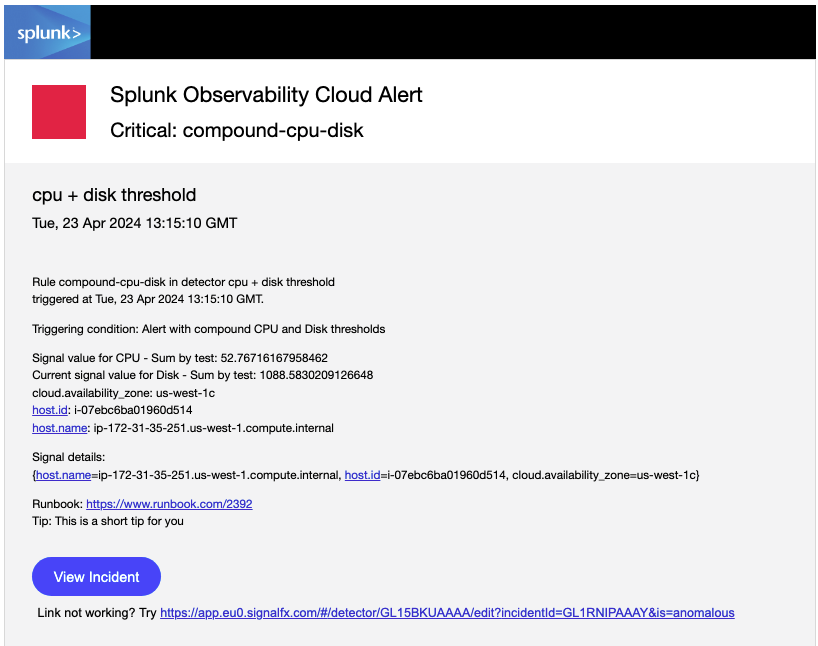
{{#if anomalous}}Signal value for CPU - Sum by test: {{inputs.CPU.value}}
Current signal value for Disk - Sum by test: {{inputs.DISK.value}}
cloud.availability_zone: {{dimensions.[cloud.availability_zone]}}
host.id: {{dimensions.[host.id]}}
host.name: {{{dimensions.[host.name]}}}
{{/if}}
{{#notEmpty dimensions}}
Signal details:
{{{dimensions}}}
{{/notEmpty}}
{{#if anomalous}}
{{#if runbookUrl}}Runbook: {{{runbookUrl}}}{{/if}}
{{#if tip}}Tip: {{{tip}}}{{/if}}
{{/if}}
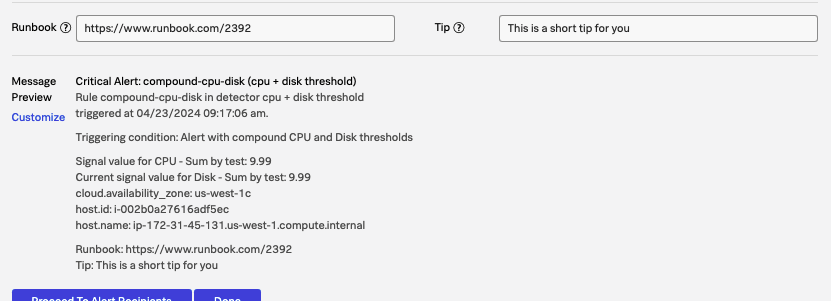
The message preview gives you an example of what the message body will look like with the variable tags filled in:
Next steps
These resources might help you understand and implement this guidance: