Finding and fixing problems quicker with Log Observer
Splunk Log Observer is no longer available for sale. For new customers interested in this functionality, we recommend you look into Log Observer Connect, which is free for Splunk Enterprise or Splunk Cloud Platform customers. For existing customers, Log Observer is still supported.
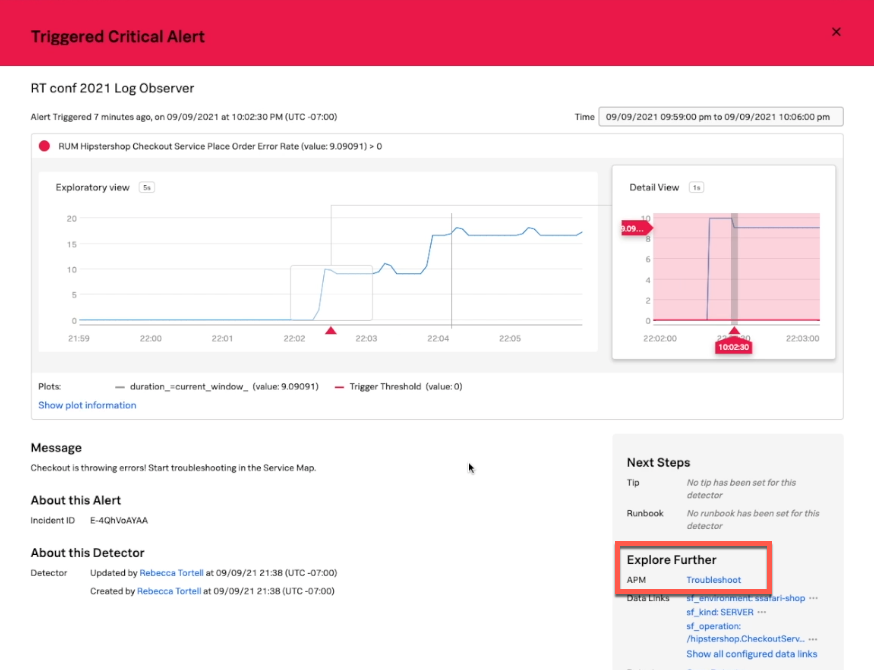
When you are paged with an alert, it'll look something like this. In this instance, this alert is about one of the services in your eCommerce application. In the bottom-right hand corner is a link that takes you to Splunk Application Performance Monitoring to start to troubleshoot the problem. Click there to go to Splunk Application Performance Monitoring.

Having all of your data together in one platform and unified by OpenTelemetry makes it easier to connect the alert that signaled the problem to the errors that are happening in the service. Error logs show you why the problem happened and how to fix it.
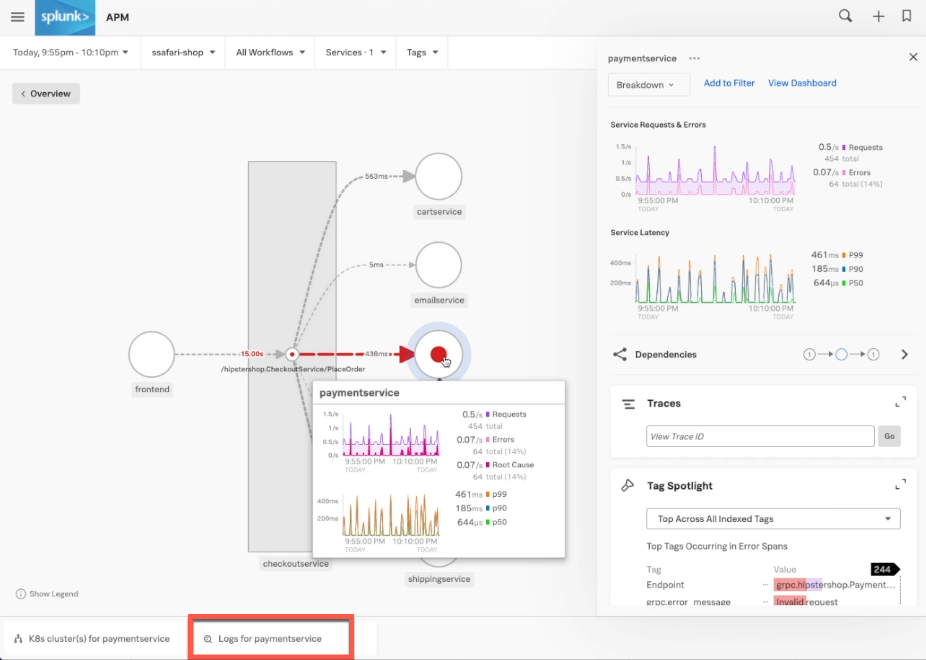
In Splunk Application Performance Monitoring, you can see that paymentservice is returning errors, and you can click on it to see more information. At the bottom of the screen, you can click Logs for paymentservice to jump straight to the logs in Splunk Log Observer.

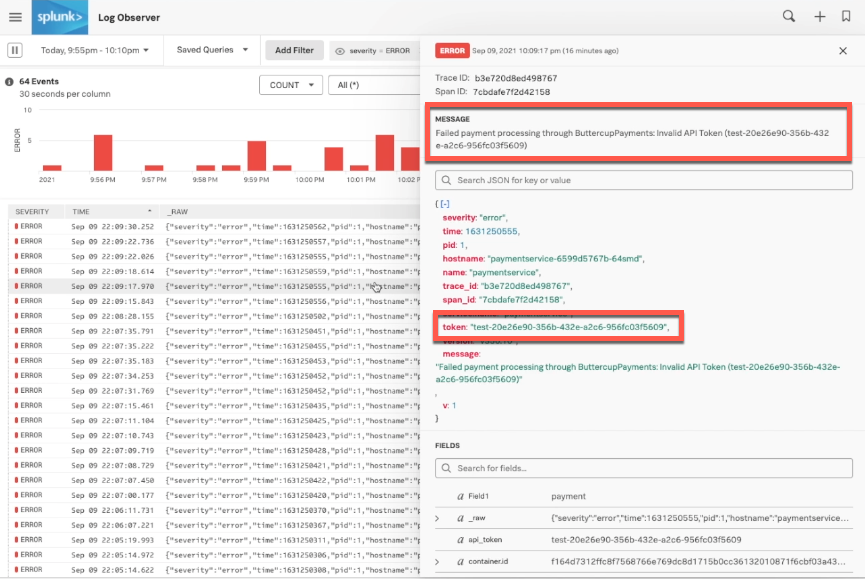
Back in Splunk Log Observer, there are a few messages to look at. In this example, the message is quite clear in telling you there is an invalid API token. This leads to more questions - is it a problem with this specific token? Or do you need to look at the downstream service that you're trying to auth to?
You can look more deeply by using visual analysis to check over time, analyzing all the values by adding them to your grouping. In this example, the token is included as a field in your incoming log messages. But even if it wasn't, you could extract it from the message using extraction rules. To add the token to a table, right-click it and select Add field as column.

This one token is well-represented in the lines of information that you can see.
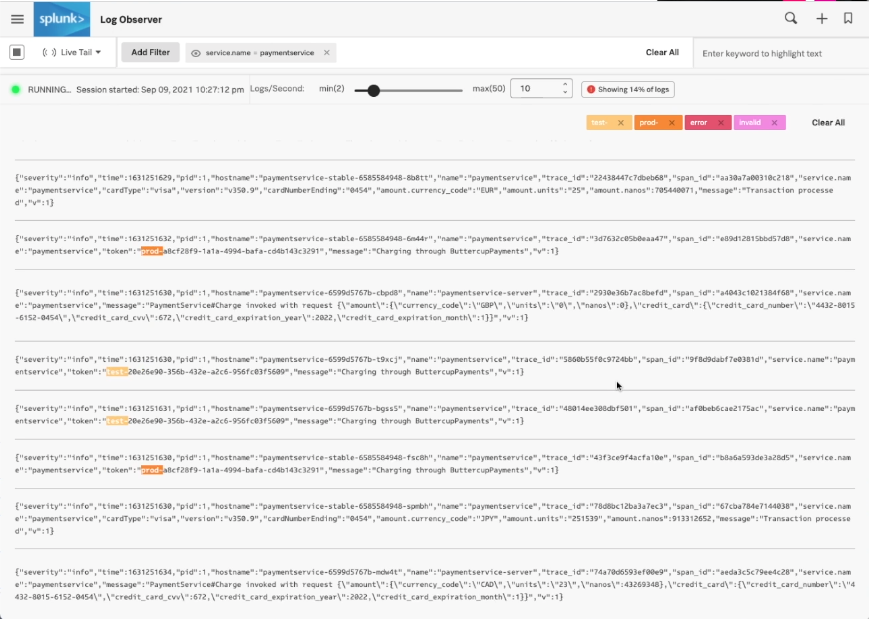
At this point, you can rule out a problem with all the tokens by taking off the severity filter and filtering to see all the tokens that show up in your production environment. In this example, there is another value showing - a test token that probably shouldn't be in production. It appears to have been accidentally added into your production deployment, so after that is fixed, your situation should return to normal.
.gif?revision=1)
Check that the problem has been resolved after a fix
To make sure that this test token doesn't show up in production any more, you can use Live Tail.
In Live Tail, you can search for keywords like test, prod, error, or invalid, so you can see if the errors are still appearing after your push.


