Monitoring Amazon Elastic Kubernetes Services (EKS) with Splunk Observability Cloud
This guide outlines the integration of Amazon Elastic Kubernetes Service (EKS) with Splunk Observability Cloud so you can observe EKS alongside the rest of your application telemetry data.
For additional context, refer to the following resources:
Splunk Observability Cloud provides a unified platform for monitoring and troubleshooting application infrastructure across multiple environments. You can collect and store Amazon CloudWatch metrics data, and if pieces of your applications and infrastructure live outside of AWS, you can view that data alongside your AWS data for a complete observability picture.
Data required
Process
To integrate AWS with Splunk Observability Cloud:
- In Splunk Observability Cloud, navigate to the Data Management section.
- Select AWS as the data source.

- Follow the integration wizard to prepare your AWS account.
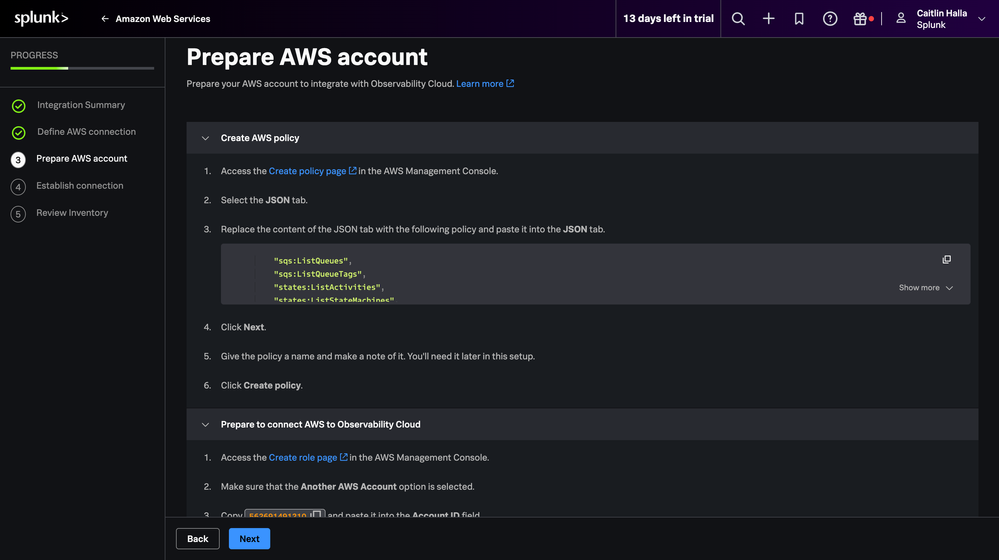
- Complete the wizard to import AWS data.

Install the Splunk Distribution of the OpenTelemetry Collector
Even with AWS integrated with Splunk Observability Cloud, you’ll notice from the Available Integrations page that you still need to deploy the OpenTelemetry Collector to get EKS data in.

Follow these steps to install the Splunk Distribution of the OpenTelemetry Collector:
- In Splunk Observability Cloud, follow the integration wizard to install the Splunk Distribution of the OpenTelemetry Collector, specifying Amazon Web Services as the Provider and Amazon EKS (or Amazon EKS / Fargate profiles) as the Distribution.

- Connect to your EKS cluster and follow the rest of the installation instructions. This example uses the AWS CLI in the terminal, but with Helm installed, you could also use AWS CloudShell. Start by configuring
kubectlfor the EKS cluster by updating yourkubeconfigfile.
- Verify the connection.

- Run the commands in the Splunk Observability Cloud installation instructions with
splunk-otel-collector --versionpinned to0.111.0.
- View the EKS telemetry data from within Splunk Observability Cloud.

Validating the integration
Now that your EKS cluster is sending data to Splunk Observability Cloud, you can use all the same products and features within Splunk Observability Cloud to monitor your Amazon EKS environment.
From Infrastructure Monitoring, you can:
- View your Amazon EKS navigators.

- Get insight into all of your Kubernetes clusters.

- View the health of a specific cluster.

- Observe critical performance data around nodes, containers, daemonsets, deployments, namespaces, pods, replicasets, and workloads.

From these critical usage metrics, you can create detectors and alerts from within your navigators, and they can live alongside the detectors and alerts for the rest of your applications and infrastructure.

Next steps
With Amazon EKS now successfully integrated, you can use Splunk Observability Cloud to proactively monitor, detect, and alert on anomalies in your EKS environment, alongside the rest of your application and infrastructure telemetry data.
In addition, these resources might help you understand and implement this guidance: