Correlating log data to metric charts in Observability Cloud dashboards
Dashboards for logs provide the ability to create log charts to correlate log data to metric charts in your Splunk Observability Cloud dashboards.
This capability provides:
- Operational efficiencies by avoiding switching back and forth between metrics and logs.
- Ability to visualize and correlate metrics and logs by time for accelerated root cause analysis.
- Improved MTTD (mean time to detect) and MTTR (mean time to restore) operational metrics.
This article shows you how to:
- Use different types of log charts in Splunk Observability Cloud
- Use log charts to find the root cause of issues
- Use charts in a Splunk Observability Cloud dashboard using the Splunk Log Observer UI
Use different types of log charts in Splunk Observability Cloud
There are two types of log charts supported in the Splunk Observability Cloud dashboards:
- Log Views. This chart shows a readable view of logs and their metrics.

- Log Timeline. This chart shows the rate of logged events over time, grouped by the fields and values of your choice.

Use log charts to find the root cause of issues
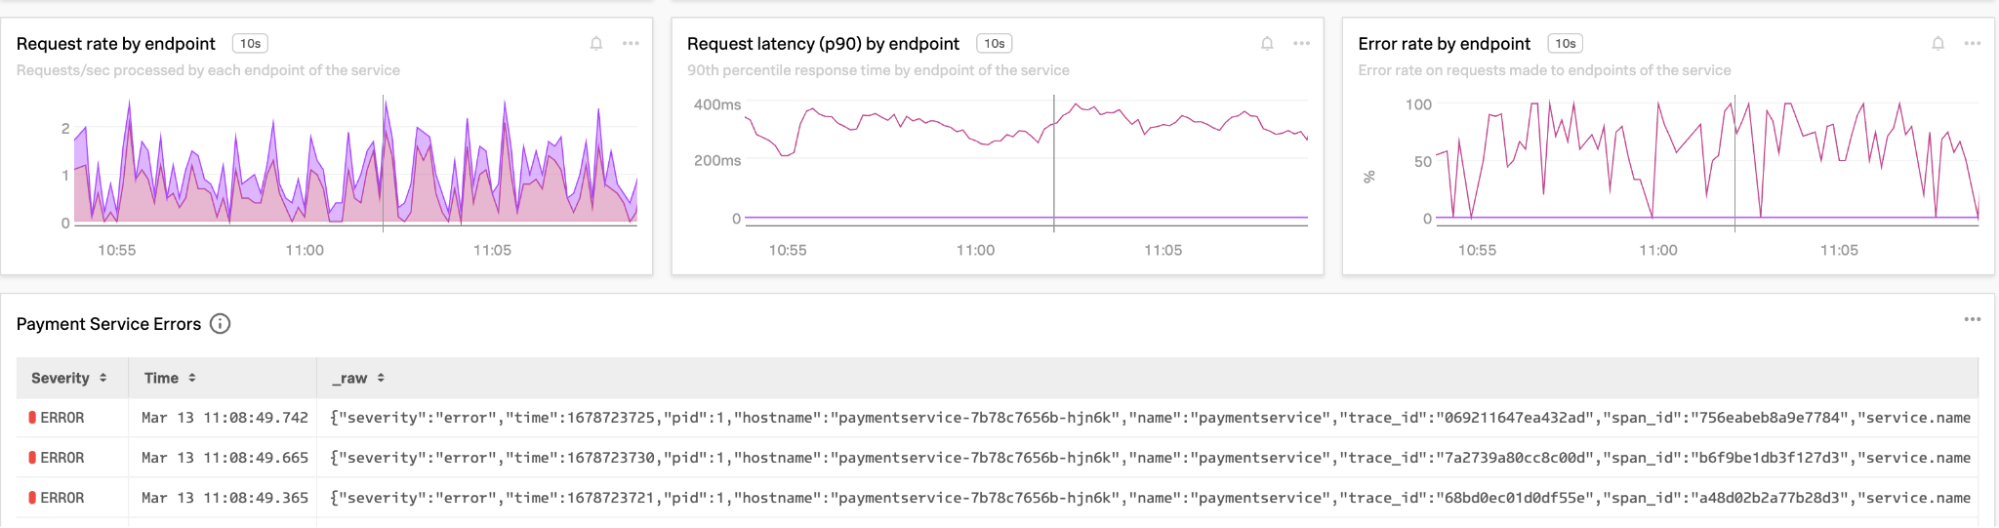
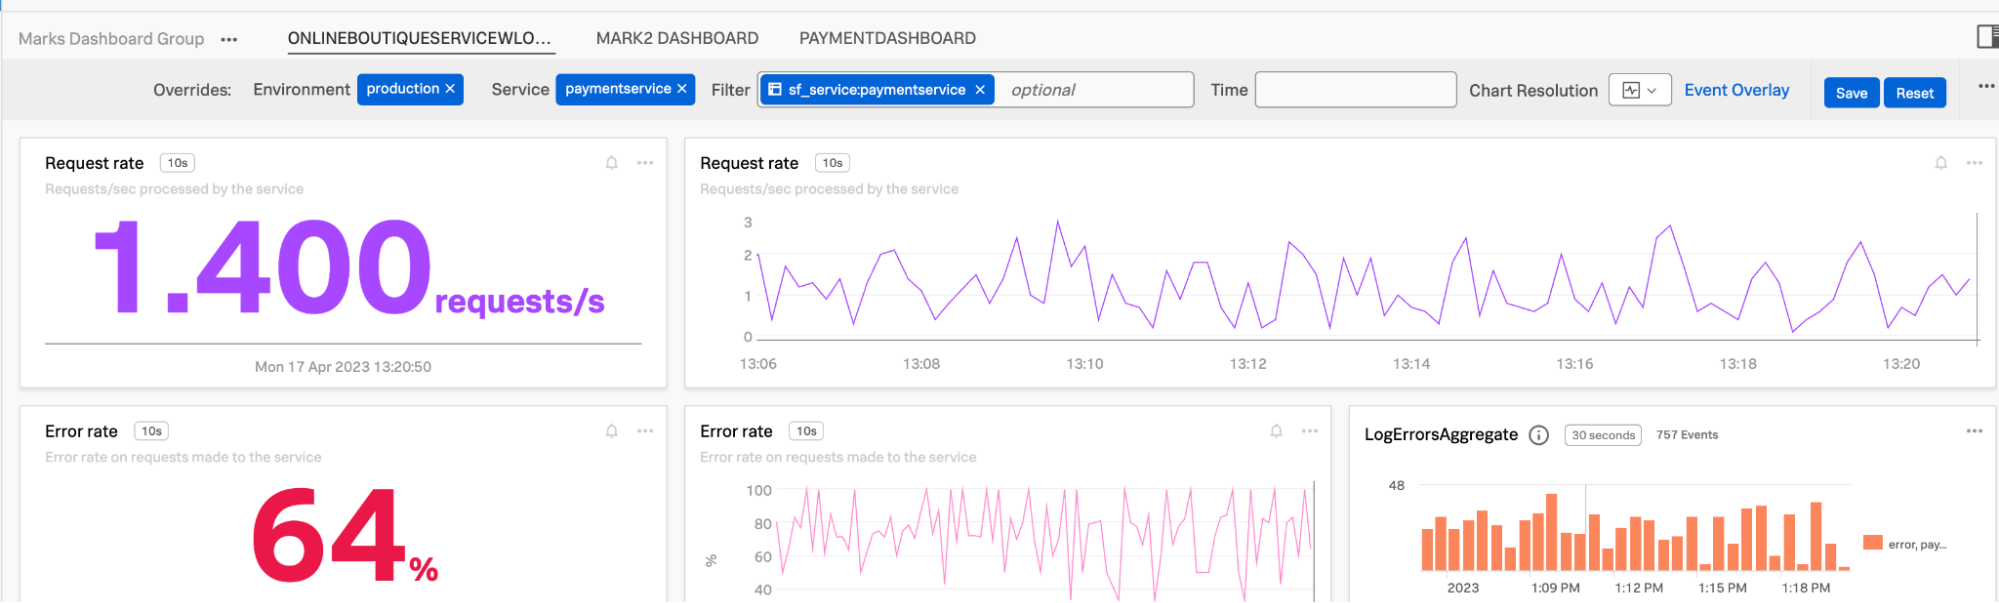
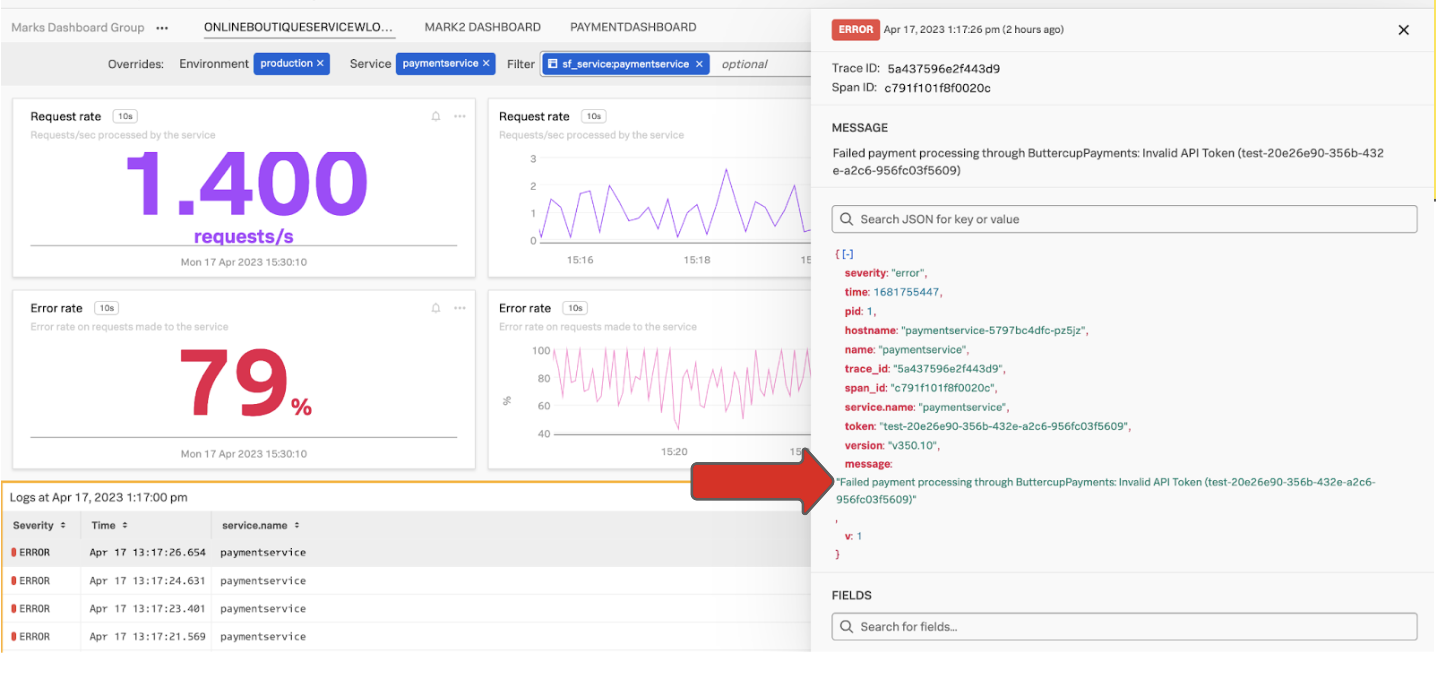
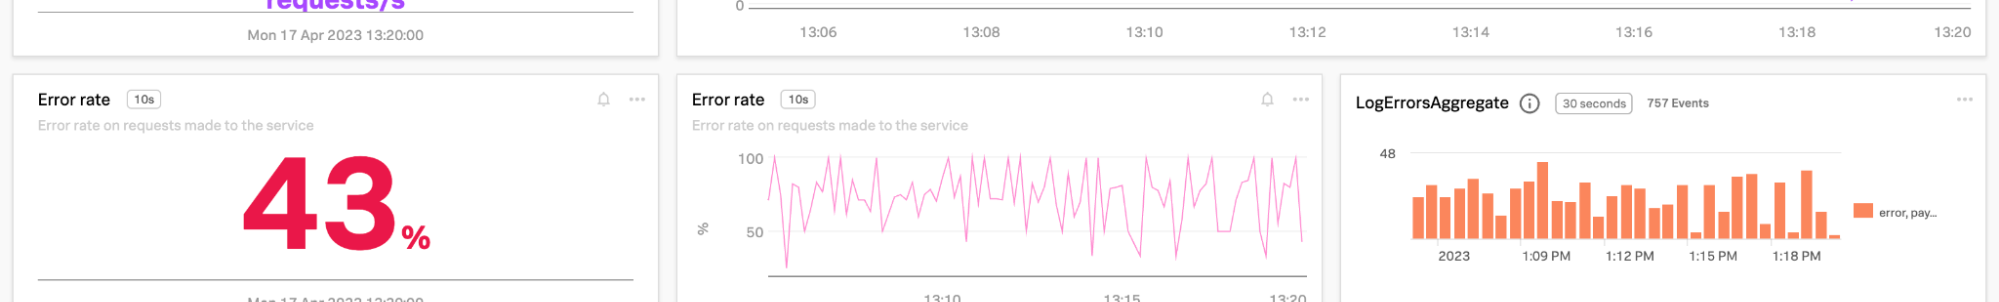
You can drill into specific logs from the log charts to determine root cause quickly, for example, where an SRE is seeing a spike in error rate for a payment service.
- Open the service dashboard and look at the payment service. In the example below, the LogErrorsAggregate chart on the right shows the number of error log events, and the detailed logs are visible underneath this.
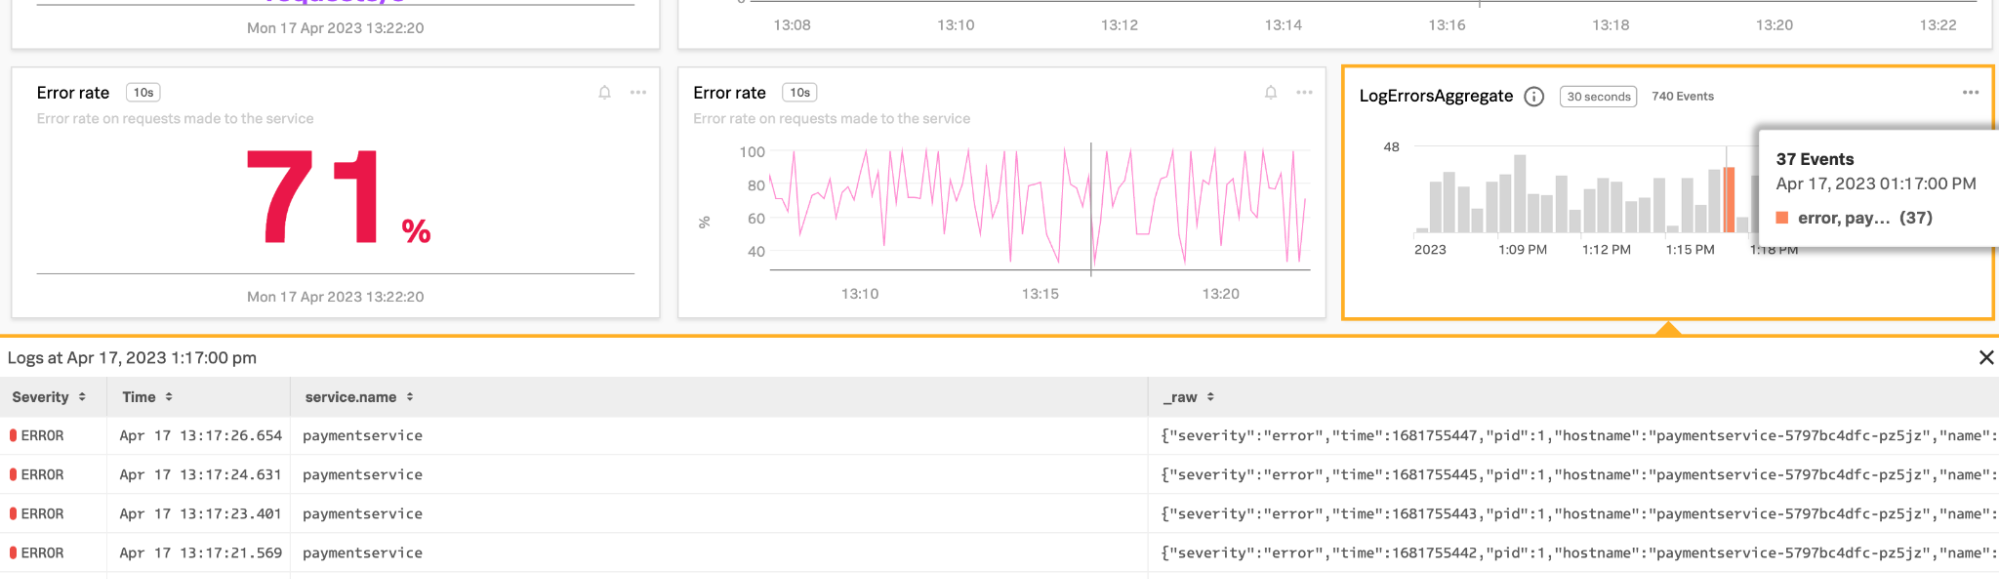
- Click one of the detailed logs to examine it. The screen displays all of the details of the individual event and allows you to navigate to the error detail in the relevant time period. In the screenshot below, the arrow points to the message where an invalid token was used, showing the root cause.

Use charts in an Splunk Observability Cloud dashboard using the Splunk Log Observer UI
Both types of charts can be easily configured and saved as charts in an Splunk Observability Cloud dashboard using Splunk Log Observer Connect.
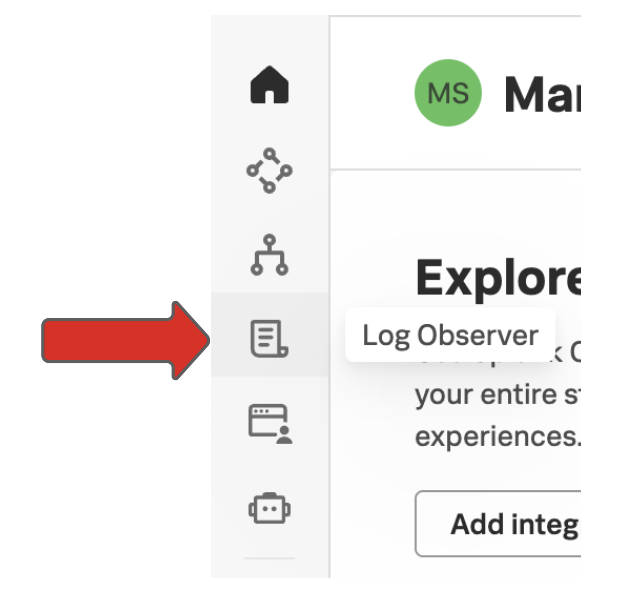
- Navigate to the Splunk Log Observer icon on the left UI navigation panel.
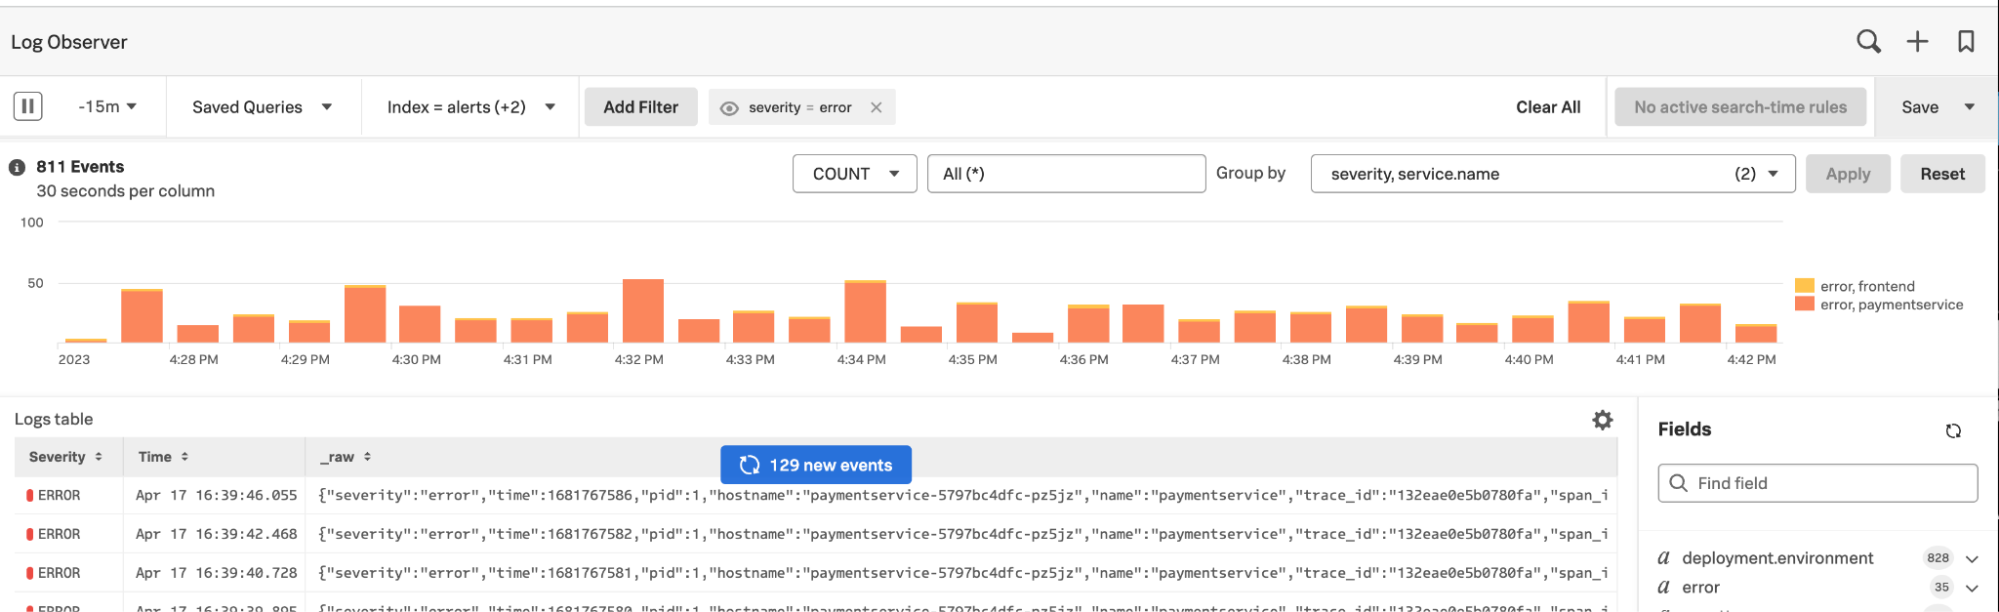
- Configure the chart views you need. In this example you'll configure the Log Timeline chart. Configure the appropriate source of log events by selecting the
o11y-1Log Observer Connect integration and theotel_eventsindex. These are logs coming from the Splunk Observability Cloud Kubernetes Open Telemetry collector that sends logs to the Splunk platform instance.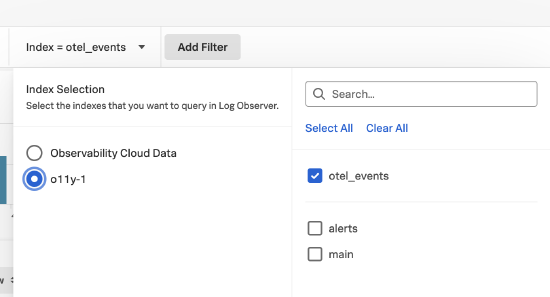
- Enter
severity, service.namein the Group by field. This provides the count by severity, withservice.nameas the aggregation. You'll need to includeservice.namegrouping so the filtering will occur in the new dashboard chart you create.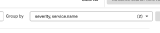
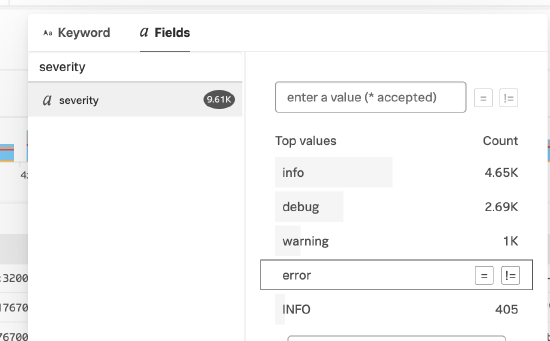
- Add a filter by clicking Add Filter at the top of the UI. Click α Fields, and then click error. This changes the count aggregation to only include logs with a severity that equals error.

The results look like this:
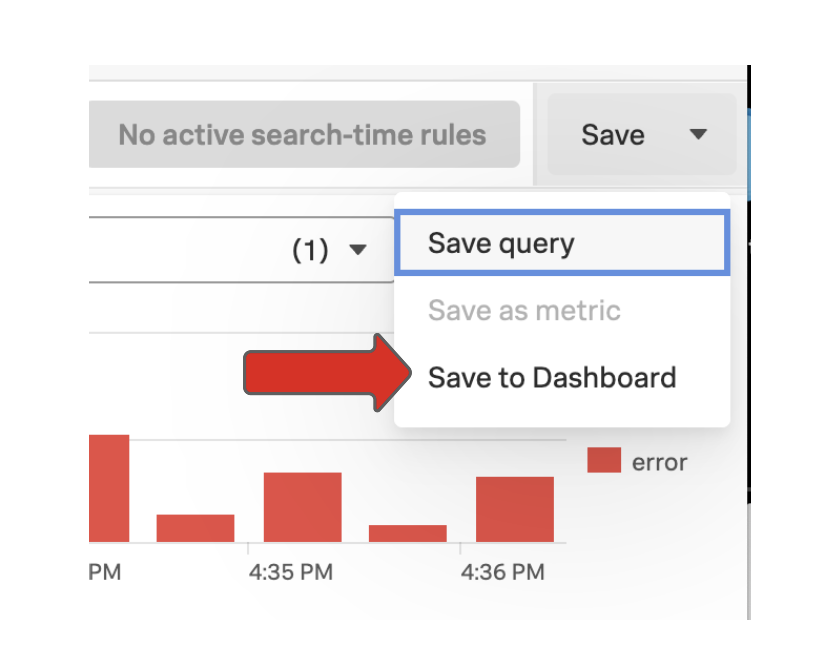
- In the Save drop-down menu in the top right of the UI, click Save to Dashboard.

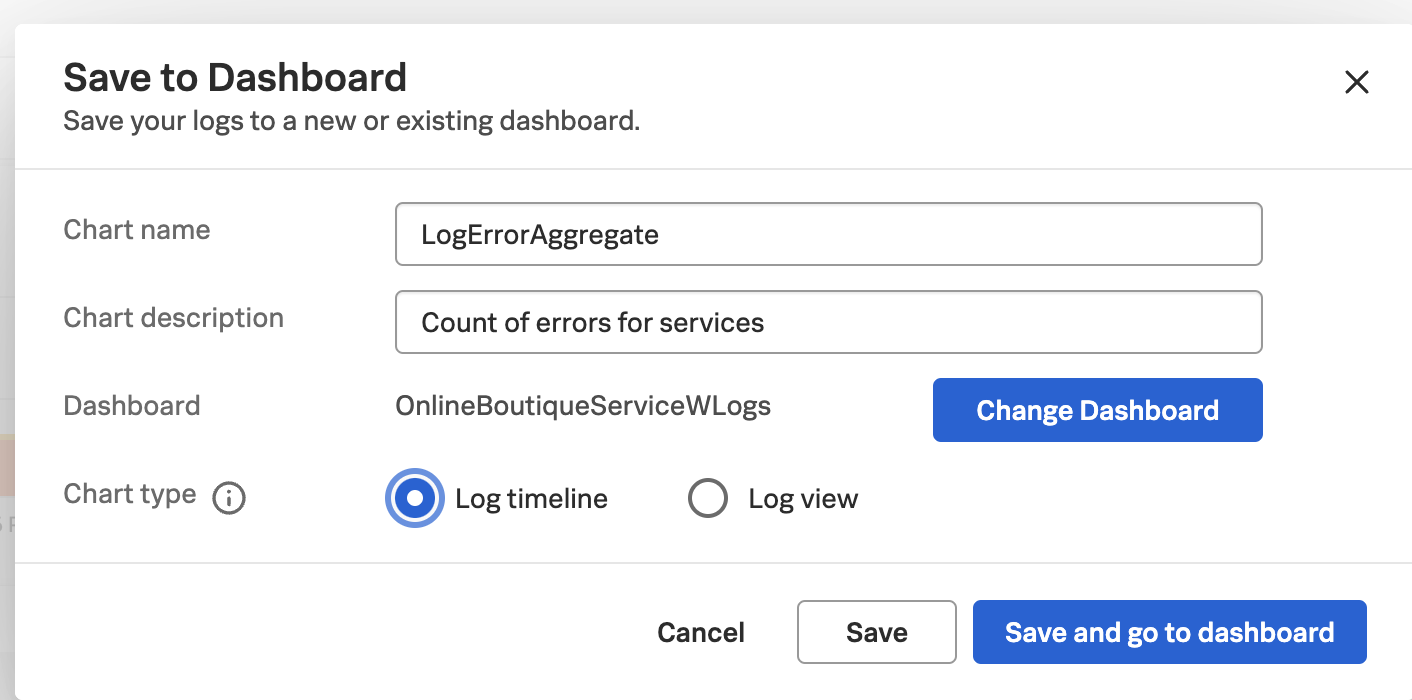
- Enter the following details:
- Enter the name of the new chart.
- Enter an optional description.
- Select the dashboard where you want to create the new timeline log chart.
- Select Log timeline as the log chart type.
- Click >Save and go to dashboard.
The chart is created in the dashboard like this:

To view or modify the chart, click ... in the chart and select View in Log Observer.
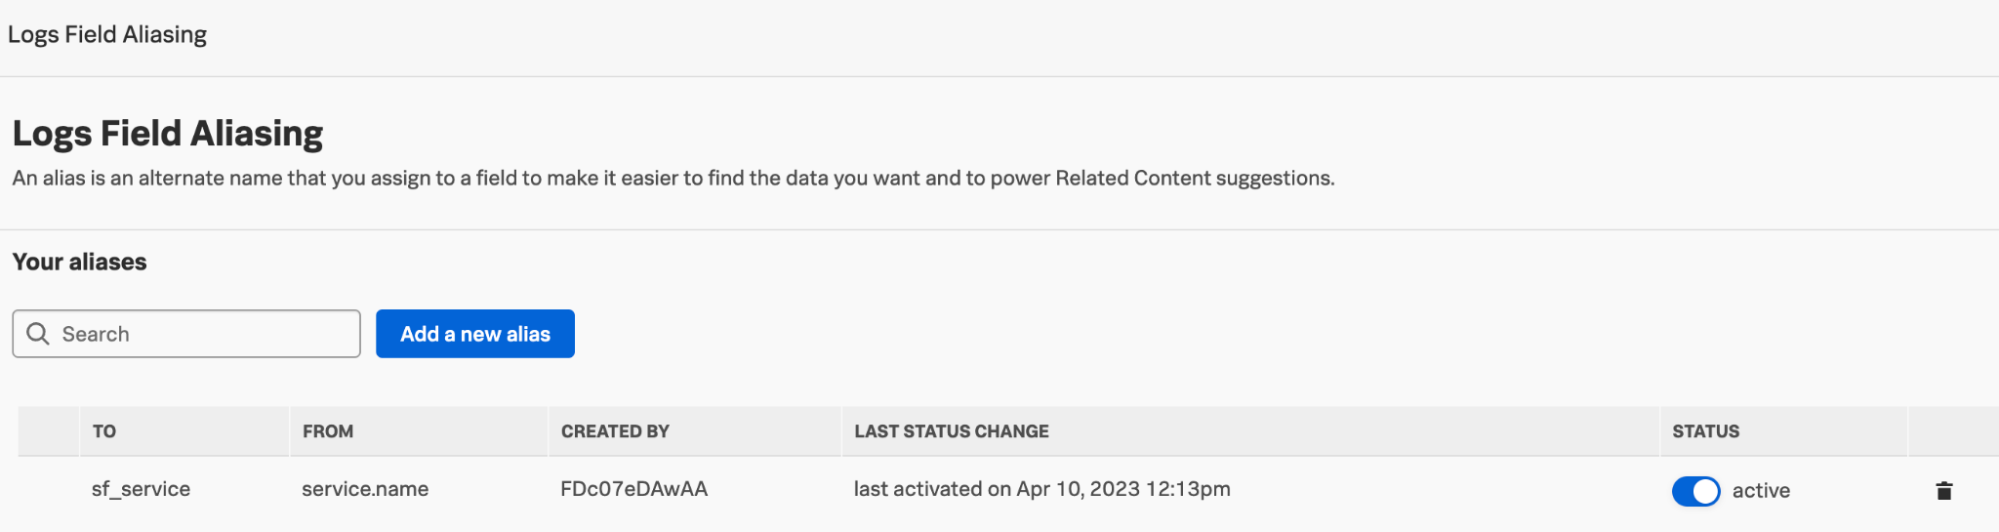
(Optional) Set up Log Field Aliasing
You can also use Field Aliasing. An alias is an alternate name that you assign to a field to make it easier to find the data you want and to power related content suggestions. To finalize this configuration, you need to make an entry to normalize the service.name field coming from Splunk Cloud Platform or Splunk Enterprise events and the sf_service field used in the Splunk Observability Cloud dashboards.
- From the Splunk Observability Cloud main menu, click Settings and then click Log Field Aliasing.
- Enter
service.namein the From field, andsf_servicein the To field, then click Save. This allows the filtering to work appropriately in the dashboards when a service name or names are selected.