Customizing JMX Metric Collection with OpenTelemetry
There are countless Java applications running in production today, many of which are mission critical. These applications have historically utilized JMX for management and monitoring purposes. As more and more Java applications move towards OpenTelemetry-based solutions for observability, it’s important that the teams responsible for these applications retain visibility to attributes exposed via Java Management Extensions (JMX).
In this article, we’ll walk through OpenTelemetry support for JMX, and show how to use the Splunk Distribution of the OpenTelemetry Collector with the JMX receiver to capture JMX metrics and export them to Splunk Observability Cloud. We’ll then demonstrate how to customize this functionality for applications that expose Managed Beans (MBeans) with custom attributes.
What is JMX?
Java Management Extensions, or JMX for short, is a technology that’s been part of the Java ecosystem for many years. It allows applications to be managed and monitored both locally or remotely.
A related concept is Managed Beans, or MBeans for short. MBeans are managed Java objects that represent a resource that can be managed or monitored. MBeans can include one or more of the following:
- A set of attributes that can be read
- A set of attributes that can be written
- A set of operations that can be invoked
This article will focus on the set of attributes that can be read, as these are the attributes that can be ingested via OpenTelemetry to the observability backend of your choice.
Explanation of the demo application
For the purpose of this article, we’ve created a simple Java application, which you can find in GitHub. It’s based on Spring Boot, and we’ll deploy it into an Apache Tomcat container running on Docker. The application has a single endpoint, and responds with “Hello, JMX World!” when invoked. The application also includes a custom MBean, which exposes an attribute named InvocationCount. This attribute keeps track of the number of times the endpoint is invoked.
Later in the article, we’ll show how to configure OpenTelemetry to bring this custom attribute into Splunk Observability Cloud as a metric, where it will be available for alerting and dashboards.
Building and running the application
Let’s get the application up and running by first building the war file, then building the Docker images, and finally starting the containers with Docker compose. If you’d like to follow along, you’ll need the following installed on your machine:
- OpenJDK v21
- Docker
- Maven v3.9.4
While the example provided here is functional, it is not production ready. Making it production ready would include changes such as securing the JMX endpoint with SSL and adding a health check for the JMX Metric Gatherer container to ensure it remains healthy and is running continuously.
The instructions assume a Linux or Mac OS environment, but can be adjusted for Windows as needed.
Use the commands that follow each step to build the application.
- Clone the GitHub repository to the local machine.
git clone https://github.com/dmitchsplunk/customize-jmx-receiver-opentelemetry.git
cd customize-jmx-receiver-opentelemetry
- Build the Java sample application and copy the result to the tomcat directory.
cd jmx-java-app
mvn package
cp ./target/jmx-java-app-1.0-SNAPSHOT.war ../tomcat/
- Build a Docker image with Tomcat and our application.
cd ../tomcat
docker build -t tomcat-with-sample-app .
- Build a Docker image with the OpenTelemetry JMX Metric Gatherer
cd ../jmx-metrics
docker build -t jmx-metric-gatherer .
- Create a file named .env in the root directory with the information required to connect to Splunk Observability Cloud.
SPLUNK_REALM=<i.e. us0, us1, eu0, etc>
SPLUNK_ACCESS_TOKEN=<your access token>
SPLUNK_MEMORY_TOTAL_MIB=1024
SPLUNK_LISTEN_INTERFACE=0.0.0.0
SPLUNK_HEC_TOKEN=<your Splunk HEC token>
SPLUNK_HEC_URL=<your Splunk HEC URL>
- Run the application locally.
cd ..
docker compose up
- Access the web application using your browser: http://localhost:8080/jmx-java-app/

Viewing JMX Metrics with JConsole
-
When working with JMX, it’s helpful to use the JConsole utility that ships with most Java Development Kits (JDKs). To launch JConsole, enter jconsole from the terminal.
To allow JConsole running on your local machine to connect to the Tomcat endpoint running in Docker, the following line should be uncommented in the
tomcat/setenv.shfile of the source code.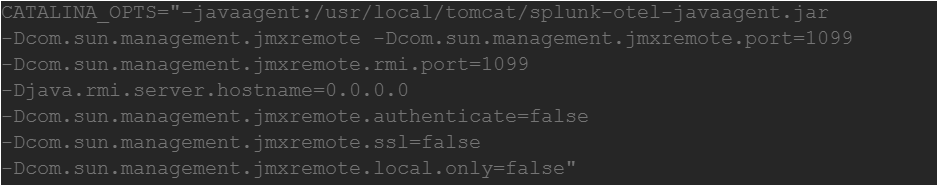
The Tomcat image needs to be rebuilt for this change to take effect. But to connect to the Tomcat JMX endpoint from another Docker container, which you’ll do later on in the article, this setting needs to be reverted. - To connect to the JMX endpoint exposed by Tomcat, enter localhost:1099 into the Remote Process text field and click Connect.
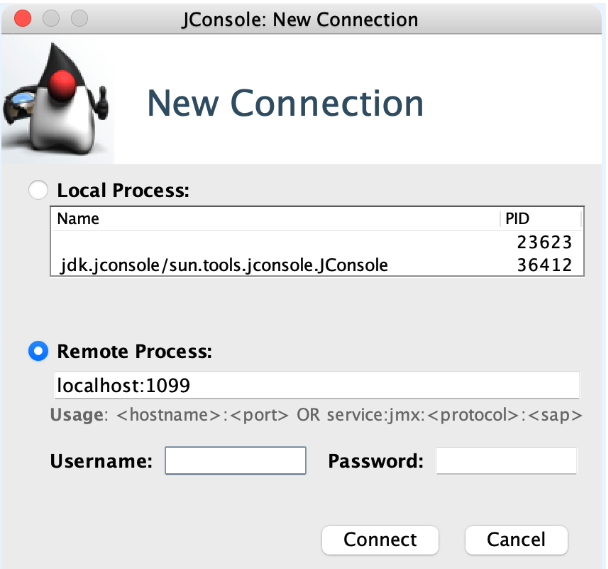
- If your Tomcat test server hasn’t implemented SSL, as in this example, click Insecure connection to proceed with the connection. Note that SSL is recommended for production environments.

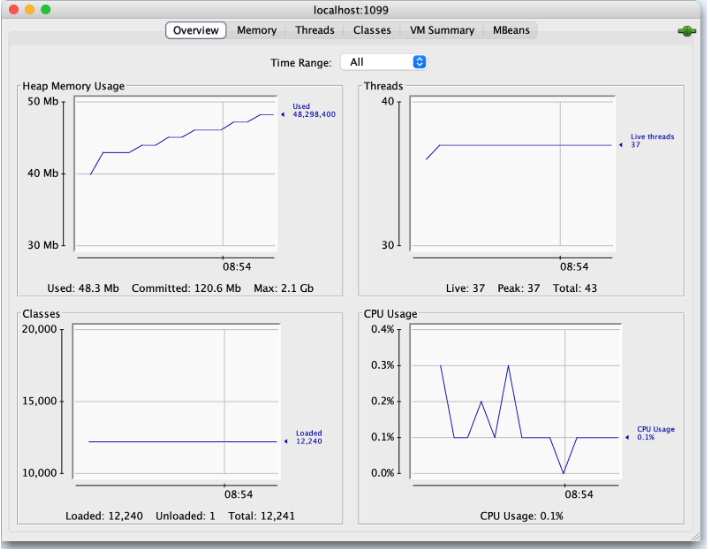
- At this point, you are connected successfully and presented with the following overview.
- Click the MBeans tab to see which MBeans are exposed by your Tomcat server.

- You can see a number of MBeans available in the left-hand menu. Expand the Catalina MBean.

- The Catalina MBean includes a number of attributes exposed by Tomcat, which are useful for monitoring the health of the application server. As you’ll see later in the article, the JMX receiver provides out-of-the-box support for many of the attributes included in this MBean. Close the Catalina MBean and expand the
jmx-java-appMBean on the bottom left.
- This MBean was exposed by the application, and tracks the number of times the “Hello, JMX World” endpoint was tracked since the application server was started. If you access the web application a few more times, then click Refresh in JConsole, you’ll see this value increase accordingly.
So with JConsole, we can see that a number of MBeans are exposed by our Tomcat server, including the custom MBean that’s part of our application. In the next section, we’ll explore how to ingest these attributes using OpenTelemetry, so they’re available for alerting and dashboards in Splunk Observability Cloud.
OpenTelemetry JMX deployment options
In the previous section, we saw how JConsole can be used to view JMX attributes. However, JConsole can only connect to a single JVM at one time and isn’t designed to monitor large-scale production deployments. For this reason, it’s necessary to bring these attributes into an observability backend such as Splunk Observability Cloud.
With OpenTelemetry, we can ingest JMX attributes using one of the following deployment options:
- The JMX Receiver, which is part of the OpenTelemetry Collector, runs the JMX Metric Scraper as a sub-process to pull JMX metrics from the target endpoint. It supports a number of target systems out-of-the-box, such as Kafka, Tomcat, and Wildfly.
- The JMX Metric Scraper runs as a standalone Java application to scrape JMX data from the target endpoint and send it to the specified OpenTelemetry collector. This deployment option supports the same target systems out-of-the-box, but also allows a custom YAML definition with
otel.jmx.configto be utilized to collect additional MBean attributes. - JMX Metric Insights runs within the OpenTelemetry Java agent, and can be used to collect JMX metrics based on predefined configurations. It also supports custom configuration via one or more YAML files.
The first option is generally recommended when the out-of-the-box target systems are sufficient. When additional attributes are required, the second option is required. We’ll explore both of these options.
For further details on the third option, refer to Gaining JMX Metric Insights with the OpenTelemetry Java Agent.
Using the JMX Receiver
In this section, we’ll show how the JMX receiver can be used to collect JMX attributes from our application server.
Our application already includes the Splunk Distribution of the OpenTelemetry Collector, which is running as a separate Docker container.
The high-level architecture of this deployment option is shown in the following diagram.

In the diagram, we can see that:
- The OpenTelemetry Java agent is deployed in our Tomcat container.
- The OpenTelemetry Collector launches the JMX Metric Scraper as a sub-process.
- Our Tomcat container exposes an endpoint used by the JMX Metric Scraper to pull JMX metrics.
- Our collector is configured to export metric and trace data to Splunk Observability Cloud.
- Add the JMX receiver to your collector configuration as follows:
receivers:
 jmx:
   jar_path: /opt/opentelemetry-java-contrib-jmx-metrics.jar
   endpoint: tomcat-with-sample-app:1099
   target_system: jvm,tomcat
   log_level: info
The JMX receiver configuration references the JMX Metric Scraper jar file, which is automatically installed to this location with the Splunk Distribution of the OpenTelemetry Collector. Additionally, you’ve specified target systems ofjvmandtomcat, as these are the most appropriate for your environment.
When the Collector starts, it will launch a Java sub-process running the specified jar file, which will gather the MBean attribute values defined in thejvmandtomcattarget system specifications, which are documented here in GitHub. - You’ll also need to run the following to ensure that the JMX receiver is included in the metrics pipeline.
pipelines:
  traces:
  …
metrics:
  receivers: [hostmetrics, otlp, jmx]
  processors: [memory_limiter, batch, resourcedetection]
  exporters: [signalfx]
- Restart your application using Docker Compose to ensure it picks up the updated collector configuration.
- Log in to Splunk Observability Cloud and navigate to the Metric Finder. Then search for metrics that include the word “tomcat”.

We can see that a number of Tomcat metrics are now available in our system, which were brought in via the JMX receiver. The list of metrics is documented here in GitHub.
As an example, let’s look at the tomcat.threads metric.
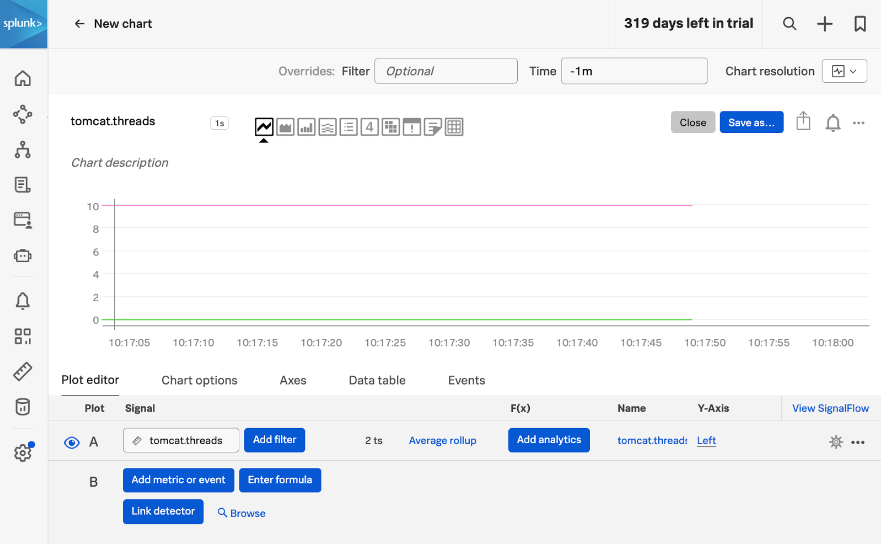
In the screenshot, the pink line represents the number of idle threads, and the green line represents the number of busy threads. Because our application isn’t doing much, all of the threads are idle. For an application with production load, tracking this would be valuable, as having 100% of the threads busy would result in users having to wait for their request to be processed.
So with just a few additional lines of configuration in our OpenTelemetry collector, we are able to bring these JMX metrics into Splunk Observability Cloud. They can be used on dashboards to visualize system performance, and can also be added to alert detectors to proactively notify us if something is wrong with our application.
This is great, but we also need to track the number of invocations received by our “Hello, JMX” endpoint, which is exposed as a custom MBean. We’ll see how to do this in the next section.
Using the JMX Metric Gatherer
To capture the number of invocations, we’re going to launch the JMX metric gatherer in a separate Docker container. We can remove the JMX receiver we added in the last section, as it’s not required for this deployment option.
The high-level architecture of this deployment option is shown in the following diagram.

In the diagram, we can see that:
- The JMX metric gatherer is deployed to a separate container and is configured with a custom groovy script.
- It pulls JMX metrics from the Tomcat server, then publishes them to the collector using OTLP.
- The metrics then flow through the collector pipeline as normal, before being exported to Splunk Observability Cloud.
- Start by creating a
session.propertiesfile to configure the JMX metric gatherer.otel.jmx.service.url = service:jmx:rmi:///jndi/rmi://tomcat-with-sample-app:1099/jmxrmi otel.jmx.target.system = jvm,tomcat otel.metric.export.interval = 60000 otel.jmx.remote.registry.ssl=false otel.metrics.exporter = otlp otel.exporter.otlp.endpoint = http://splunk-otel-collector:4317 otel.jmx.config = jmx-metrics-config.yaml
This file tells the JMX metric gatherer to:- Use the tomcat-with-sample-app endpoint with port 1099 to collect JMX data
- Pull JMX data at five second intervals
- Export the metric data using the OpenTelemetry protocol (OTLP) using the specified collector endpoint
- Next, define a
jmx-metrics-config.yamlfile to tell the JMX Metric Scraper which metrics to collect.--- rules: - bean: jmx-java-app:name=InvocationCountBean mapping: NumInvocations: metric: invocation.count type: counter desc: "The number of invocations" unit: "By"
This file tells the JMX Metric Scraper to load theInvocationCountBeanMBean, read theNumInvocationsattribute, and name the resulting metric asinvocation.count. - In the Dockerfile, you can see that the JMX Metric Scraper Java process is launched as follows:
java -jar
/opt/opentelemetry-jmx-scraper.jar -config session.properties
- Build the container and restart the application using Docker Compose.
- After the application is started, generate some traffic by hitting the http://localhost:8080/jmx-java-app/ endpoint with our browser.
- Return to Splunk Observability Cloud, navigate to the Metric Finder and search for the custom JMX metric named
invocation.count.
We can see that our five requests to the “Hello, JMX endpoint” are tracked via the invocation.count metric. While this is a simple example, the process of defining a custom YAML configuration file and bringing in the desired MBean attributes can be extended for real-world applications as needed.
Summary
In this article, we explained how JMX metrics can be ingested via OpenTelemetry into an observability backend such as Splunk Observability Cloud. We reviewed two options to achieve this:
- Using the JMX Receiver with the default target systems
- Using the JMX Metric Scraper with a custom YAML file
Next steps
Now that you’ve read the article, you have the information you need to start getting your own JMX metrics into Splunk Observability Cloud.
See Understand and use the Collector to install the Splunk Distribution of the OpenTelemetry Collector. Then refer to the JMX Receiver documentation for how to add this receiver to your collector configuration. Or if you’d like to customize the MBean attribute collection, refer to the JMX Metric Scraper documentation. For more help, feel free to ask a Splunk Expert.