Investigating and remediating alerts from web applications
In your organization, you need to ensure that the right teams involved with your web applications are handling incidents as planned and have the context they need to investigate and remediate issues. You also need to ensure that the workflow determines when operations are back to normal and resolves the incident automatically, which is an incident management best practice.
Solution
In this article, you'll see how SREs and web application service owners work together in a best practice incident management workflow to quickly move incidents from identification to resolution.
SREs are generally responsible for the health, performance, and availability of production applications. In this example, the SRE receives the alert notification that the online application they are responsible for has an issue. They then follow a number of steps to investigate the issue:
- Acknowledge incident
- Triage, troubleshoot, investigate, and collaborate
- Determine root cause
- Communicate findings and re-route incident to service owner
The service owner is accountable for the service from initiation through retirement, including all associated service offerings in that service's portfolio. The service owner follows a number of steps to remediate the issue:
Configuring the alert rule
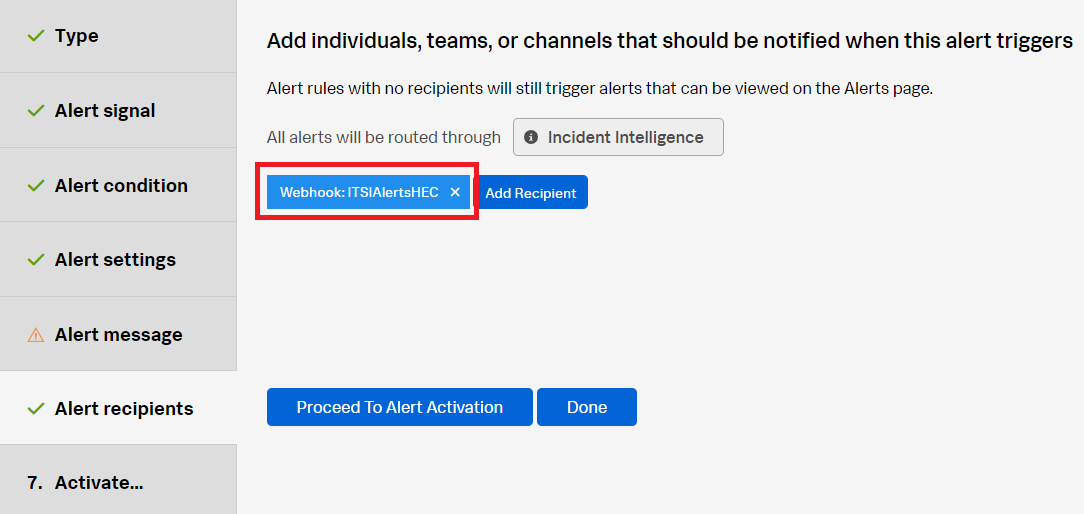
You can use any configured alert rule from a web application in Splunk Observability Cloud as the trigger for this workflow. You can find your alerts in the Alerts & Detectors section in the left navigation pane of Splunk Observability Cloud. In this example, an alert rule is configured in Splunk Observability Cloud to trigger when the online web application error rate over the last 5 minutes is above 30% across at least 10 requests.

Make sure that the alert rule is configured to send the alert to Splunk ITSI via a webhook.
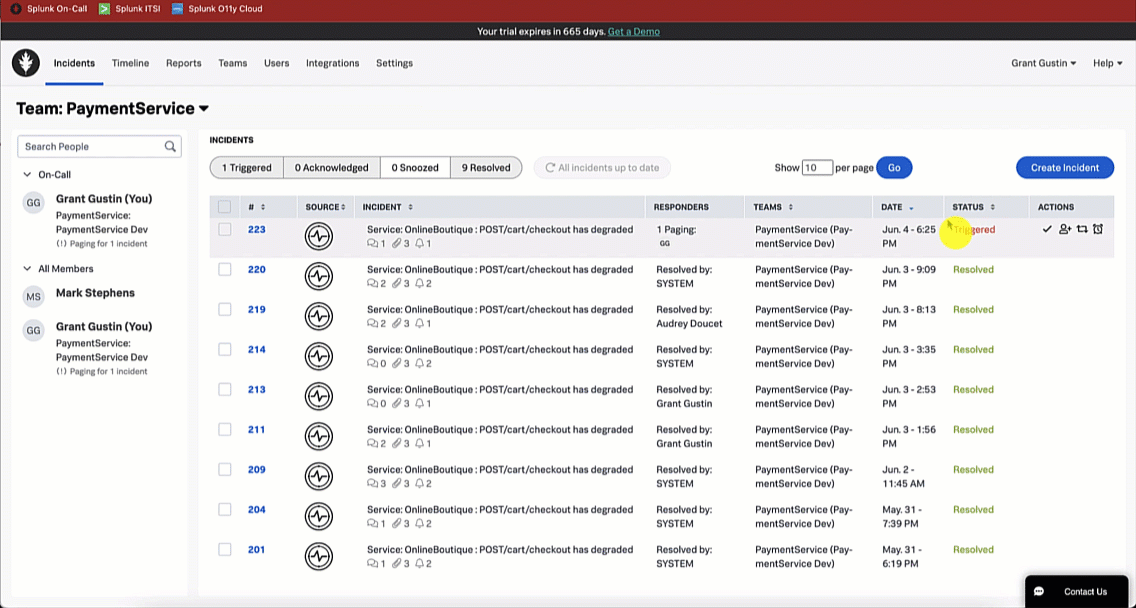
Confirming the alert is sent to Splunk ITSI and ITSI has created a Splunk On-Call incident
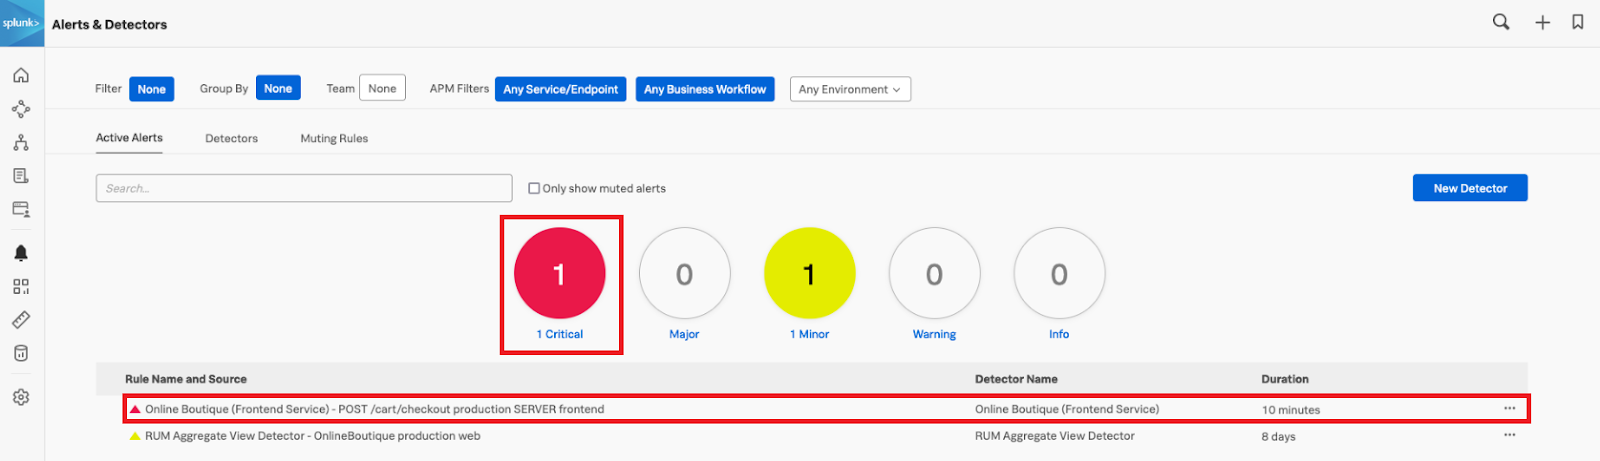
In the Alerts & Detectors section in the left navigation pane of Splunk Observability Cloud, you should be able to see the details of your alert. In this example, a critical alert has been triggered for the checkout service in the web application.
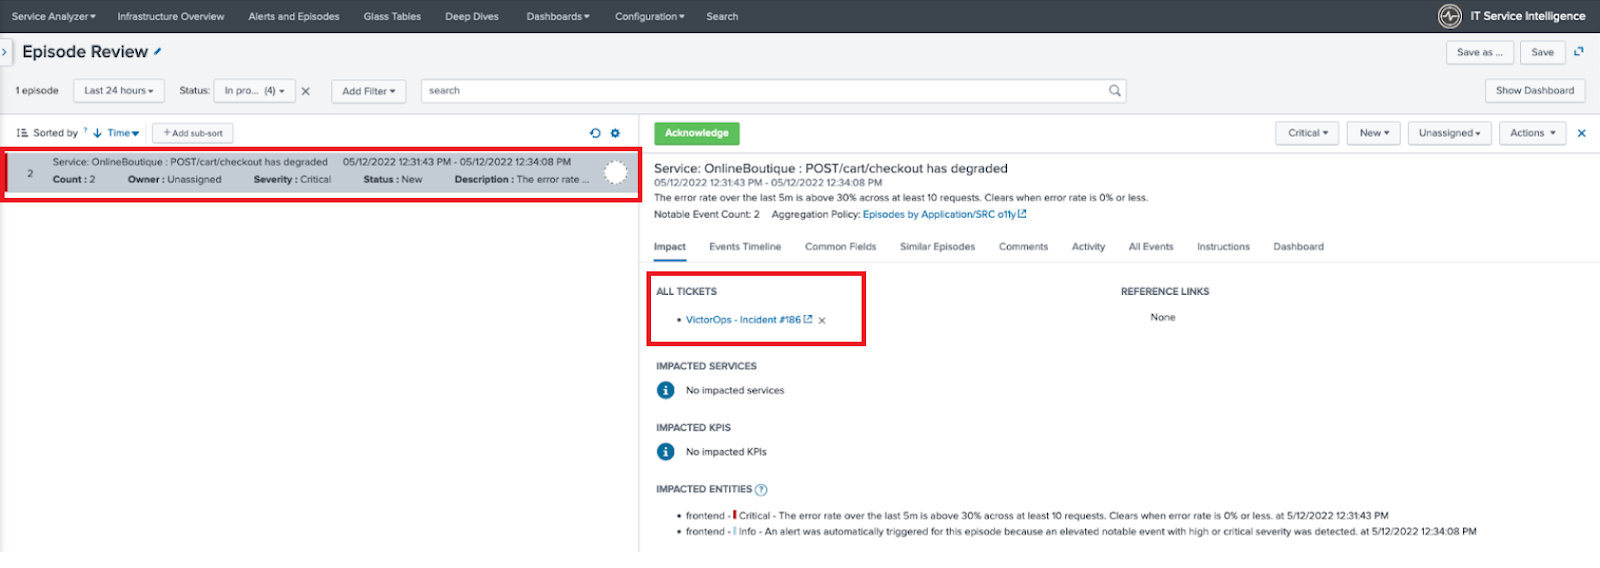
In Splunk ITSI Episode Review, you should be able to see the alert details passed through. In this example, Splunk ITSI has sent the alert to Splunk On-Call that's marked as VictorOps - Incident #186.
Investigating and remediating the alert
Role of the SRE
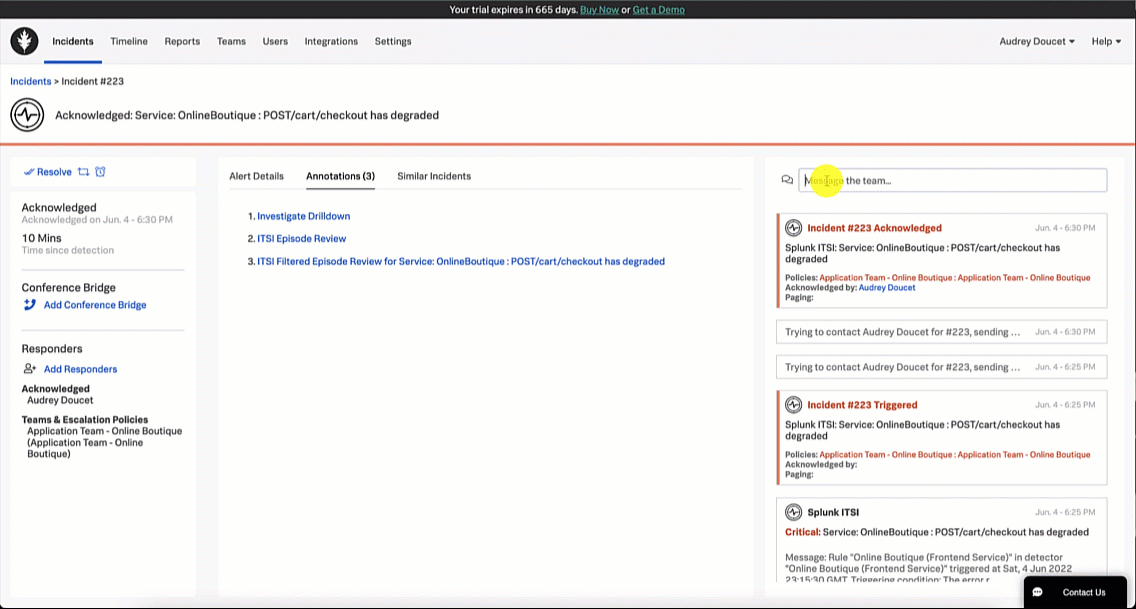
- SRE acknowledges incident.
This example shows the Splunk On-Call web application being used, but the process is the same for the mobile app. In Splunk On-Call, the SRE can take a number of different actions:
- Acknowledge: Take assignment of the incident to take action to resolve it.
- Re-route: Send the incident to another user or escalation policy.
- Snooze: Receive another notification from Splunk On-Call based on the selected snooze period. This is usually used when incidents are deemed not urgent.
- Resolve: Resolve the incident.
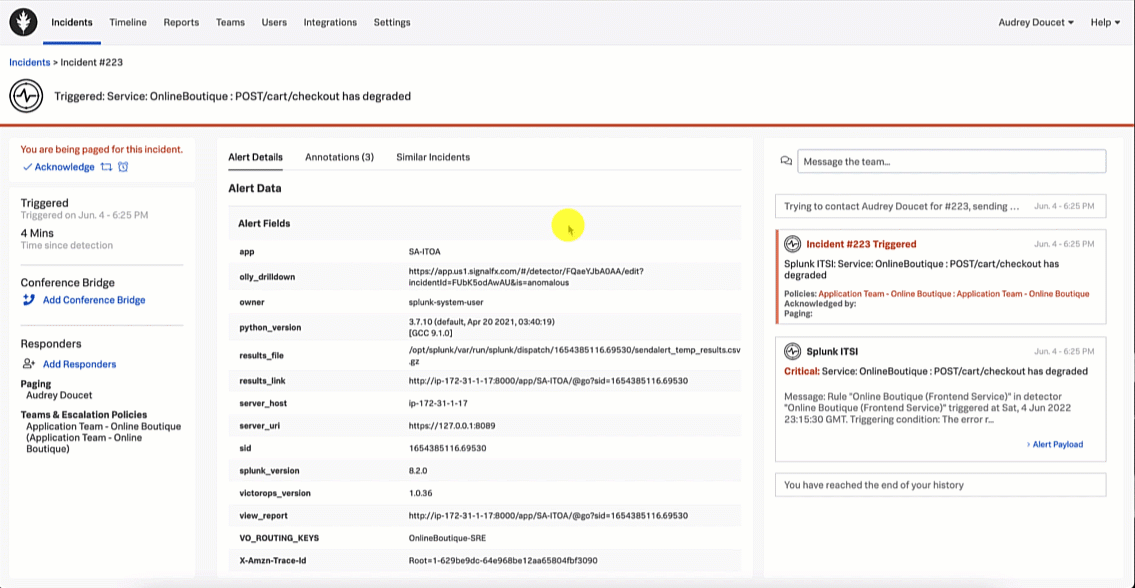
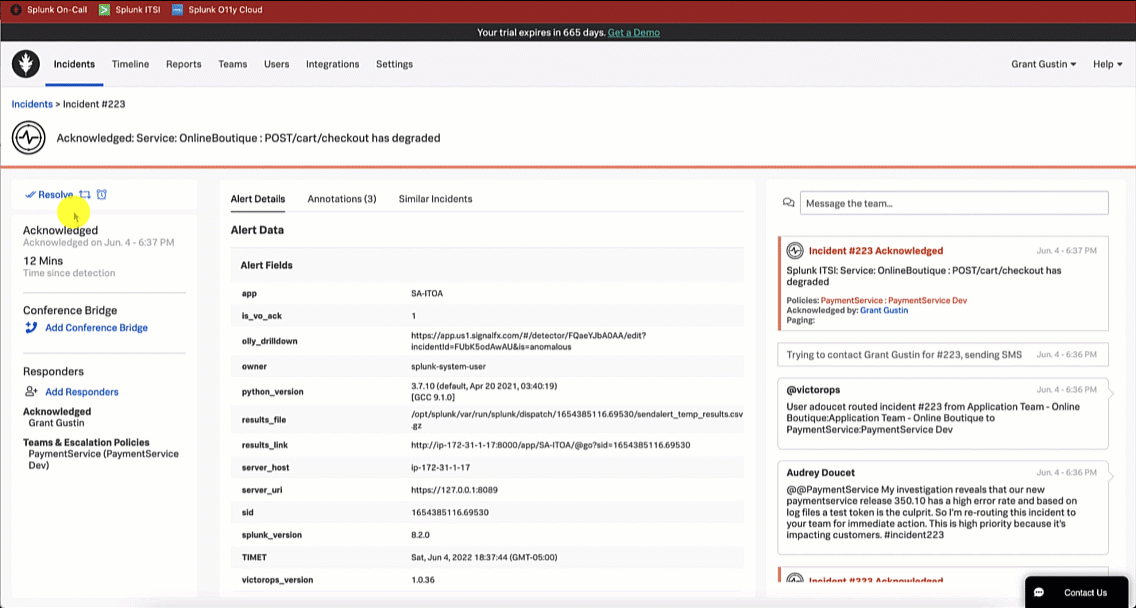
The SRE acknowledges the incident in Splunk On-Call so they can start to troubleshoot and triage.
- SRE triages, troubleshoots, investigates, and collaborates.
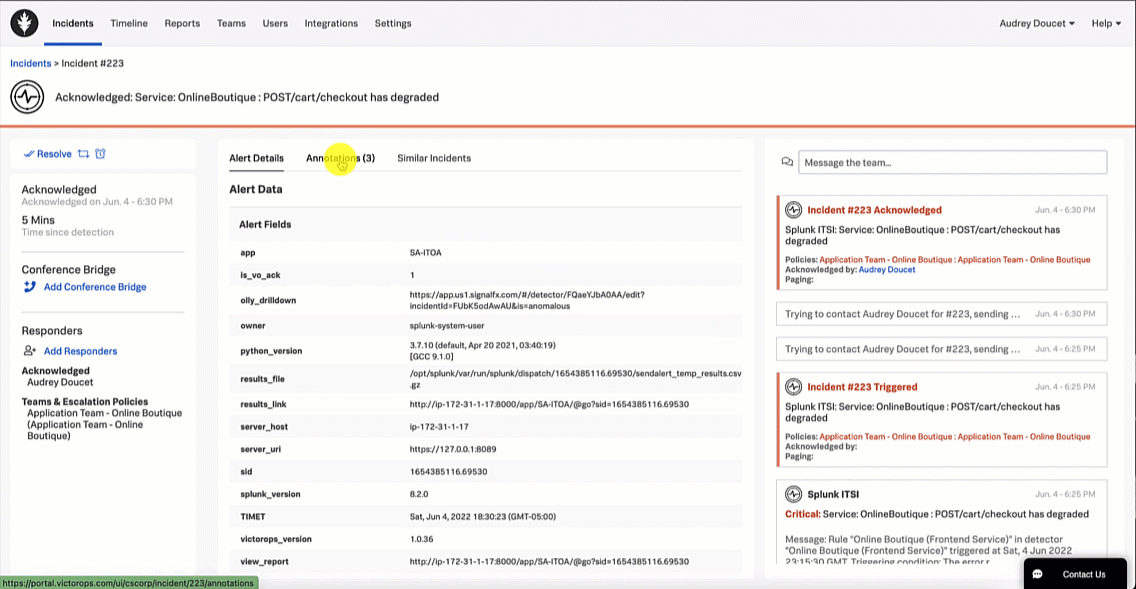
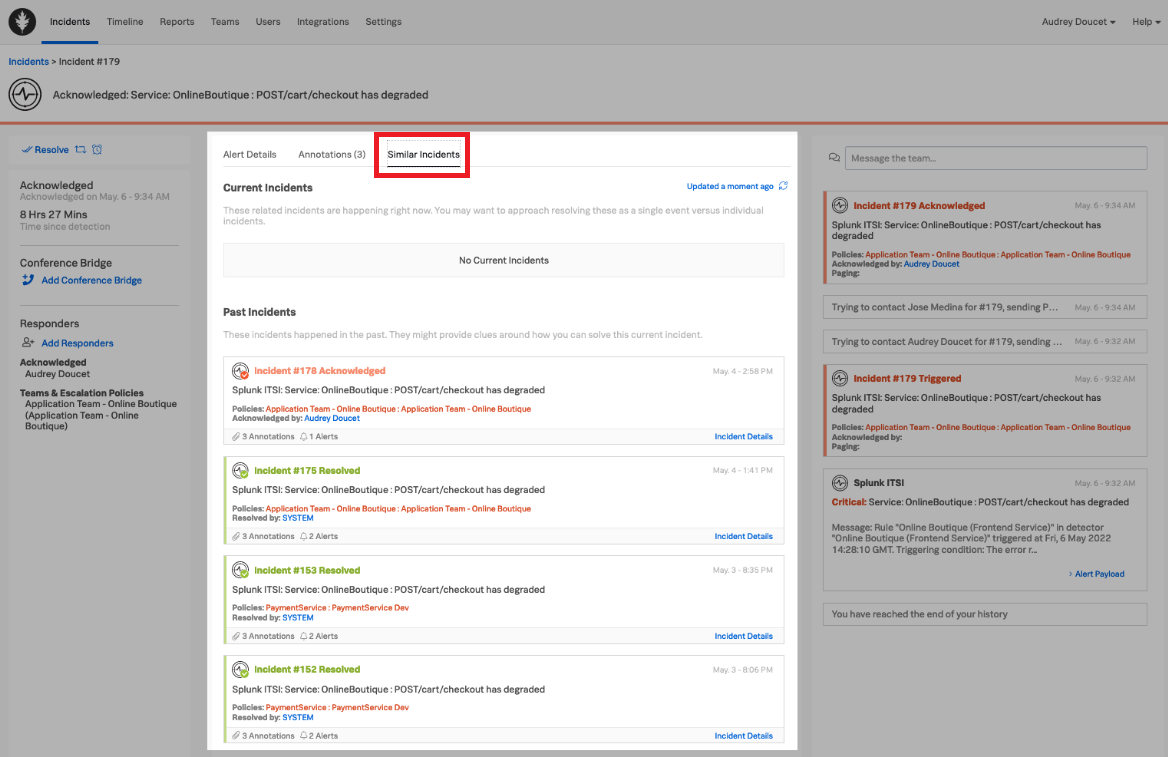
The SRE begins the incident investigation by reviewing any similar incidents to determine if similar incidents have occurred, which could provide some information on possible resolution of this incident. Similar incidents can be reviewed using the Similar Incidents tab in Splunk On-Call.
In this example, the SRE does not find any similar incidents, so they continue the investigation using the Splunk On-Call annotations feature by selecting the Annotations tab. The Annotations tab includes two out-of-the-box annotations, as well as a custom "Investigate Drilldown" annotation. The SRE clicks the Investigate Drilldown annotation to continue the incident investigation.
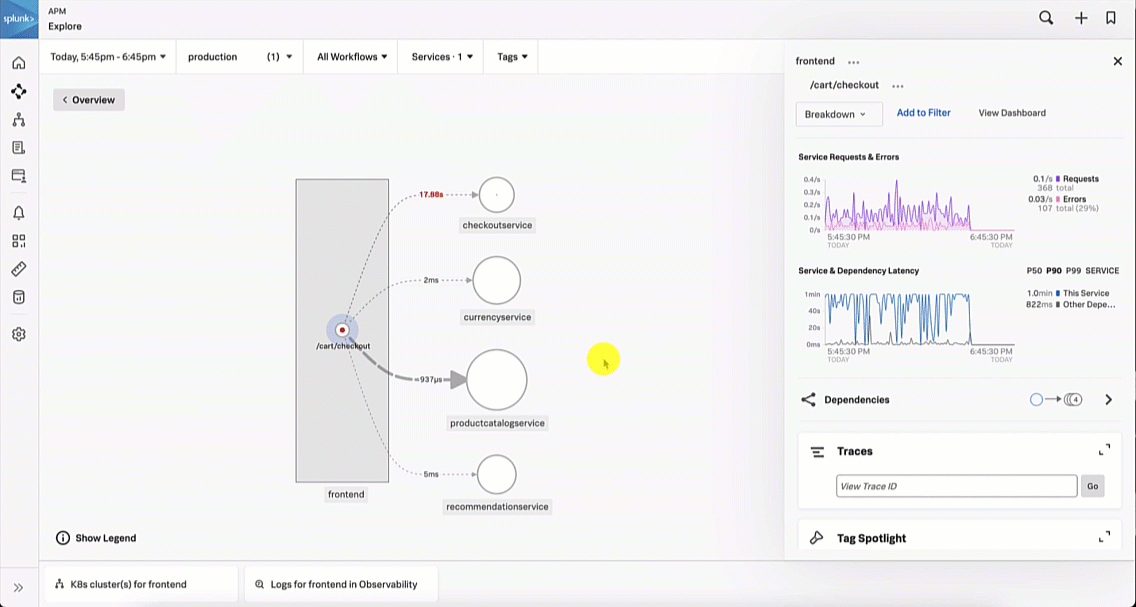
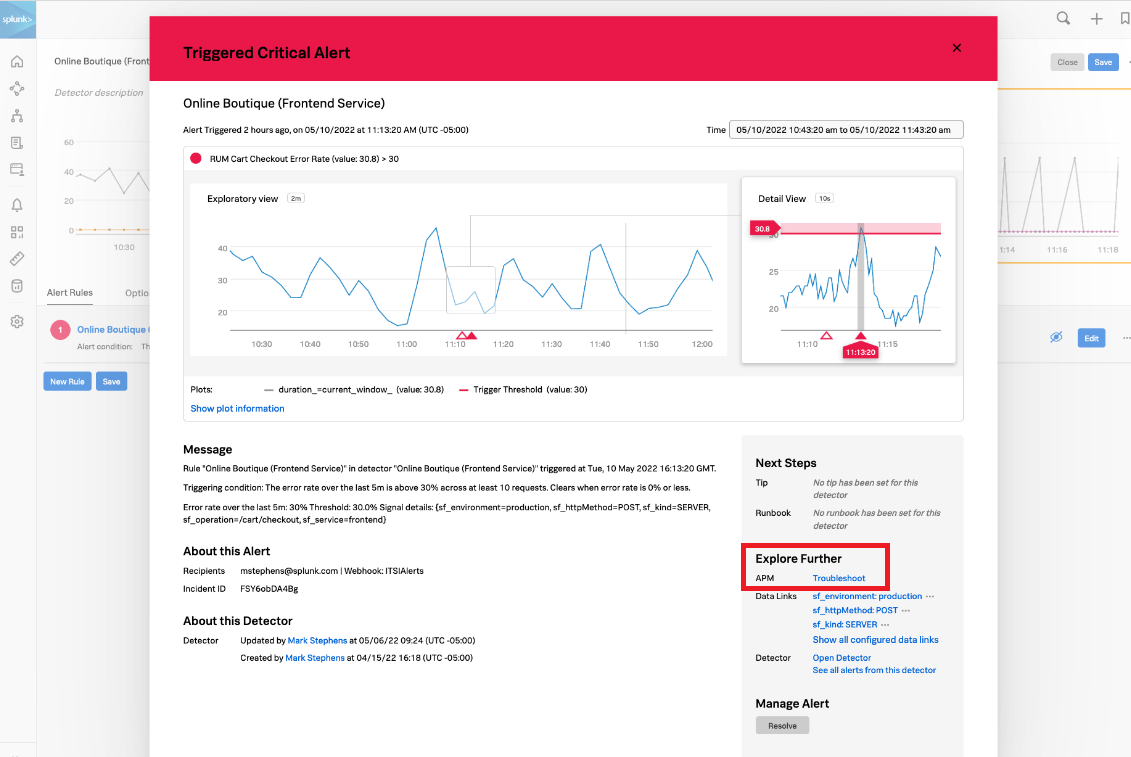
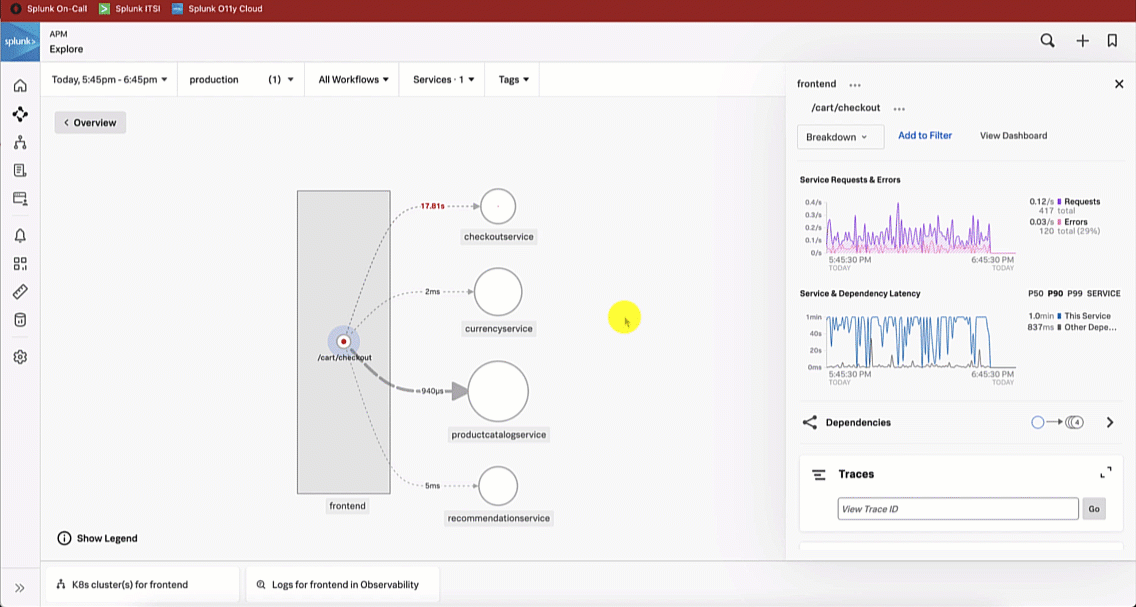
From here, the SRE clicks the APM Troubleshoot link in the Explore Further section to investigate further.
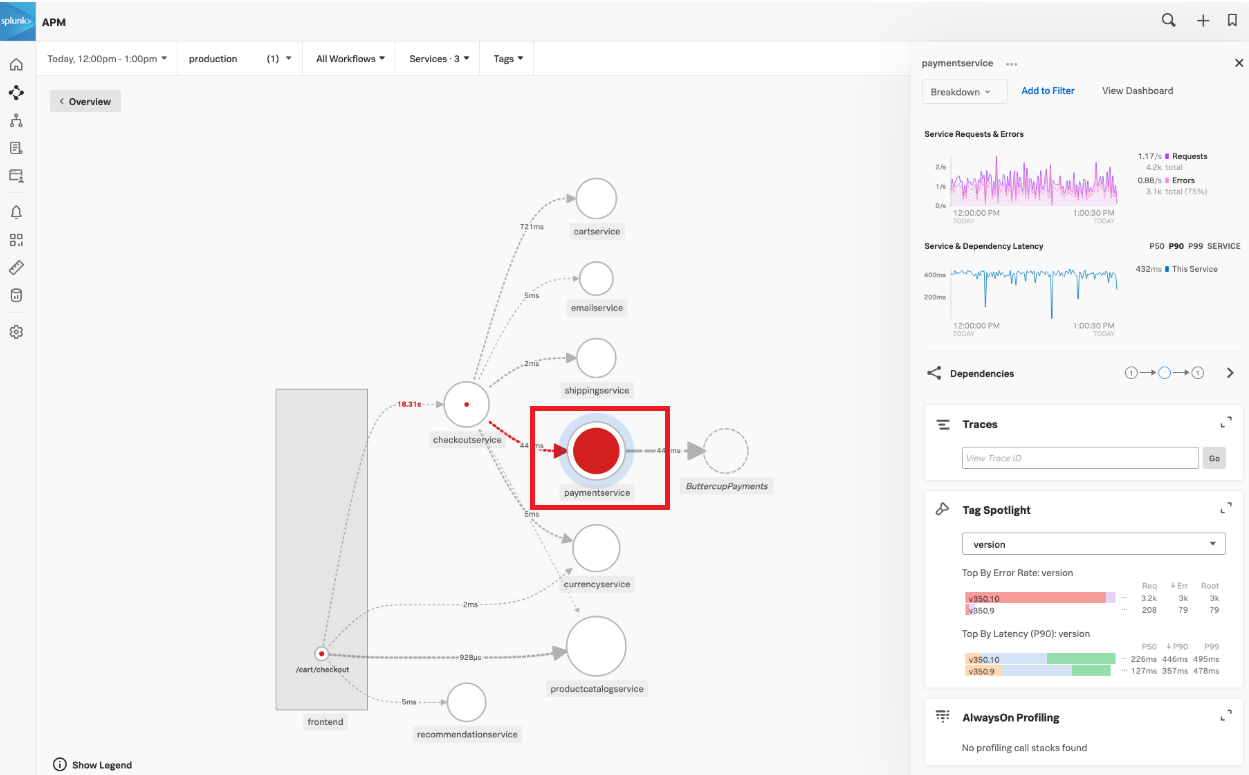
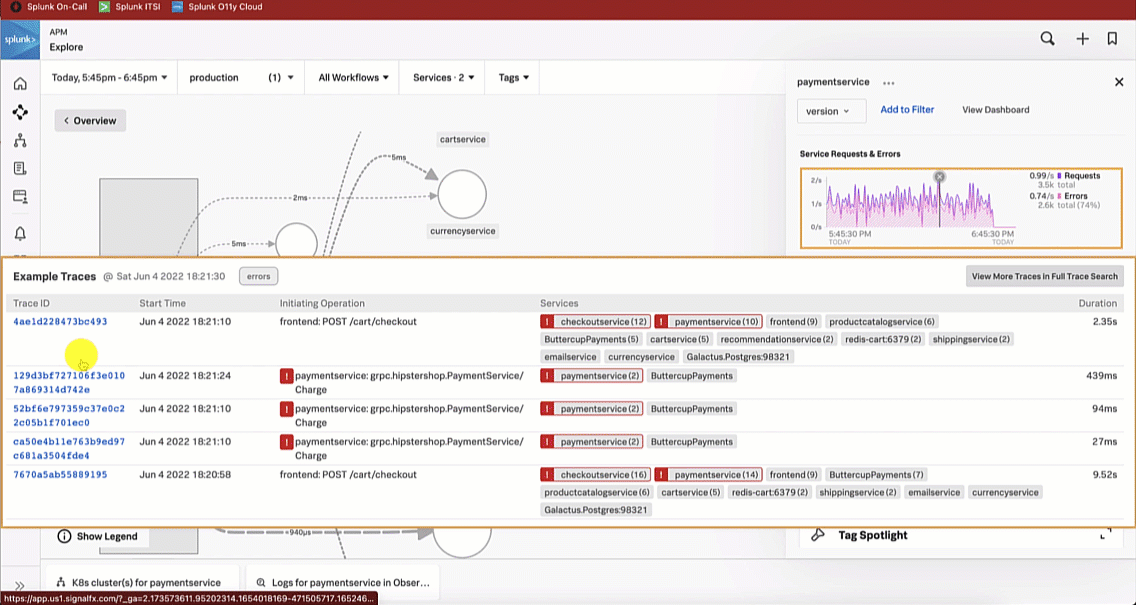
This brings the SRE to the Splunk Application Performance Monitoring site map. Reviewing the map, the SRE sees there is only one service that is showing an issue, as indicated by the red dot on checkoutservice. The SRE clicks checkoutservice to view the upstream and downstream dependencies.
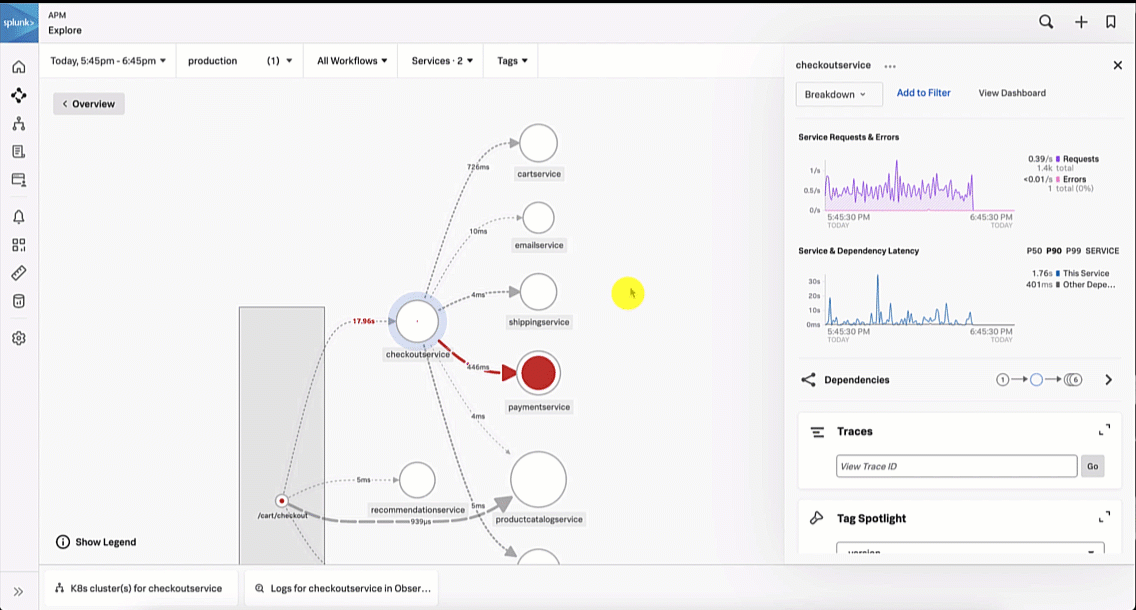
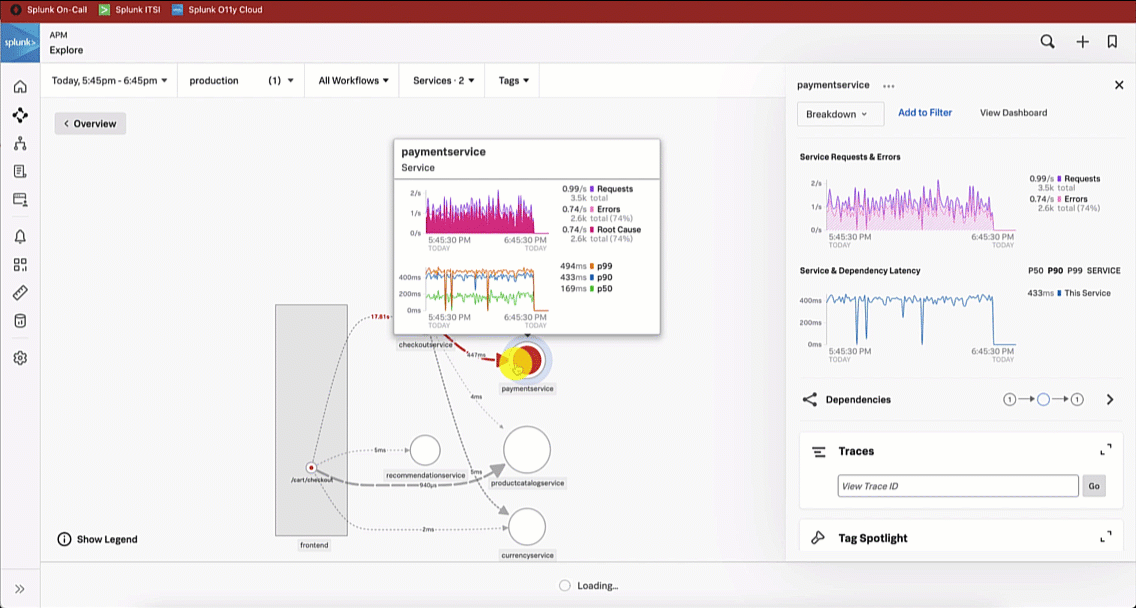
Viewing the dependencies on the next service map, the SRE sees the paymentservice is red, which means it's likely that it is the service causing the checkout issue.
- SRE determines root cause.
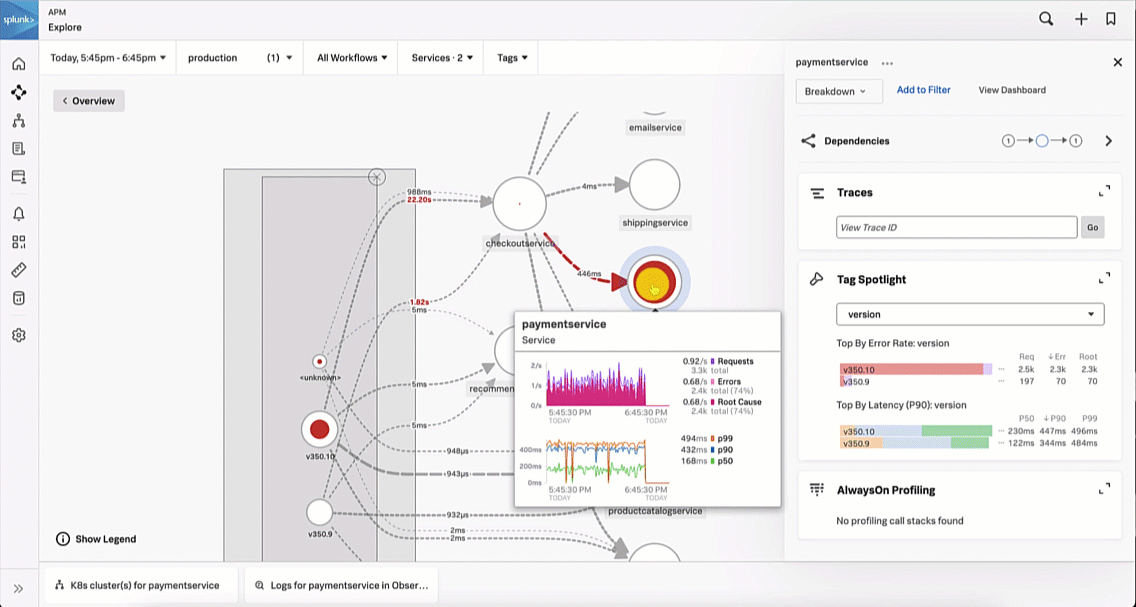
The SRE is aware that a new version of the paymentservice has recently been released. With this in mind, the SRE updates the service map visualization to view versions by clicking the Breakdown dropdown and selecting Version. It is obvious to the SRE that the latest version release has significantly more errors compared to the previous release, indicating there is a potential issue with this release.
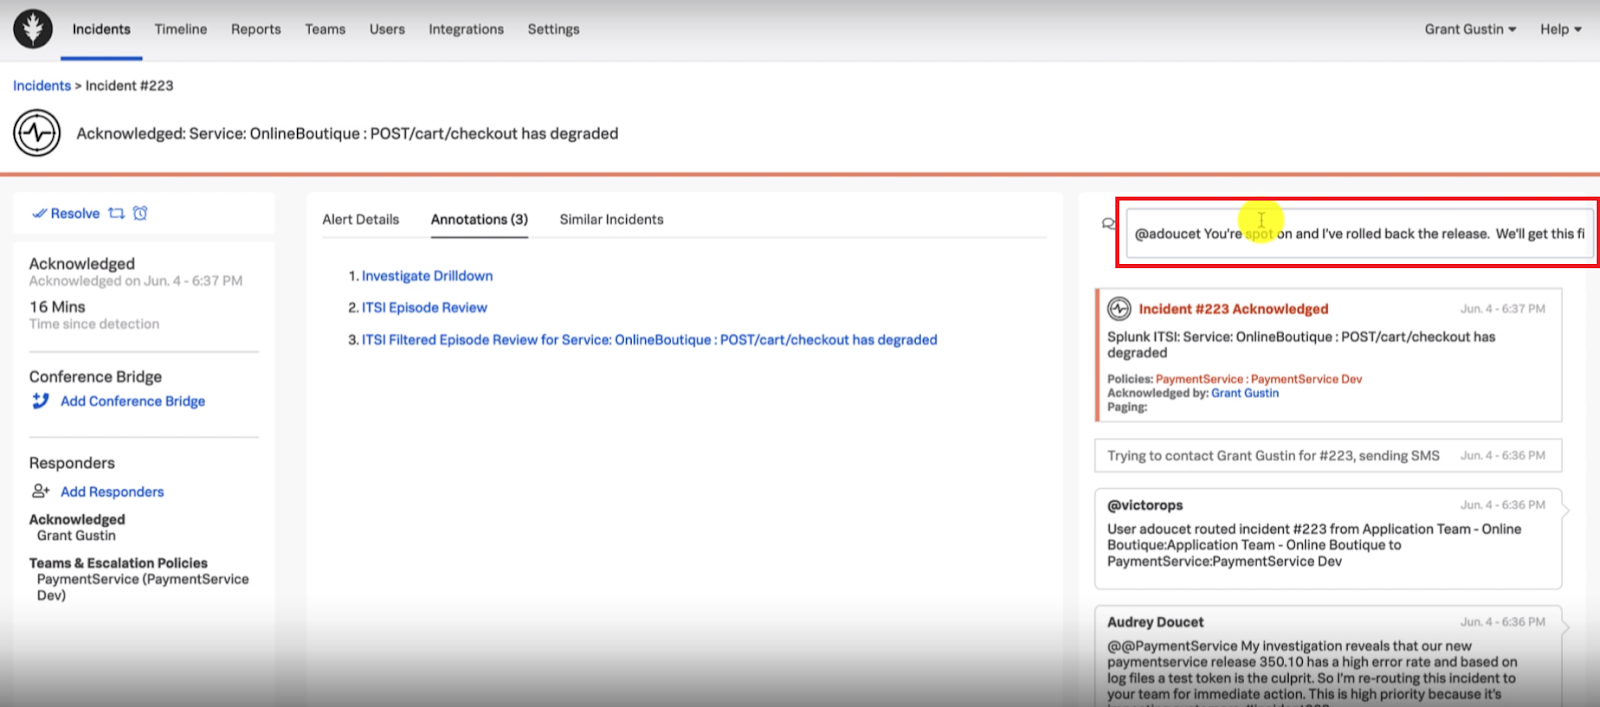
The SRE looks at the paymentservice logs in Splunk Log Observer to try to determine the root cause by clicking on Logs for paymentservice in Observability under the related content at the bottom of the screen. Looking at the log errors, the SRE notices there is an error due to an invalid API token, which appears to be due to a test token being used.
- SRE communicates findings and re-routes the incident to the service owner.
Based on the investigation, the SRE determines that the service owner needs to be notified of the incident to potentially roll back the release to restore the service. The SRE reopens Splunk On-Call and messages the paymentservice development team with an appropriate message letting them know the latest paymentservice release error logs indicate there is an invalid test API token causing service disruption. The SRE then reroutes the incident to that team.
Role of the service owner
- Service owner acknowledges the alert.
In this scenario, the service owner is the developer responsible for the paymentservice code development and release.
Using the Splunk On-Call web portal, the service owner notices a triggered incident in their incident queue. They acknowledge the incident by clicking the triggered incident and clicking Acknowledge.
- Service owner triages, troubleshoots, investigates, and resolves.
Following a similar path as the SRE, the service owner begins their investigation by clicking the Investigate Drilldown annotation which takes them to the alert in Splunk Observability Cloud. In the Explore Further section of the alert, the developer clicks APM Troubleshoot to view the checkoutservice service map.
Reviewing the map, the service owner sees the same issue that the SRE noticed - that the paymentservice is likely the service causing the checkout issue.
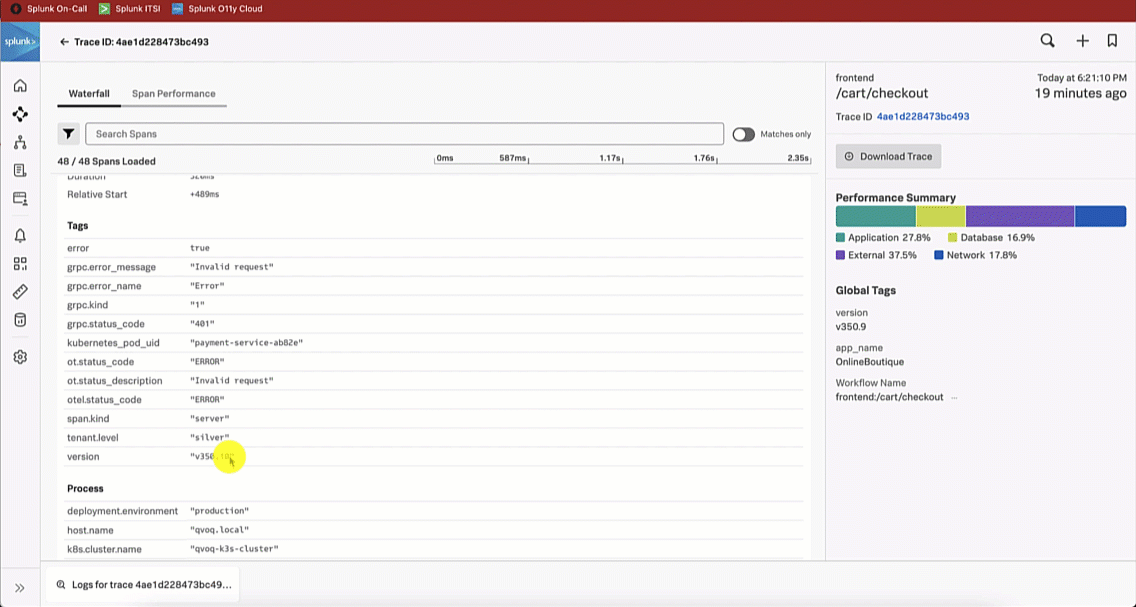
Like the SRE did, the service owner updates the service map visualization to version and sees there are significantly more errors for the latest version release. The service owner investigates further by selecting a trace to review in more detail.
The service owner reviews the spans by selecting a paymentservice span with an error, which indicates the latest version release has a 401 error condition.
The Service Owner troubleshoots further by reviewing the paymentservice logs in Splunk Log Observer. Reviewing the log errors, like the SRE, they notice there is an error due to an invalid API token, which seems to be due to a test token being used.
The service owner responds with a message to the SRE in Splunk On-Call letting them know that their investigation was accurate, and that they are rolling back the version to restore service until the token error is fixed.
- Service owner allows incident to auto-resolve.
Allowing the system to determine when operations are back to normal is an incident management best practice. In this scenario, neither the SRE or the service owner manually resolves the incident. Instead, the system uses the framework within the Content Pack for ITSI Monitoring and Alerting to auto-resolve the incident. After all alerts for the episode have cleared, the episode is closed, and the Splunk On-Call incident is auto-resolved.
In Managing the lifecycle of an alert: from detection to remediation, the step Configuring the ITSI Notable Event Aggregation Policy (NEAP) shows you how to set up this part of the process. You can check that the auto-resolve has occurred through checking both Splunk ITSI and Splunk On-Call.
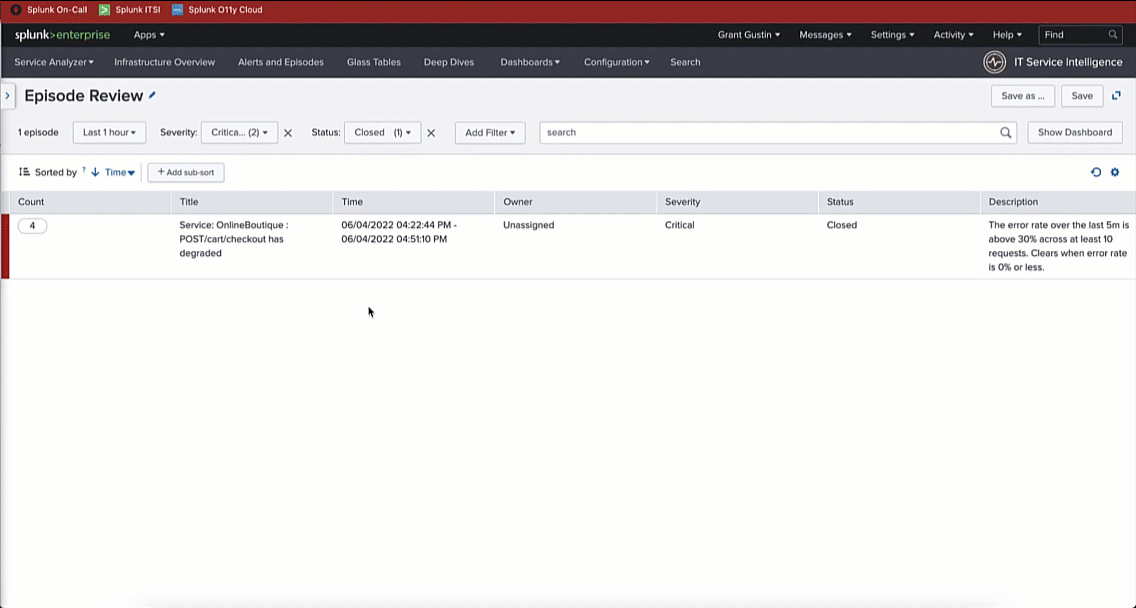
In this example, in Splunk ITSI, filtering on Severity: Critical with a Status: Closed, you can see the checkout service incident has closed. Clicking into the incident, you can see it is associated with the Splunk On-Call incident ticket #223. Then, filtering on the Events Timeline, you can see a second alert that closes the episode and the incident.
In Splunk On-Call you can see that incident #223 has been resolved by the system with a status of Resolved.

Next steps
This incident management configuration and design framework helps drive operational excellence and value through significant improvements in mean time to detect (MTTD) and mean time to respond (MTTR) to the incidents that can cause you significant operational issues.
Still having trouble? Splunk has many resources available to help get you back on track.
- Splunk Answers: Ask your question to the Splunk Community, which has provided over 50,000 user solutions to date.
- Splunk Customer Support: Contact Splunk to discuss your environment and receive customer support.
- Splunk Observability Training Courses: Comprehensive Splunk training to fully unlock the power of Splunk Observability Cloud.