Sending events and fields between Splunk platform and Splunk Observability Cloud
Your organization uses Splunk software widely, with your security teams working in Splunk platform and your development teams working in Splunk Observability Cloud. You need to ensure that you can pass context from events that concern your security teams to your development teams, who can then make changes and address those events.
However, developers generally do not have access to the indexes used by security teams. Instead, developers use Splunk Observability Cloud for their metrics, traces, and logs. Notifying them of events can involve a series of meetings and discussion that can take days or weeks to filter down from security event to developer awareness. You have tried email alerts, but these can too easily be ignored or filtered to an unchecked inbox folder.
This problem affects the following types of situations:
- Your code vulnerability scans of internal repositories are turning up new vulnerabilities. You need to notify the developers who own those repos.
- A failure in your firewall settings has been detected and is degrading the network. You need to notify users in all of your other monitoring tools.
- Critical business processes you track in Splunk ITSI are failing. You need to get this information in front of the developers who write the software involved.
- You want to see software deployments for services you care about overlaid on your Splunk Observability Cloud dashboards, but you track those in Splunk platform.
You need a more streamlined process that provides a record of when events occur, and makes them visible to developers and SREs in their own tools.
Sending events from Splunk platform to Splunk Observability Cloud
You can streamline the process of passing the context of events in Splunk platform to Splunk Observability Cloud with the Splunk Observability Cloud Alert Action for Splunk, which you can download for free from Splunkbase.
Splunk software uses events to help pass context with minimal overhead. Splunk Cloud Platform and Splunk Enterprise generally use log events as their basic building blocks. Splunk Observability Cloud uses events as the output of detectors. Events are also a useful means of passing non-timeseries related context to users outside of alerts. They help you understand point-in-time occurrences, integrate seamlessly into Splunk Observability Cloud dashboards, and there are no associated charges with events.
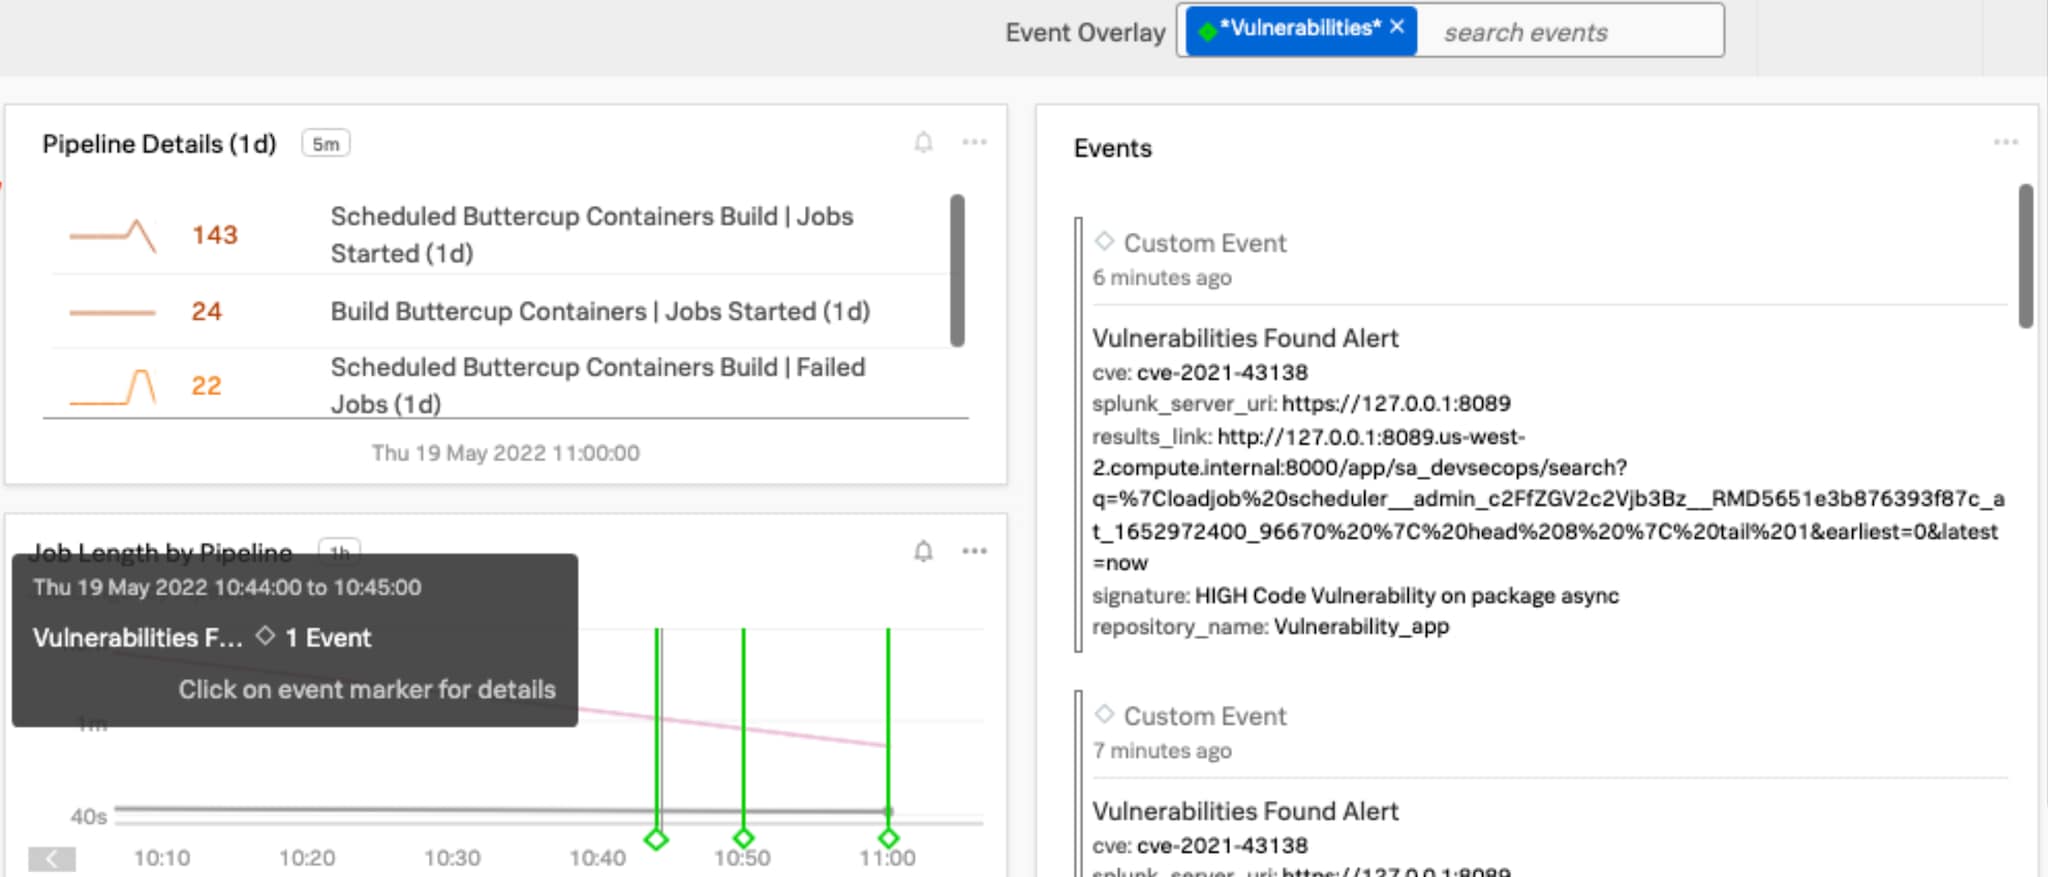
When you pass the context of events in Splunk platform to Splunk Observability Cloud with the Splunk Observability Cloud Alert Action for Splunk, Splunk Observability Events can be overlaid on the dashboards developers use most, notifying them about interesting or important events.
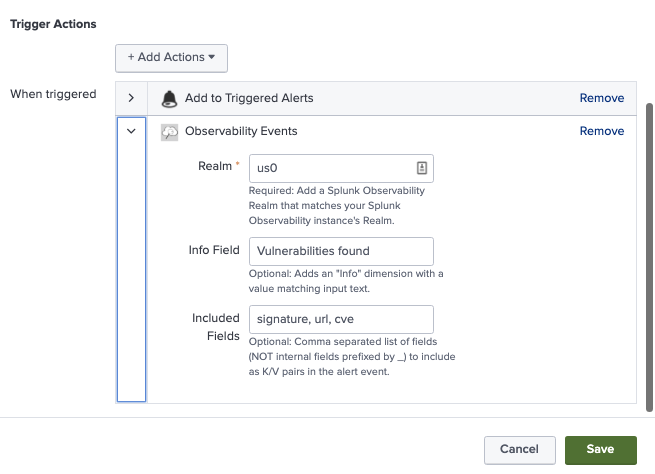
You can set up the alert action in Splunk platform the way you’d set up any other alert. Choose the fields you’d like to pass as context to Splunk Observability Cloud, and watch the event context move between your tools.


Sending events from Splunk Observability Cloud to Splunk platform
If you need data and context to be sent back into Splunk platform from Splunk Observability Cloud, you can do this by Setting up Splunk HEC (with SSL) and getting a Splunk HEC token. Then set up a Webhook integration in Splunk Observability to send to your HEC’s collector/raw endpoint.
For a more customizable process for sending Splunk Observability Cloud alert data into Splunk ITSI using AWS Lambda, check Integrating Splunk Observability Cloud alerts with ITSI.
After it's set up, your Splunk Observability Cloud webhook can be added to a detector as a notification method, and it will send those alerts into Splunk Enterprise or Splunk Cloud Platform. This pattern can be useful when using Splunk platform or Splunk ITSI as a “monitor of monitors”.
Next steps
The content in this article comes from a previously published blog, one of the thousands of Splunk resources available to help users succeed. In addition, these resources might help you understand and implement this guidance:

