Integrating Kubernetes and Splunk Observability Cloud
End-to-end insight into your application environments means you can confidently ensure everything is up and running so that your customers stay happy. You'll need to be able to monitor, troubleshoot, anticipate, and detect issues. You'll need to do that intuitively, quickly, and efficiently so that when problems arise, time to resolution is as short as possible. There are plenty of solutions out there, but in this article, we’re going to learn how to quickly and easily integrate and configure your Kubernetes application with Splunk Observability Cloud using the Splunk Distribution of the OpenTelemetry Collector for Kubernetes.
Data required
How to use Splunk software for this use case
Log into your account and integrate data
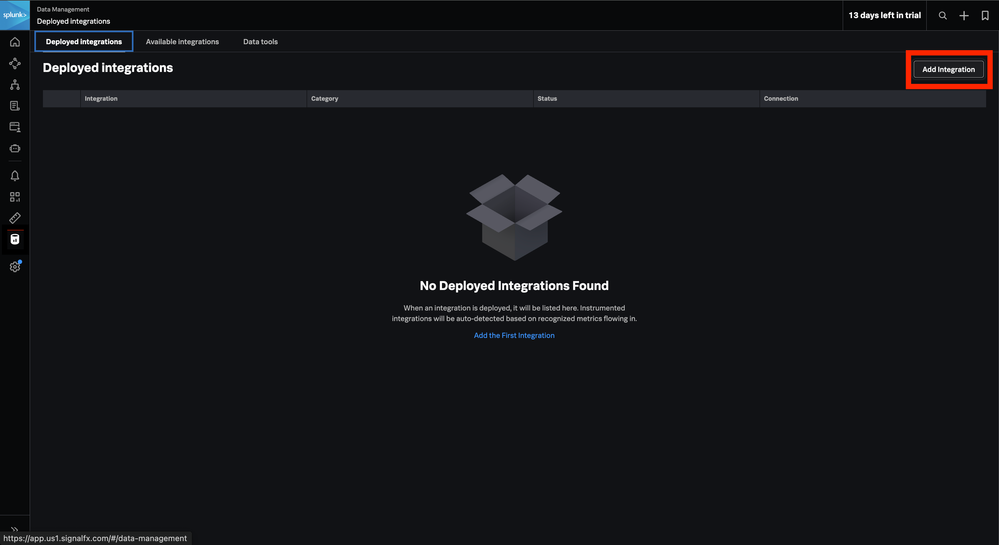
First, log into your Splunk Observability Cloud account. From the home page, open up the Data Management section on the left toolbar.

Select Add Integration, located at the top right of the screen.
This takes you to the Available integrations screen where you can deploy the Splunk Distribution of the OpenTelemetry Collector, select one of the other supported integrations, or follow the Guided Onboarding process located at the top right of the screen. If you don’t have an application ready to integrate, the Guided Onboarding process allows you to try out Splunk Observability Cloud with an existing sample application.

In this example, we already have an application ready, so we’re going to scroll down to the Platforms section and select the Kubernetes integration wizard. The wizard guides you through setting up the Splunk OpenTelemetry Collector for Kubernetes. At the end of this process, we’ll have a deployed OpenTelemetry Collector that collects metrics, traces, and logs.
As stated in the wizard description, the Splunk Distribution of the OpenTelemetry Collector for Kubernetes is packed in a container and deployed as a DaemonSet on each node in your Kubernetes cluster.
Walking through the steps in the installation wizard, we’ll fill out Install Configuration.

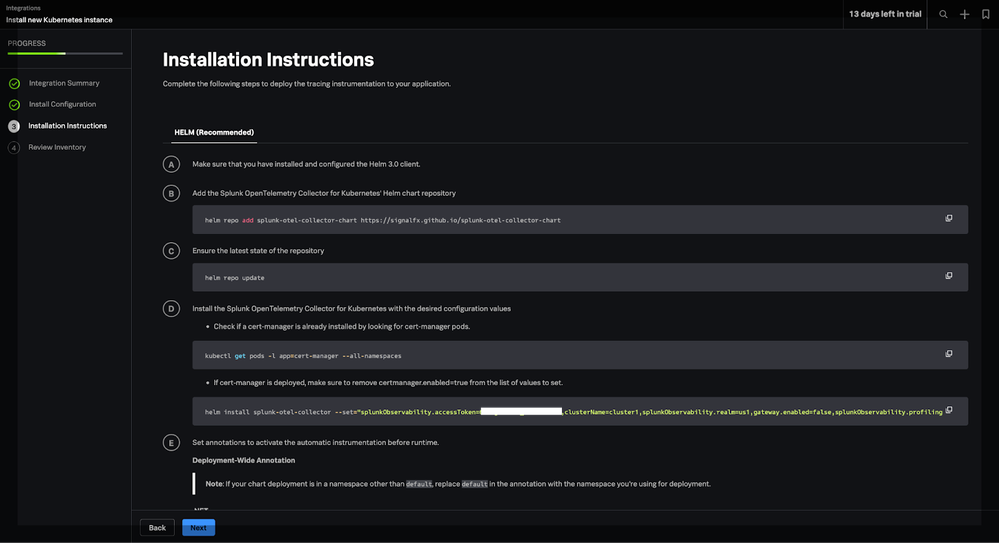
Moving to the next step, we’ll use Helm (3.x) to install the Collector following the steps in the Installation Instructions.
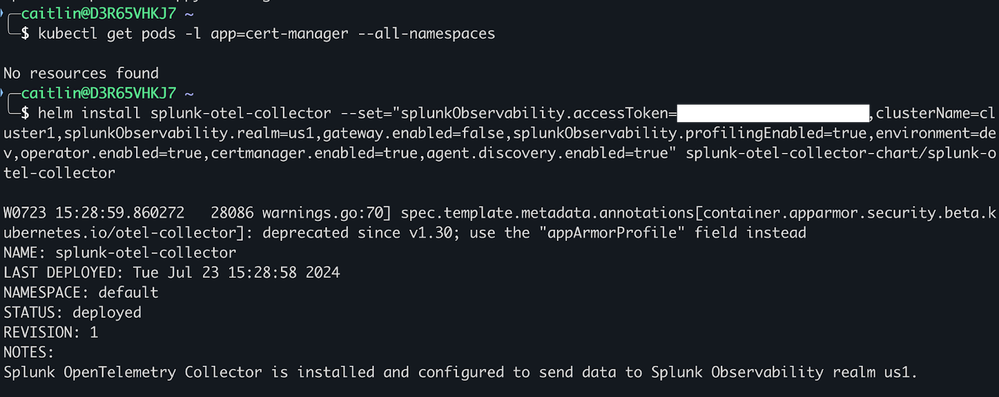
The output from the kubectl get pods and the helm install splunk-otel-collector commands should look something like this.
Also in this step, you can optionally add annotations to enable auto-instrumentation following the steps in the setup wizard.
Now, data from your Kubernetes cluster will be flowing into Splunk Observability Cloud:

Selecting Explore Metric Data takes you into the Kubernetes Navigator so you can start interacting with your data.
Underlying mechanisms of the integration
When you install the Splunk Distribution of the OpenTelemetry Collector for Kubernetes, an agent component is deployed on each node within your Kubernetes cluster. Automatic discovery and configuration automatically finds the supported applications running in your Kubernetes environments, collects telemetry data from them, and sends the data to the Collector. The Collector then processes the telemetry and forwards it to Splunk Observability Cloud.
Configuration process and timing
In this example, we installed the Collector using a Helm chart and set values in our OTel configuration file when we ran the helm install command. These configurations included the Splunk access token, realm, environment, and cluster name. These parameters are defined in the Chart's values.yaml file and are used to dynamically generate Kubernetes manifests (found in the rendered_manifests directory) for the Collector across the cluster.
All configurable parameters are listed in the values.yaml file. You can modify these values during the initial Helm installation, after installation using the helm upgrade command, or by directly updating the values.yaml file and redeploying the Helm chart. For example, the following command updates the gateway.enabled value to true and splunkObservability.profilingEnabled to false.

When using the helm upgrade --set command, you'll need to provide all previously set values in addition to any new or updated parameters. This requirement ensures that the entire configuration including values like access token, realm, and cluster name are preserved during the upgrade. If you’re configuring a long list of values, consider setting the parameters directly in the values.yaml file or using your shell history to append and update parameters.
Next steps
These resources might help you understand and implement this guidance:
- Splunk YouTube: Helm install the Splunk Distribution of the OTel Collector in your K8s cluster
- Splunk Help: Getting started with the Splunk Distribution of the OpenTelemetry Collector
- Splunk Help: Collect Kubernetes data docs
- Splunk GitHub: Splunk OpenTelemetry Collector for Kubernetes