Optimizing application, service and memory usage with AlwaysOn Profiling for Splunk APM
Your organization wants to improve the overall quality of services delivered by optimizing service code performance and resource consumption. They want to be more proactive by introducing process and governance into their DevOps Software Development Lifecycle (SDL) to support this initiative.
Your application consumes many microservices to run the online sales portal. The Engineering team has introduced a process through which SREs can identify opportunities for code optimization. Employees have started noticing that a critical service called ‘adservice’ has experienced some performance degradations that adversely impact customer experience on the portal. They also see some trending performance degradations over time that do not impact customers currently or breach their SLA, but the SREs believe proactive code optimization might be beneficial.
Overall, your company’s goals are:
- For SREs to easily identify possible code-based performance bottlenecks, and submit a code optimization ticket with an attached flame graph call stack export. Developers can use that export to hone in on bottlenecks in code.
- For software developers to effectively and efficiently use outputs from flame graph analysis to navigate and identify code inefficiencies, leading to code optimization, improved performance, and developer productivity.
How to use Splunk software for this use case
AlwaysOn Profiling for Splunk Application Performance Monitoring can help you optimize application and service performance (CPU profiling) and memory usage optimization (memory profiling). AlwaysOn Profiling works by periodically taking call stacks from a runtime environment for analysis. Splunk Application Performance Monitoring provides the workflow and visualizations so you can quickly isolate and remediate service performance bottlenecks or high memory utilization. This drives service quality improvements back to the business and increases developer productivity.
The primary user persona for profiling is the service developer responsible for writing new code, troubleshooting latency, and optimizing performance and resource consumption of their code. However, other personas, such as SREs, can use the Splunk Application Performance Monitoring profiling visualizations to identify operational degradations that they can share with developers. Developers can then explore opportunities to optimize their code to improve application performance and availability.
In this scenario, the SRE needs to:
- ► Create an APM detector and a new alert rule for memory consumption
-
- In Splunk Observability Cloud, click Alerts & Detectors in the left navigation pane.
- Click New Detector.
- Enter an appropriate name for the detector. In this example, the detector is named K8s Pod Memory Consumption.
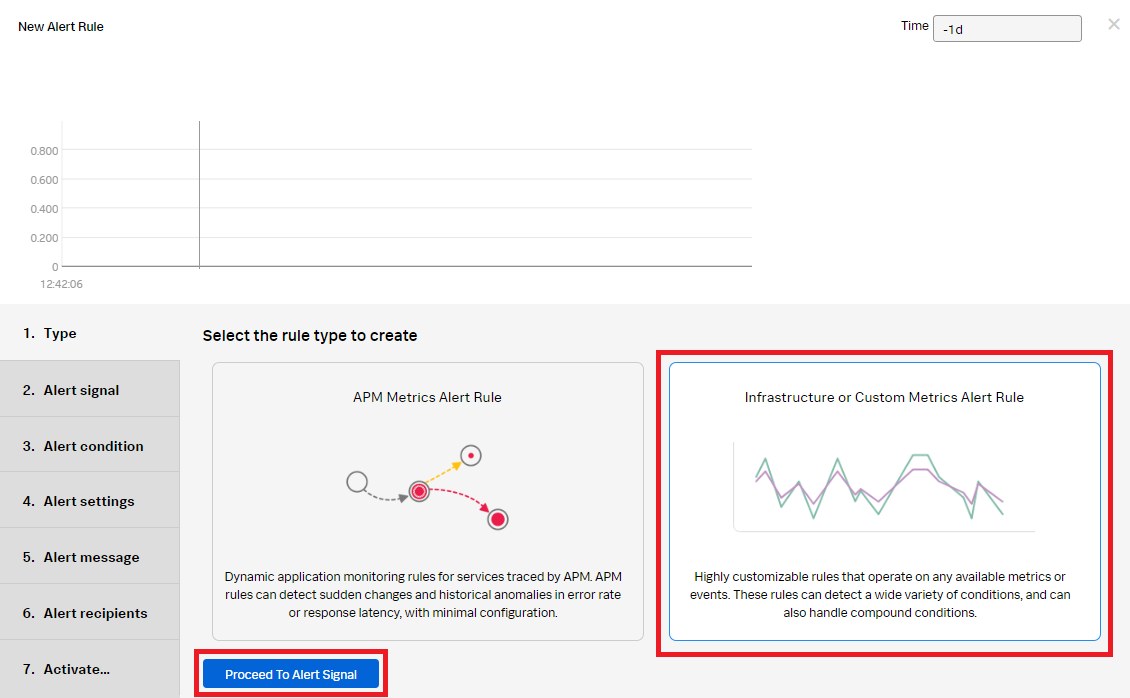
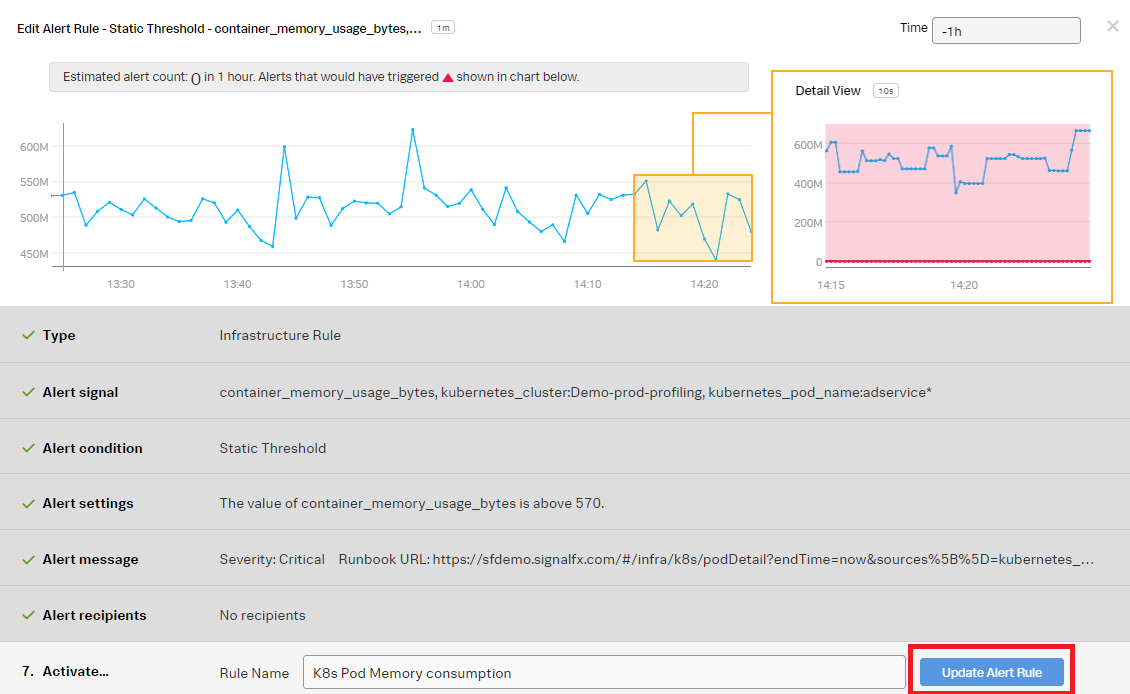
- Now you'll start to create the kubernetes pod memory consumption alert rule. In the alert rule Type, click Infrastructure or Custom Metrics Alert Rule and then click Proceed to Alert Signal.
- In the Alert Signal section:
- Add the "container_memory_usage_bytes" metric for Plot A.
- Click Add Filter and add "kubernetes_cluster.Demo-prod-profiling".
- Click the blue + and add "kubernetes_pod_name:adservice".
- Click Proceed To Alert Condition.
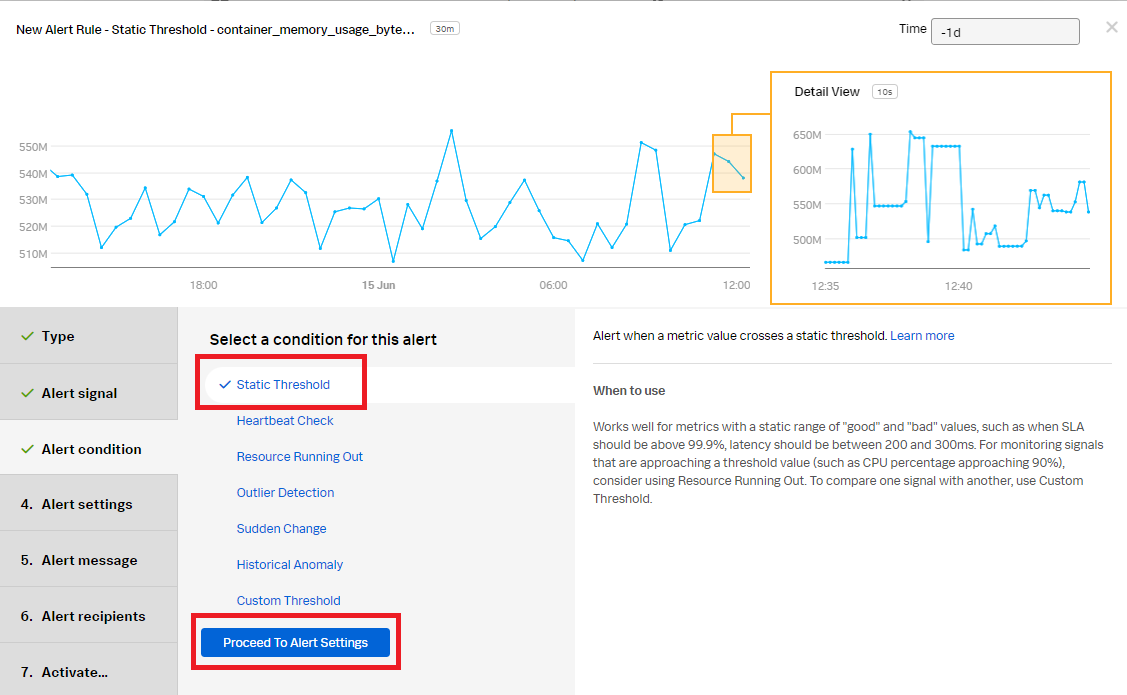
- In the Alert Condition section, select Static Threshold, then click Proceed To Alert Settings.
- In the Alert Settings section:
- Select Above for Alert when.
- Enter 570 for the Threshold.
- Select Immediately for Trigger sensitivity.
- Click Proceed To Alert Message.
- In the Alert Message section:
- Set the alert Severity. You can choose from Critical, Major, Minor, Warning, or Info, depending on how you perceive the alert severity.
- Optionally, enter a runbook or dashboard URL. To help the end user troubleshooting the alert, you can add a Tip to "Please check AlwaysOn Profiling for this service".
- Customize the message, if appropriate, by selecting Customize.
- Click Proceed to Alert Recipients.
- In the Alert Recipients section, select the recipient(s) to send the alert message to. You can choose an email address, team, or webhook. Click Proceed to Alert Activation.
- Click Update Alert Rule.
- ► Create a new alert rule for memory historical anomaly detection
-
- In the kubernetes pod memory consumption detector, click New Rule.
- In Type, select Infrastructure or Custom Metrics Alert Rule, then click Proceed to Alert Signal.
- In the Alert signal section, use the default K8s Pod Memory Consumption Detector signals, then click Proceed To Alert Condition.
- In the Alert condition section, select Historical Anomaly to alert when the signal is different from the same period in the past, then click Proceed To Alert Settings.
- In the Alert settings section, select Custom for Trigger Sensitivity. Then set the following fields:
- Current window: 20m
- Normal based on: Mean plus percent change
- Trigger threshold: 25%
- Clear threshold: 10%
- Ignore historical extremes: Yes
- Click Proceed To Alert Message.
- In the Alert message section:
- Set the alert severity. You can set it to Critical, Major, Minor, Warning, or Info depending on the alert severity defined by your organization.
- Optionally, enter a runbook or dashboard URL, and enter a short tip for end user troubleshooting the alert
- Select Customize, if appropriate, to customize the message.
- Click Proceed to Alert Recipients.
- In Alert recipients, select the recipient(s) to send the alert message to. You can choose an email address, team, or webhook. Click Proceed to Alert Activation.
- Enter an appropriate name for the alert rule. In this example, "K8s Pod Memory Historical Anomaly" is used. Then click Activate Alert Rule.
You now have a kubernetes pod memory consumption detector with two alerts, one for memory consumption and the other for memory historical anomaly detection.
- ► Respond to the detector alerts
-
The Splunk Application Performance Monitoring detector now fires on latency breaches and notifies the application SRE team so they can start investigating. As the SRE, you need to investigate the alert and start the triage process to determine probable cause.
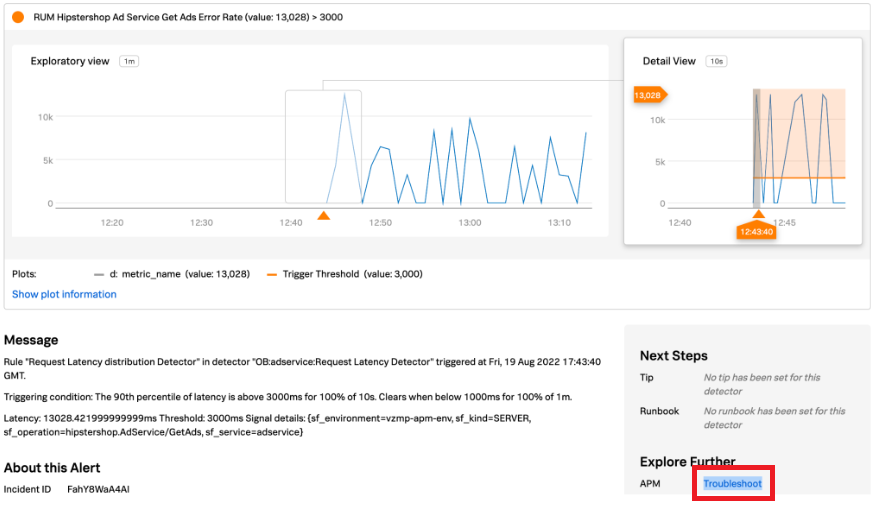
- Click the alert to view the alert details.
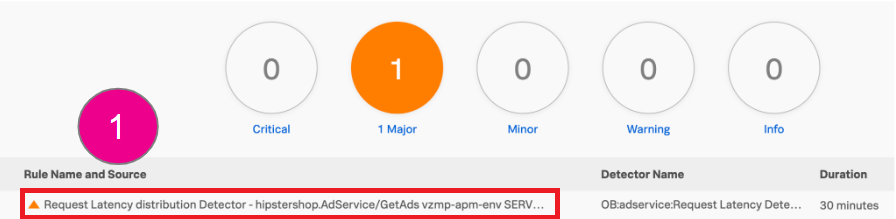
- View the alert details to understand the alert. Then in the Explore Further section, click APM Troubleshoot.
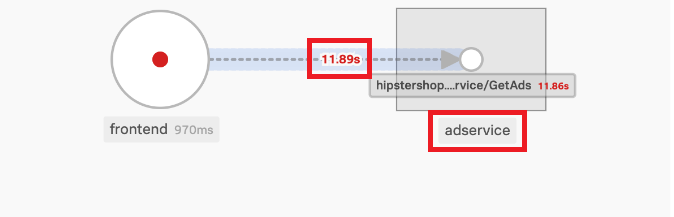
- The Troubleshoot link takes you to the affected service map in Splunk Application Performance Monitoring. You determine the affected service is the "adservice" with a latency of 11.89s.
- Click Traces in the right navigation pane to continue investigating.
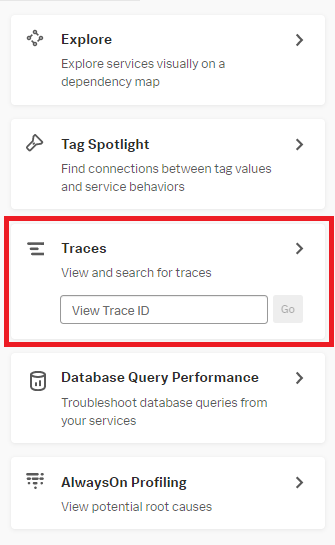
- Review the traces for the time period the alert has fired. Filter for the "adservice" in the Services dropdown. Filter for a max duration of 3000 ms to narrow the traces, then select a trace to investigate further in the Traces and Spans view in Splunk Application Performance Monitoring.
- In the selected trace:
- Select the span in the highlighted section. In this scenario there are 24 spans. Viewing the span details at the bottom of the page, you can see how it started at the bottom of the span details list, and what is currently happening at the top of the details list.
- Click the CPU Call Stacks tab.
- Click Service for View in AlwaysOn Profiler to look at the adservice CPU and memory.
- In the AlwaysOn Profiler:
- Toggle to CPU, and turn on Linked to spans to filter out any background threads which are not needed to identify areas in the code that may be a bottleneck or inefficiency.
- Select the stack frame in the left graph with the largest Self time and highest Count. In this example, that's "Copyrightphoto", which is the probable code bottleneck.
- Review the CPU Stack Traces from the bottom up in the right flame graph to determine the CPU spikes that potentially caused the bottleneck.
- Next, toggle from CPU to Memory. Review the Heap Memory, Application Activity, and Garbage Collection Activity graphs to determine memory degradation.
- In this example, you can see the Garbage Collection has a lot of pauses with increased durations, indicating latency and degradation in the application.
- In the bottom-left chart, you see the "Copyrightphoto" function appears to be the issue, with bytes allocated at 1.8 GB using a lot of memory.
- In the bottom-left flame graph, hovering over the "Copyrightphoto" stack trace, you can see it is using 94.6% of the allocated memory.
- Based on your investigation, you determine there are traces that are taking a long period of time which more than likely indicates a code bottleneck in java code based upon the flame graph visualization. To finish your part of the process, take a copy of the stack trace, open a Jira ticket, and attach the stack trace snippet for the developer of the service to review.
- Click the alert to view the alert details.
The developer then needs to:
- ► Respond to the SRE-initiated Jira ticket
-
As the developer, you assign yourself to the Jira ticket and go directly into the Alert in the context of the service "adservice".
- View the alert details to confirm the SREs findings. In the Explore Further section, click APM Troubleshoot.
- The Troubleshoot link brings you to the affected service map in Splunk Application Performance Monitoring. You determine the affected service is the "adservice" with a latency of 11.89s.
- Analyze the snippet of code the SRE submitted with the ticket. Select the Copy function in the call stack, since the ticket specified the trace/span indicated the latency was in the CopyrightPhoto method of the stockphoto class.
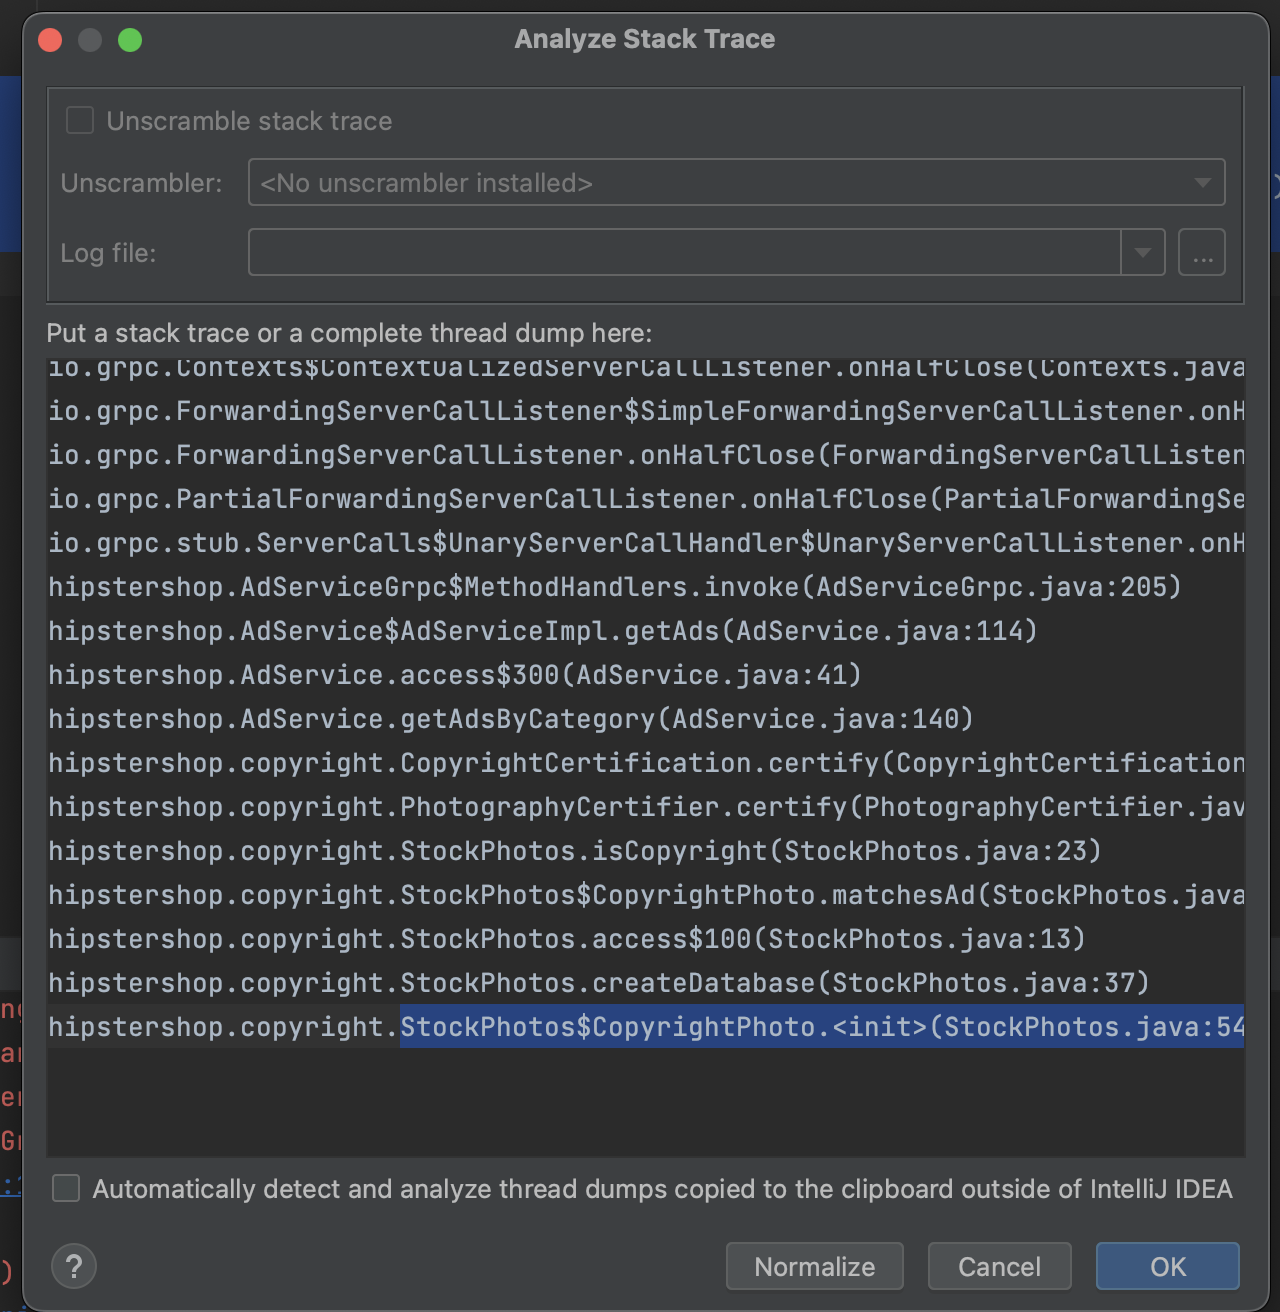
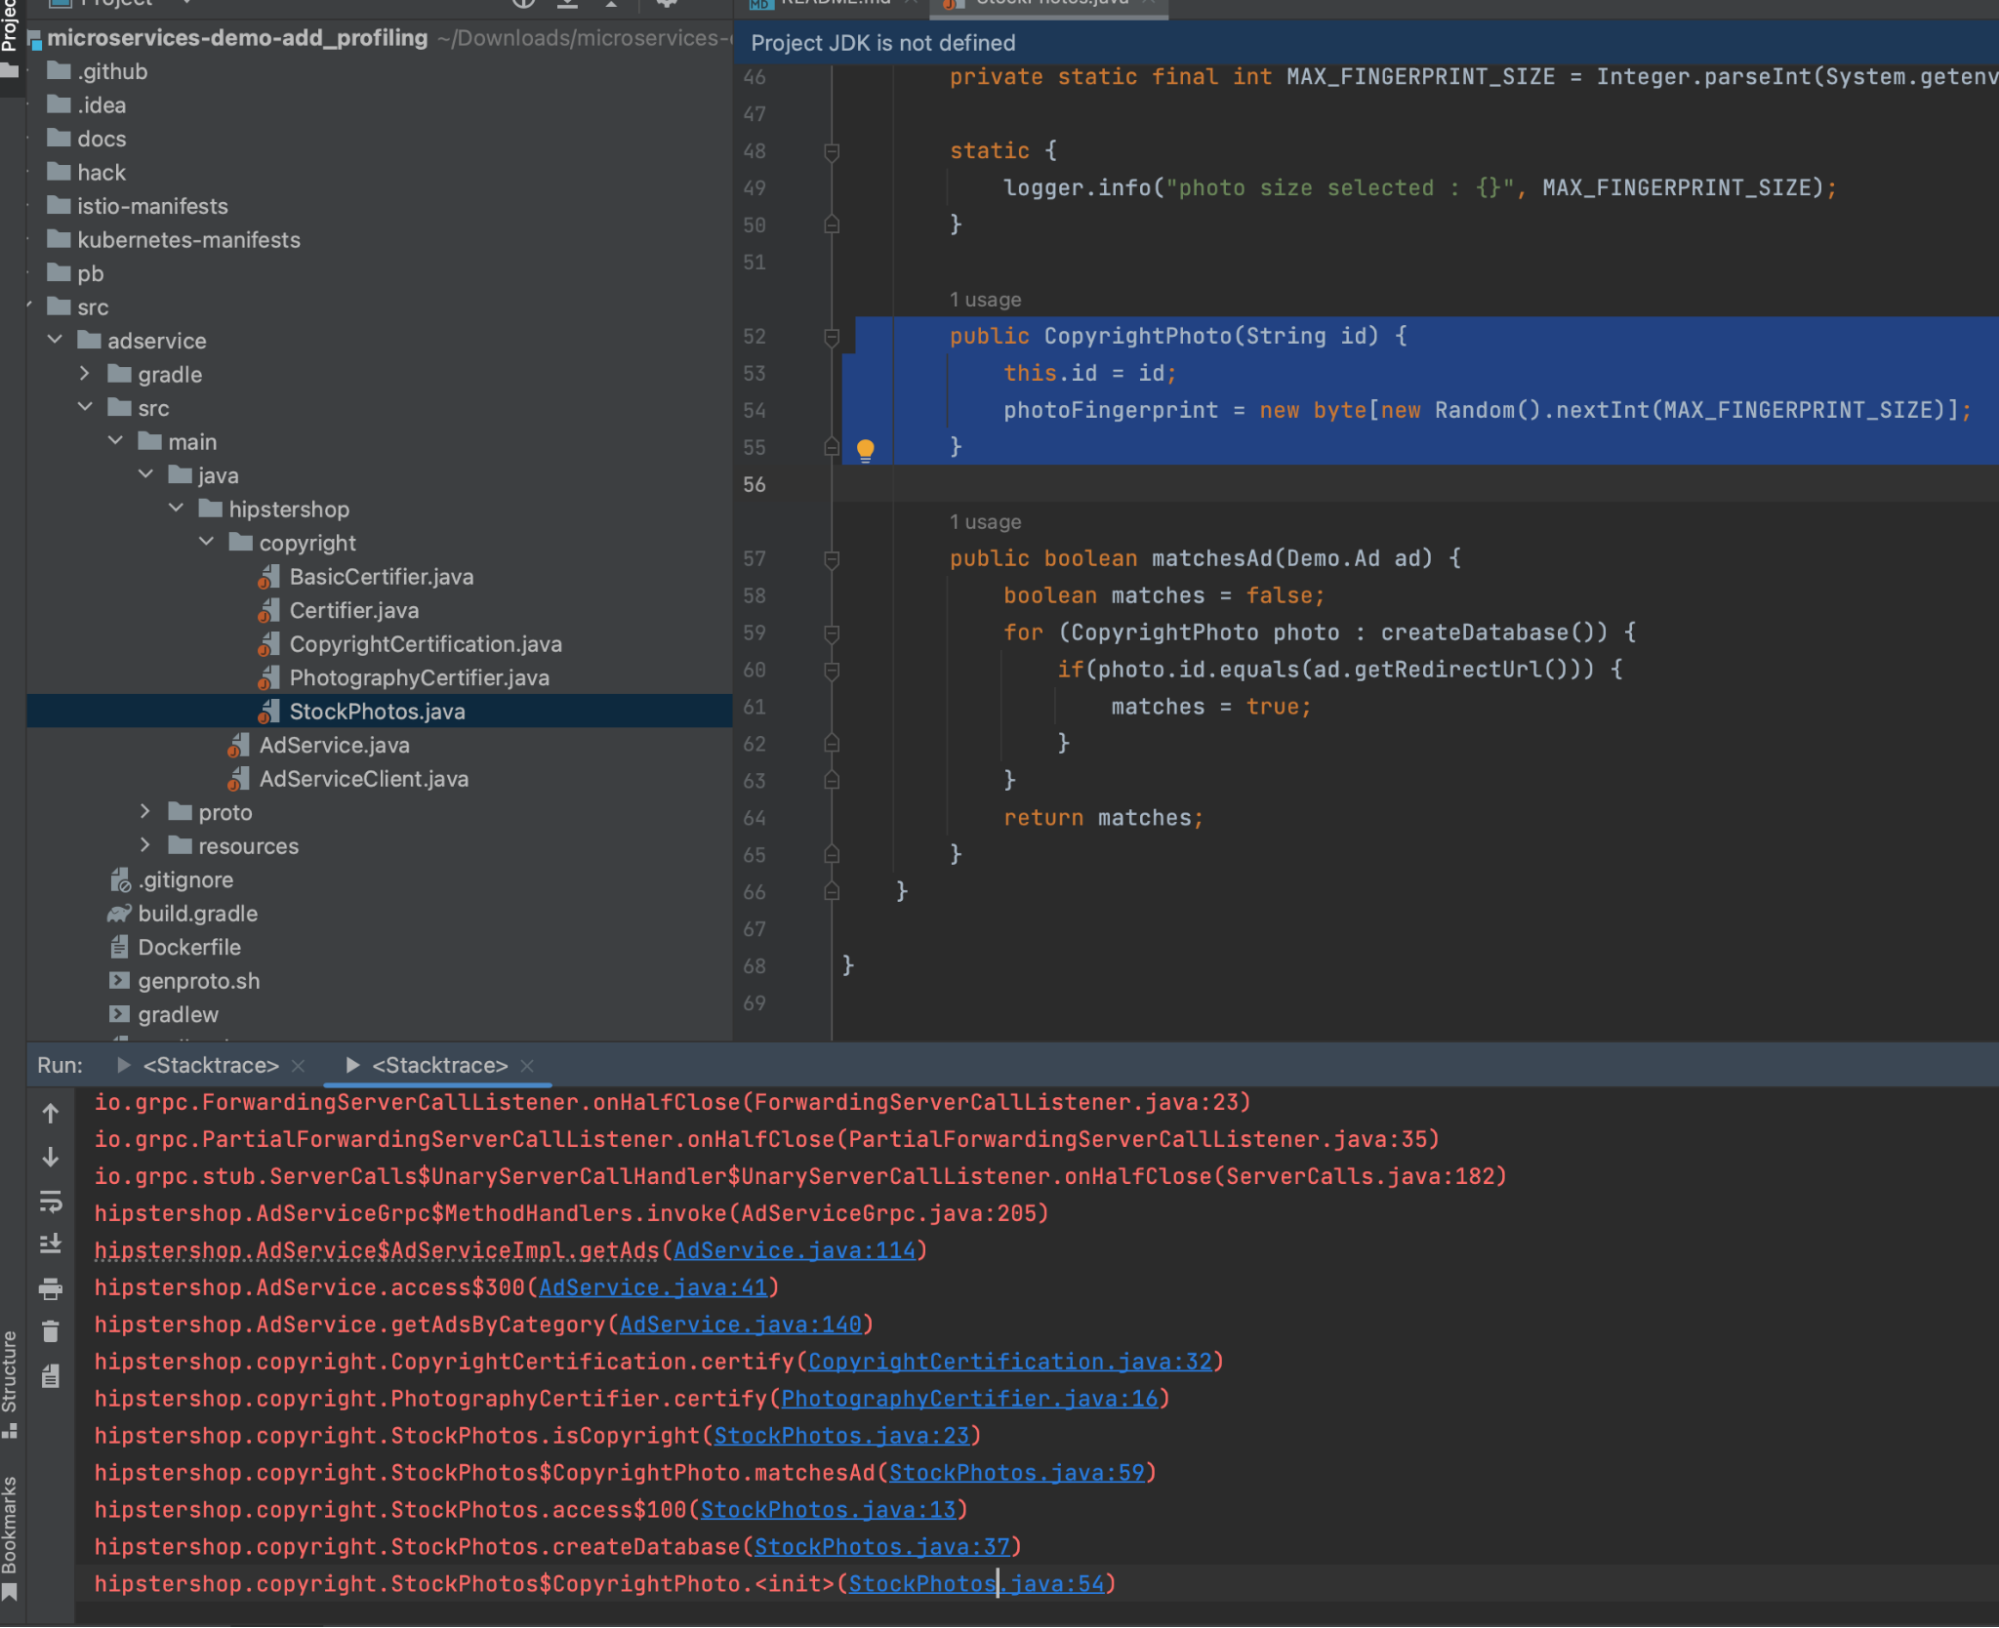
- Locate the area in the code where the optimization is needed. Modify the code to improve performance and resource consumption.
- Push the change to the CI/CD pipeline. The new process results in higher overall service quality and continuous improvement, driving business aligned value.
You can now apply these concepts to your DevOps processes to meet goals of improving performance and quality of the services deployed, and also to help you move to a more proactive operating model.
- View the alert details to confirm the SREs findings. In the Explore Further section, click APM Troubleshoot.
Next steps
These resources might help you understand and implement this guidance:
- Splunk Docs: Get AlwaysOn Profiling data into Splunk APM
- Splunk Docs: Understand and use the flame graph