Running the Splunk OpenTelemetry Collector on Darwin
Your company runs on Darwin (Mac OS X) and you are interested in using the Splunk-Otel-Collector and the upstream OpenTelemetry Collector on this operating system. You need configuration guidance.
Data required
Solution
The full configuration of the Splunk distribution of the OpenTelemetry Collector involves some manual steps to build a custom binary for Darwin (Mac OS X) compiled for AMD64 or for ARM64.
If you want to get started without compiling software and wrangling dependencies, you can use a pre-compiled binary of OpenTelemetry Collector, but this solution does not include the additional functionality included in the Splunk-Otel-Collector.
Prerequisites
- Command Line Access
- A user with the ability to sudo is needed to install the compiled collector
- Git
- Xcode
- Xcode Developer Tools
- Golang
If you have an HEC endpoint currently available, logs can be configured but that is not currently covered in this instruction set.
Steps
- Clone the Splunk-Otel-Collector github repository.
git clone https://github.com/signalfx/splunk-otel-collector.git
- Change to the Splunk-Otel-Collector directory.
cd splunk-otel-collector
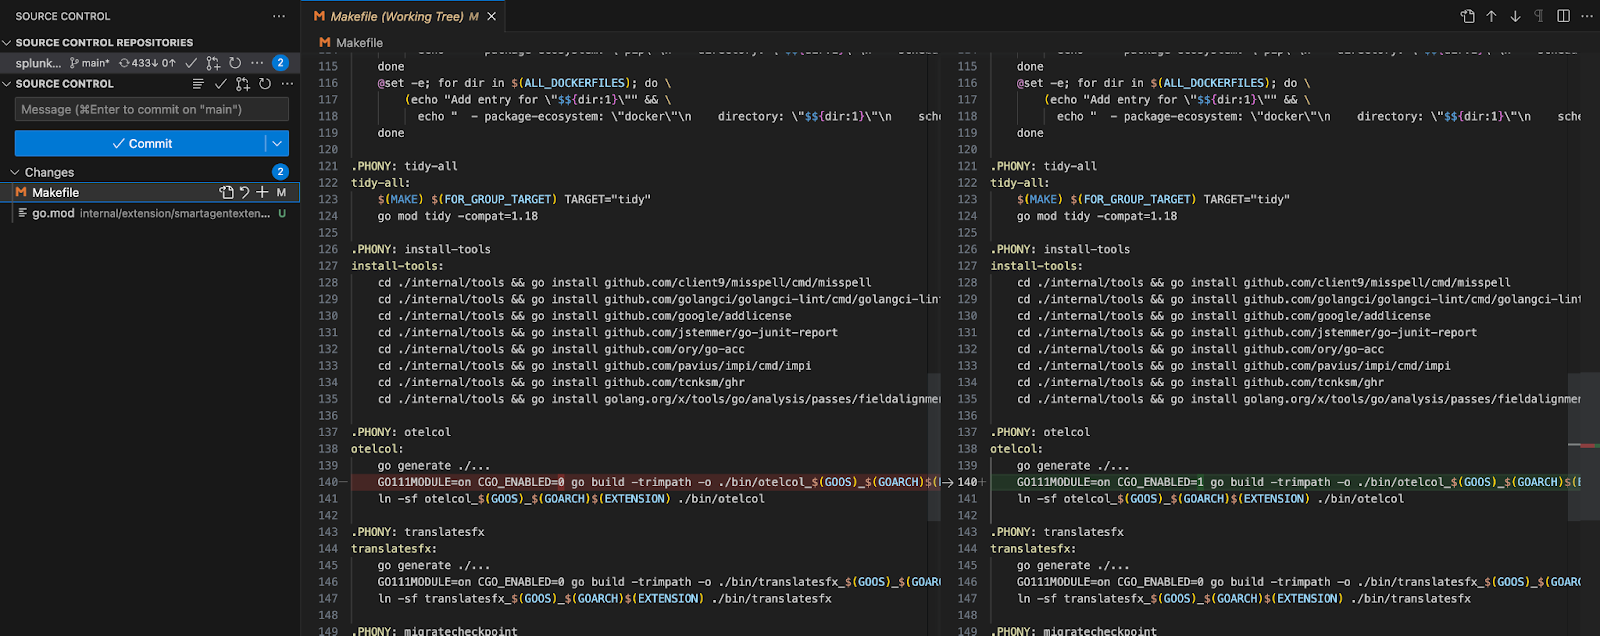
- Modify the makefile to set CGO_ENABLED=1 in the “otelcol” section using your favorite text editor.
$ vi Makefile
    …
    .PHONY: otelcol
    otelcol:
       go generate ./...
       GO111MODULE=on CGO_ENABLED=1 go build -trimpath -o
    ./bin/otelcol_$(GOOS)_$(GOARCH)$(EXTENSION) $(BUILD_INFO)
The difference between the original makefile and the modified version is shown in vscode source control, highlighted in row 140 of the following screenshot.
- Build the Darwin package for Install Tools and the Splunk-Otel-Collector using the
makecommand:make install-tools make otelcol - Edit your users .zshrc file to add the golang home and paths, if you do not already have it set.
- On the command line, open .zshrc with your favorite text editor:
vi .zshrc
- Add golang environment paths to .zshrc file, if not already present. It should similar to this:
export GOPATH=$HOME/go
export GOROOT=/usr/local/opt/go/libexec
export PATH=$PATH:$GOPATH/bin
export PATH=$PATH:$GOROOT/bin
- Save and then Exit your text editor.
- On the command line, open .zshrc with your favorite text editor:
- Ensure you have the latest version of the addlicense package installed:
- Install the go package addlicense if needed:
go get -u github.com/google/addlicense
- Validate the addlicense go command by calling
addlicenseon the command line:$ addlicense Usage: addlicense [flags] pattern [pattern ...]
- Install the go package addlicense if needed:
- Move the directory of the clone of the Splunk-Otel-Collector and build the collector with the
makecommand.$ cd /your/path/to/Splunk-Otel-Collector/ $ make -k
- Copy the artifact from the /bin folder within the Splunk-Otel-Collector repository directory’s /bin to /etc/otel/collector. This directory includes a symlink of otelcol to the binary built for amd64 or arm64 etc. This command requires the use of sudo. Failure to run the command without sudo may result in a permissions error similar to: "cp: /etc/otel/collector/[: Permission denied".
$ cd /bin
$ sudo cp -R * /etc/otel/collector
- Add the environmental variables needed for the agent_config OpenTelemetry Collector configuration.
# If the collector is installed without the Linux/Windows installer script, the following
# environment variables are required to be manually defined or configured below:
# - SPLUNK_ACCESS_TOKEN: The Splunk access token to authenticate requests
# - SPLUNK_API_URL: The Splunk API URL, e.g. https://api.us0.signalfx.com
# - SPLUNK_BUNDLE_DIR: The path to the Smart Agent bundle, e.g. /usr/lib/splunk-otel-collector/agent-bundle
# - SPLUNK_COLLECTD_DIR: The path to the collectd config directory for the Smart Agent, e.g. /usr/lib/splunk-otel-collector/agent-bundle/run/collectd
# - SPLUNK_HEC_TOKEN: The Splunk HEC authentication token
# - SPLUNK_HEC_URL: The Splunk HEC endpoint URL, e.g. https://ingest.us0.signalfx.com/v1/log
# - SPLUNK_INGEST_URL: The Splunk ingest URL, e.g. https://ingest.us0.signalfx.com
# - SPLUNK_TRACE_URL: The Splunk trace endpoint URL, e.g. https://ingest.us0.signalfx.com/v2/trace
- Add or modify an agent_config.yaml to /etc/otel/collector or your desired path and then start the Collector. Comment out the logging sections only sending data to Splunk Observability Cloud.
SPLUNK_API_TOKEN=api_token SPLUNK_ACCESS_TOKEN=token SPLUNK_API_URL=https://api.us0.signalfx.com SPLUNK_INGEST_URL=https://ingest.us0.signalfx.com/ SPLUNK_TRACE_URL=https://ingest.us0.signalfx.com/v2/trace SPLUNK_COLLECTD_DIR=/usr/local/opt/collectd SPLUNK_REALM=us0 ./otelcol --config=/etc/otel/collector/agent_config.yaml
- Click Allow on the modal that asks if you want to allow the incoming network. Otherwise, the OpenTelemetry Collector will not work properly.
- Navigate to your the Splunk platform (for logs) or Splunk Observability Cloud (for host metrics) to help validate the Collector configuration. In Splunk Observability Cloud, navigate to Infrastructure > My Data Center > Hosts and filter to the host name of your machine. This opens a more detailed dashboard where you can learn more about the host's CPU, memory, disk, and additional metadata.
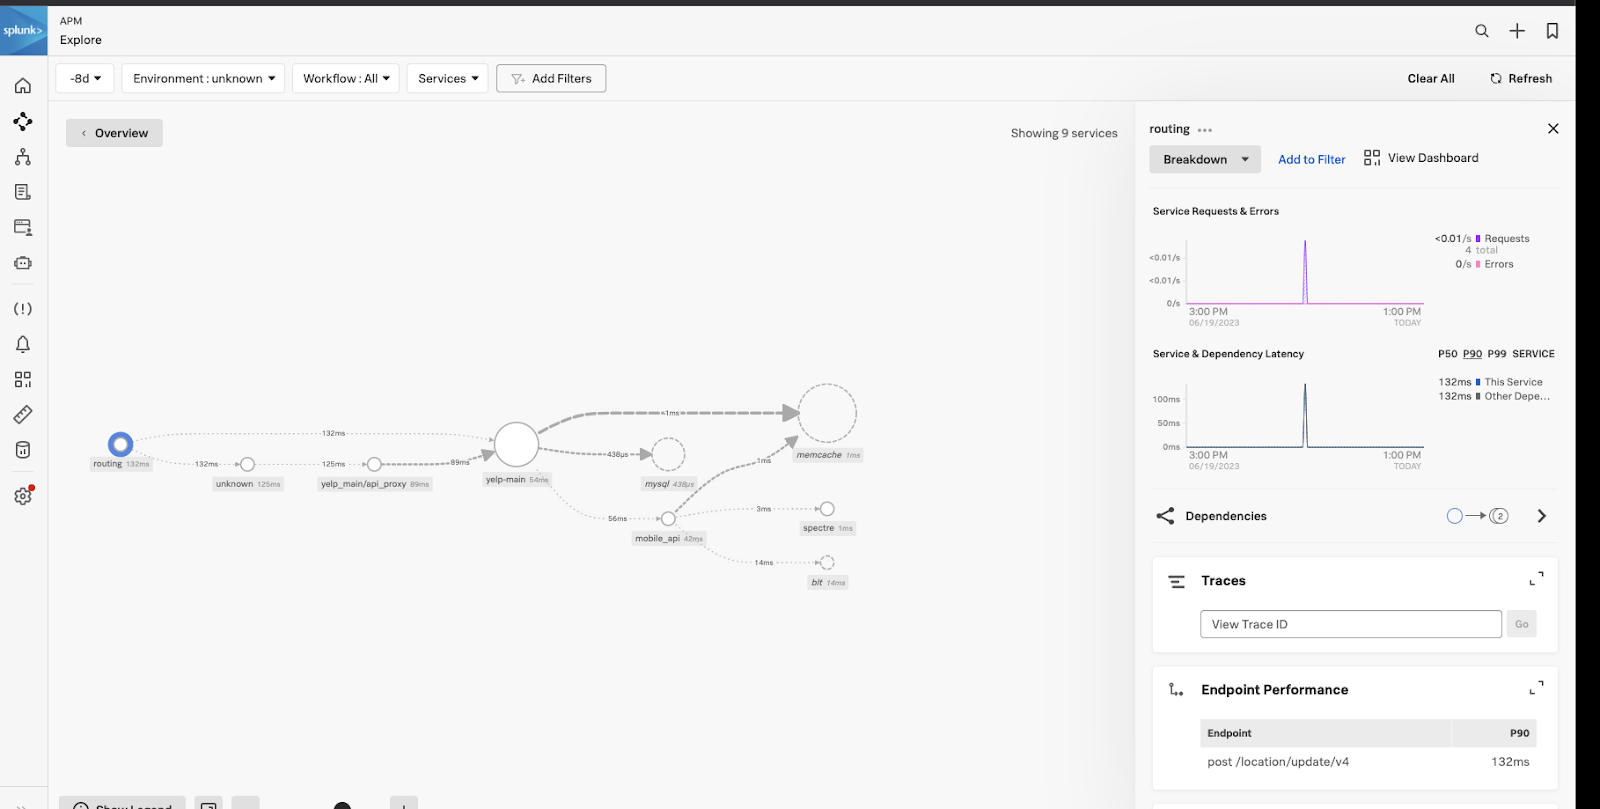
- In Splunk Application Performance Monitoring, you can explore local applications. Use synthetic trace data to test the local collector and view sample traces.


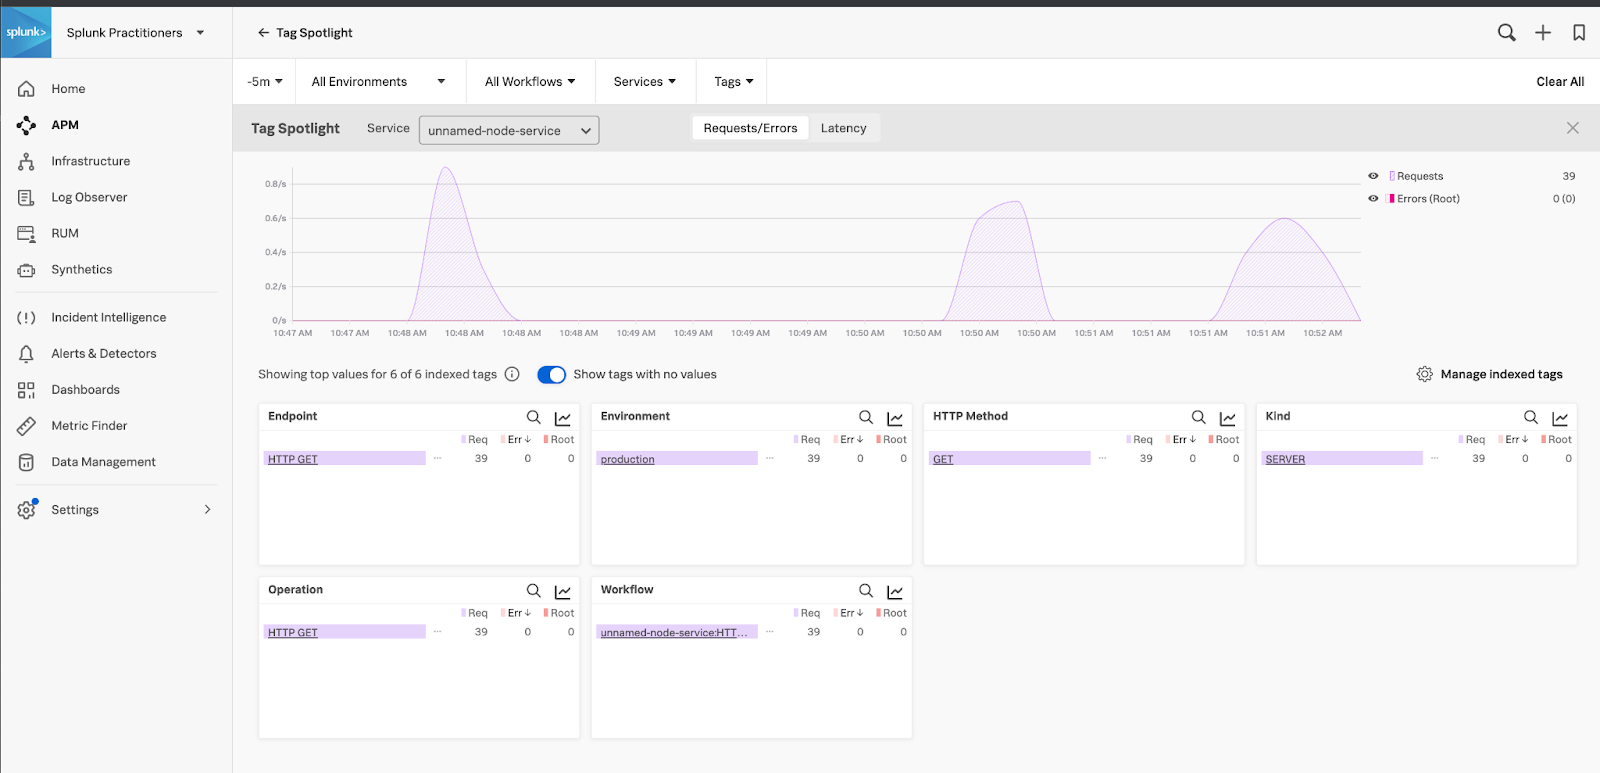
If you have node.js applications automatically instrumented with Splunk tracing, you can also run those and see the service highlighted in Tag Spotlight, as in the following example.
Resources
- GitHub: https://github.com/signalfx/splunk-otel-collector/blob/main/cmd/otelcol/config/collector/agent_config.yaml
- Pre-built OpenTelemetry core binaries (not the Splunk distribution):
- Splunk Docs: Using Synthetic Trace Data - Sends fake trace through the local collector to your configured Splunk Observability Cloud instance so you can visualize a trace in Splunk Application Performance Monitoring without deploying an application.
- Splunk Docs: Manually configure log collection on a *nix host for Splunk App for Infrastructure
- Splunk Observability Cloud GitHub: Exposed endpoints. By default, the OpenTelemetry Collector exposes several endpoints. Endpoints will either be exposed:
- Locally (localhost): Within the service
- Publicly (0.0.0.0): On all network interfaces
- http(s)://0.0.0.0:13133/ Health endpoint useful for load balancer monitoring
- http(s)://0.0.0.0:[6831|6832|14250|14268]/api/traces Jaeger [gRPC|Thrift HTTP] receiver
- http(s)://localhost:55554/debug/configz/[initial|effective] in-memory configuration
- http(s)://localhost:55679/debug/[tracez|pipelinez] zPages monitoring
- http(s)://0.0.0.0:4317 OpenTelemetry gRPC receiver
- http(s)://0.0.0.0:6060 HTTP Forwarder used to receive Smart Agent apiUrl data
- http(s)://localhost:8888/metrics Prometheus metrics for the collector
- http(s)://localhost:8006 Fluent forward receiver
- http(s)://0.0.0.0:9080 SignalFx forwarder receiver
- http(s)://0.0.0.0:9411/api/[v1|v2]/spans Zipkin JSON (can be set to proto) receiver
- http(s)://0.0.0.0:9943/v2/trace SignalFx APM receiver
- Dependencies
- Install the Collector for Linux manually
- https://github.com/signalfx/splunk-otel-collector/network/dependencies
- https://github.com/open-telemetry/opentelemetry-collector-contrib/blob/main/receiver/hostmetricsreceiver/README.md#notes Note that CPU and disk are not supported by default and will cause a failure when starting the Collector. Setting cgoenabled=1 in the makefile for otelcol will remedy this.
- Log path examples:
- /Library/Logs
- /var/log/DiagnosticMessages
- /var/log/jamf.log
- /var/log/system.log
Example configuration: /etc/otel/collector/agent_config.yaml (logs disabled)
extensions:
  health_check:
    endpoint: 0.0.0.0:13133
  smartagent:
    bundleDir: ${SPLUNK_BUNDLE_DIR}
    collectd:
      configDir: ${SPLUNK_COLLECTD_DIR}
  zpages:
    endpoint: 0.0.0.0:55679
  memory_ballast:
    size_in_percentage: 33
receivers:
  jaeger:
    protocols:
      grpc:
        endpoint: 0.0.0.0:14250
      thrift_binary:
        endpoint: 0.0.0.0:6832
      thrift_compact:
        endpoint: 0.0.0.0:6831
      thrift_http:
        endpoint: 0.0.0.0:14268
  sapm:
    endpoint: 0.0.0.0:7276
  zipkin:
    endpoint: 0.0.0.0:9411
  otlp:
    protocols:
      grpc:
        endpoint: 0.0.0.0:4317
      http:
        endpoint: 0.0.0.0:4318
  prometheus/internal:
    config:
      scrape_configs:
      - job_name: otel-collector
        scrape_interval: 10s
        static_configs:
        - targets:
          - 0.0.0.0:8888
        metric_relabel_configs:
        - source_labels:
          - __name__
          regex: .*grpc_io.*
          action: drop
  signalfx:
    endpoint: 0.0.0.0:9943
  hostmetrics:
    collection_interval: 10s
    scrapers:
#      cpu:
#      disk:
      filesystem:
      memory:
      network:
      load:
      paging:
      processes:
processors:
  batch:
  memory_limiter:
    check_interval: 2s
    limit_mib: ${SPLUNK_MEMORY_LIMIT_MIB}
  resourcedetection:
    detectors:
    - system
    override: false
  resourcedetection/internal:
    detectors:
    - system
    override: true
  resource/add_environment:
    attributes:
    - action: insert
      value: production
      key: deployment.environment
exporters:
  sapm:
    access_token: ${SPLUNK_ACCESS_TOKEN}
    endpoint: ${SPLUNK_TRACE_URL}
  signalfx:
    access_token: ${SPLUNK_API_TOKEN}
    api_url: ${SPLUNK_API_URL}
    ingest_url: ${SPLUNK_INGEST_URL}
    sync_host_metadata: true
    correlation:
#  logging:
#    loglevel: debug
service:
  extensions:
  - health_check
  - zpages
  - memory_ballast
  pipelines:
    metrics:
      receivers:
      - otlp
      - signalfx
      - hostmetrics
      processors:
      - memory_limiter
      - batch
      - resourcedetection
      exporters:
      - signalfx
#      - logging
    metrics/internal:
      receivers:
      - prometheus/internal
      processors:
      - memory_limiter
      - batch
      - resourcedetection/internal
      exporters:
      - signalfx
    traces:
      receivers:
      - jaeger
      - sapm
      - zipkin
      - otlp
      processors:
      - memory_limiter
      - batch
      - resourcedetection
      - resource/add_environment
      exporters:
      - sapm
      - signalfx
#      - logging
 #   logs:
 #     receivers:
 #     - otlp
 #     processors:
 #     - memory_limiter
 #     - batch
 #     - resourcedetection
 #     - resource/add_environment
 #     exporters:
 #     - logging