Detecting and resolving issues in a Kubernetes environment
This article describes a scalable observability solution that provides a clear overview of your Kubernetes (K8s) architecture, highlighting real-time issues and allowing you to act fast and mitigate impact.
Before diving into this article, you might want to check out this blog post on common problems you could encounter in a Kubernetes environment, their impacts, and the importance of fast resolution.
Data required
How to use Splunk software for this use case
Kubernetes navigators in Splunk Infrastructure Monitoring
To resolve performance issues faster and increase the reliability of Kubernetes environments, Kubernetes navigators in Splunk Infrastructure Monitoring provide real-time insight into your K8s architecture and performance. With the Kubernetes navigators, you can detect, triage, and resolve cluster issues quickly and easily.
You can enter the Kubernetes navigators from Related Content links throughout Splunk Observability Cloud. For example, you might do this if you’re diagnosing an issue in Splunk Application Performance Monitoring, and you want to explore your cluster health to see if it’s causing the problem. But for the purposes of this article, we'll go directly into the Kubernetes navigators.
From Splunk Infrastructure Monitoring, under Containers > Kubernetes, you can see the two navigators: one for Kubernetes nodes and one for Kubernetes workloads. The Kubernetes workloads navigator provides insight into workloads or applications running on K8s. The Kubernetes nodes navigator provides an overview of the performance of clusters, nodes, pods, and containers. Since our current focus is on cluster health, we’ll look at the Kubernetes nodes navigator.
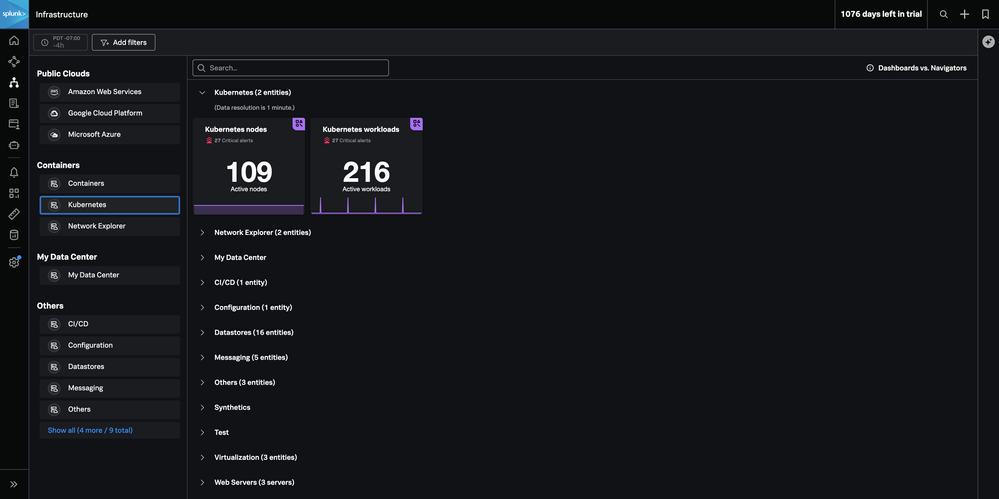
In the Kubernetes nodes navigator, we see an overview of our clusters and their statuses and node dependencies. If we scroll down, we’ll see out-of-the-box charts that provide fast insight into common issues like resource pressure and node status.

Using the Kubernetes (K8s) analyzer
Click the K8s analyzer tab. Here we’ll see an overview of common problems – nodes with memory pressure, high CPU, containers that are restarting too frequently, and abnormal pod and node statuses. As with any navigator, we can filter this data to examine specific clusters and scope our overview.

We can dig into a specific node in the cluster by clicking on it in the heat map view of the cluster, by applying a filter, or by selecting a namespace of interest from one of the analyzer tables. While we’re viewing the specific node, we get insight into the same helpful health info, and we can quickly diagnose node status, resource pressure, pod status, and container health.
By hovering over one of the nodes in this scoped cluster, you can see that it looks like it’s experiencing some memory pressure.

When we click into it, we can see this node is Not Ready.

Scrolling down through the metrics for this node, it looks like there’s one pod consuming significantly more memory than the other. If we click on that chart, we’ll see this data view.

When the node condition chart is outlined in red, we know that it’s already linked to a detector and has an active alert firing. Our team was probably already paged for this alert before our casual exploration even started, meaning resolution is likely already underway. If we select the alert at the top right of the screen, we can view the open alert and expand its details to explore it further. We can also jump into Splunk Application Performance Monitoring from here and see the effect this infrastructure issue is having on our app.
AutoDetect detectors
You might have noticed this alert is tagged with "Autodetect". This type of alert is a Splunk AutoDetect detector. AutoDetect detectors are automatically created in Splunk Observability Cloud to quickly discover common and high-impact anomalies in your Kubernetes infrastructure. No manual creation of custom detectors is required, although you can do that if you want to.
Kubernetes AutoDetect detectors out-of-the-box include:
- Cluster DaemonSet ready versus scheduled
- Cluster Deployment is not at spec
- Container Restart Count > 0
- Node memory utilization is high
- Nodes are not ready
These AutoDetect detectors alert on all common Kubernetes problems discussed here. So rather than constantly running commands or going into your Kubernetes dashboard, you’ll proactively get alerted to issues with your cluster for faster diagnosis and resolution.
Using this process you can find the problem quickly in one of your K8s nodes and allocate some additional memory so that your node and application can recover to a healthy state. But you could also dig into pods and containers either by clicking into them or applying a filter. From the pod and container views you can see information such as resource usage per pod and number of active containers.

By exploring the pods and containers in these views, you can compare real-time usage to limits, uncover where limits aren’t set, and ensure resources are properly allocated to prevent possible pressure.
Next steps
These resources might help you understand and implement this guidance:
- Splunk YouTube: Kubernetes monitoring and troubleshooting with Splunk Observability Cloud
- Splunk Blog: Kubernetes monitoring: An introduction
- Splunk Blog: Monitoring Kubernetes with Splunk Infrastructure Monitoring
- Splunk Education: Getting Kubernetes data into Splunk Observability Cloud
- Splunk Help: Splunk Observability Cloud documentation