Creating an incident workflow in Splunk Enterprise Security
SOC analysts depend on Security Information and Event Management (SIEM) systems to understand the logging, alerting, and behavioral activity taking place in their environments. However, even with a well-tuned SIEM in place, analysts still need to diagnose, respond to, and fix the root cause of events that occur.
The way that analysts work through the investigation process can be influenced by factors such as the threat type, priority of the alert or risk, or the processes and procedures in your response plans that provide oversight. Although different events can require different investigative processes, using a standardized process such as the Splunk Enterprise Security workflow for investigations can help you complete investigations consistently, efficiently, and in a collaborative manner.

The information in this article applies to Splunk Enterprise Security (ES) versions 7.x. If you have upgraded to Splunk Enterprise Security version 8.x, some terminology and steps might not apply. For additional assistance on this use case with ES 8.x, Splunk Professional Services can help.
Review events
A number of different types of events can require deeper review or trigger an investigation. For example, security anomaly notifications can come through:
- a recent notable event that has been created in your Incident Review dashboard
- an alert action that triggered from a scheduled search
- an email to the SOC
- a service ticket from the help desk
No matter the method that begins the inquiry, you should start by reviewing the events and information that have been provided.
Assessment and early investigation event triage
At this stage you can start to make some early assessments, such as:
- Is the event a false alarm? Is it part of a known set of events that occurs frequently and can be dismissed from further investigation?
- Is the event something that can be de-prioritized and held for review later?
- Can the event be closed with a simple comment or explanation?
Depending on the outcome of your initial assessment, it may be prudent to start the incident review process and begin triage of an incident in the Incident Review dashboard. The triage process means to assign a level of importance, urgency, or criticality to security events, which then determines the order in which they will be investigated. Incident severity levels and impact are two common criteria used to triage events.
- Incident severity levels are a measurement of the impact an incident has on the business. Typically, the lower the severity number, the more impactful the incident.
- Impact is determined by the business and generally includes, but is not limited to, a threshold number of impacted users, devices, services affected, or a combination of, and even the alert categorization.
Then, you can use assessments of severity and impact to initiate investigations based on the priority criteria set by your business and its mean time to respond (MTTR). The National Institute of Standards & Technology (NIST) also recommends considering the functional and informational impact of the incident, as well as recoverability.
At this stage, if the event requires further exploration, attention, or research, you can elevate the event into an investigation from within Splunk Enterprise Security where you have a more central point of view to research and conduct further analysis.
You can start your investigation in several different ways in Splunk Enterprise Security:
- Start an investigation from the Incident Review page while triaging notable events.
- Start an investigation when viewing a dashboard using the investigation bar.
- Start an investigation with an event workflow action.
- Start an investigation from the Investigations page.
Start an investigation from the Incident Review page
If you find a notable event that requires further investigation, complete the following steps to start the investigation:
- Select the notable event that you want to investigate.
- From the link above the Notables table, select Add Selected to Investigation.
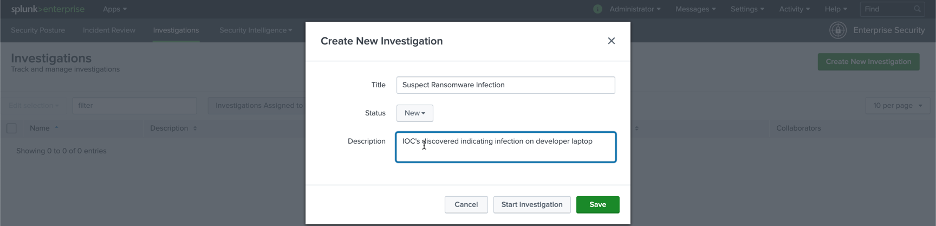
- Click Create Investigation.
- Provide a title to label the investigation and select a status. Optionally, you can provide a detailed description that will help you or other analysts understand what the investigation is about.
- Click Save or Start Investigation.

Start an investigation when viewing a dashboard from the investigation bar
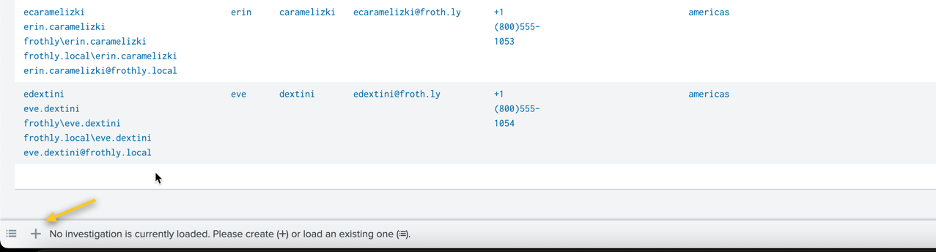
When viewing dashboards in Splunk Enterprise Security, you can find an investigation bar at the bottom of the page. From the investigation bar, it is easy to track your investigation's progress from any page within Splunk Enterprise Security.
- Click the
icon to create an investigation.
- Provide a title to label the investigation and select a status. Optionally, you can provide a detailed description.
- Click Save or Start Investigation.
After you have done this, the investigation is loaded in the investigation bar, and you can easily move into the assessment phase of your workflow.
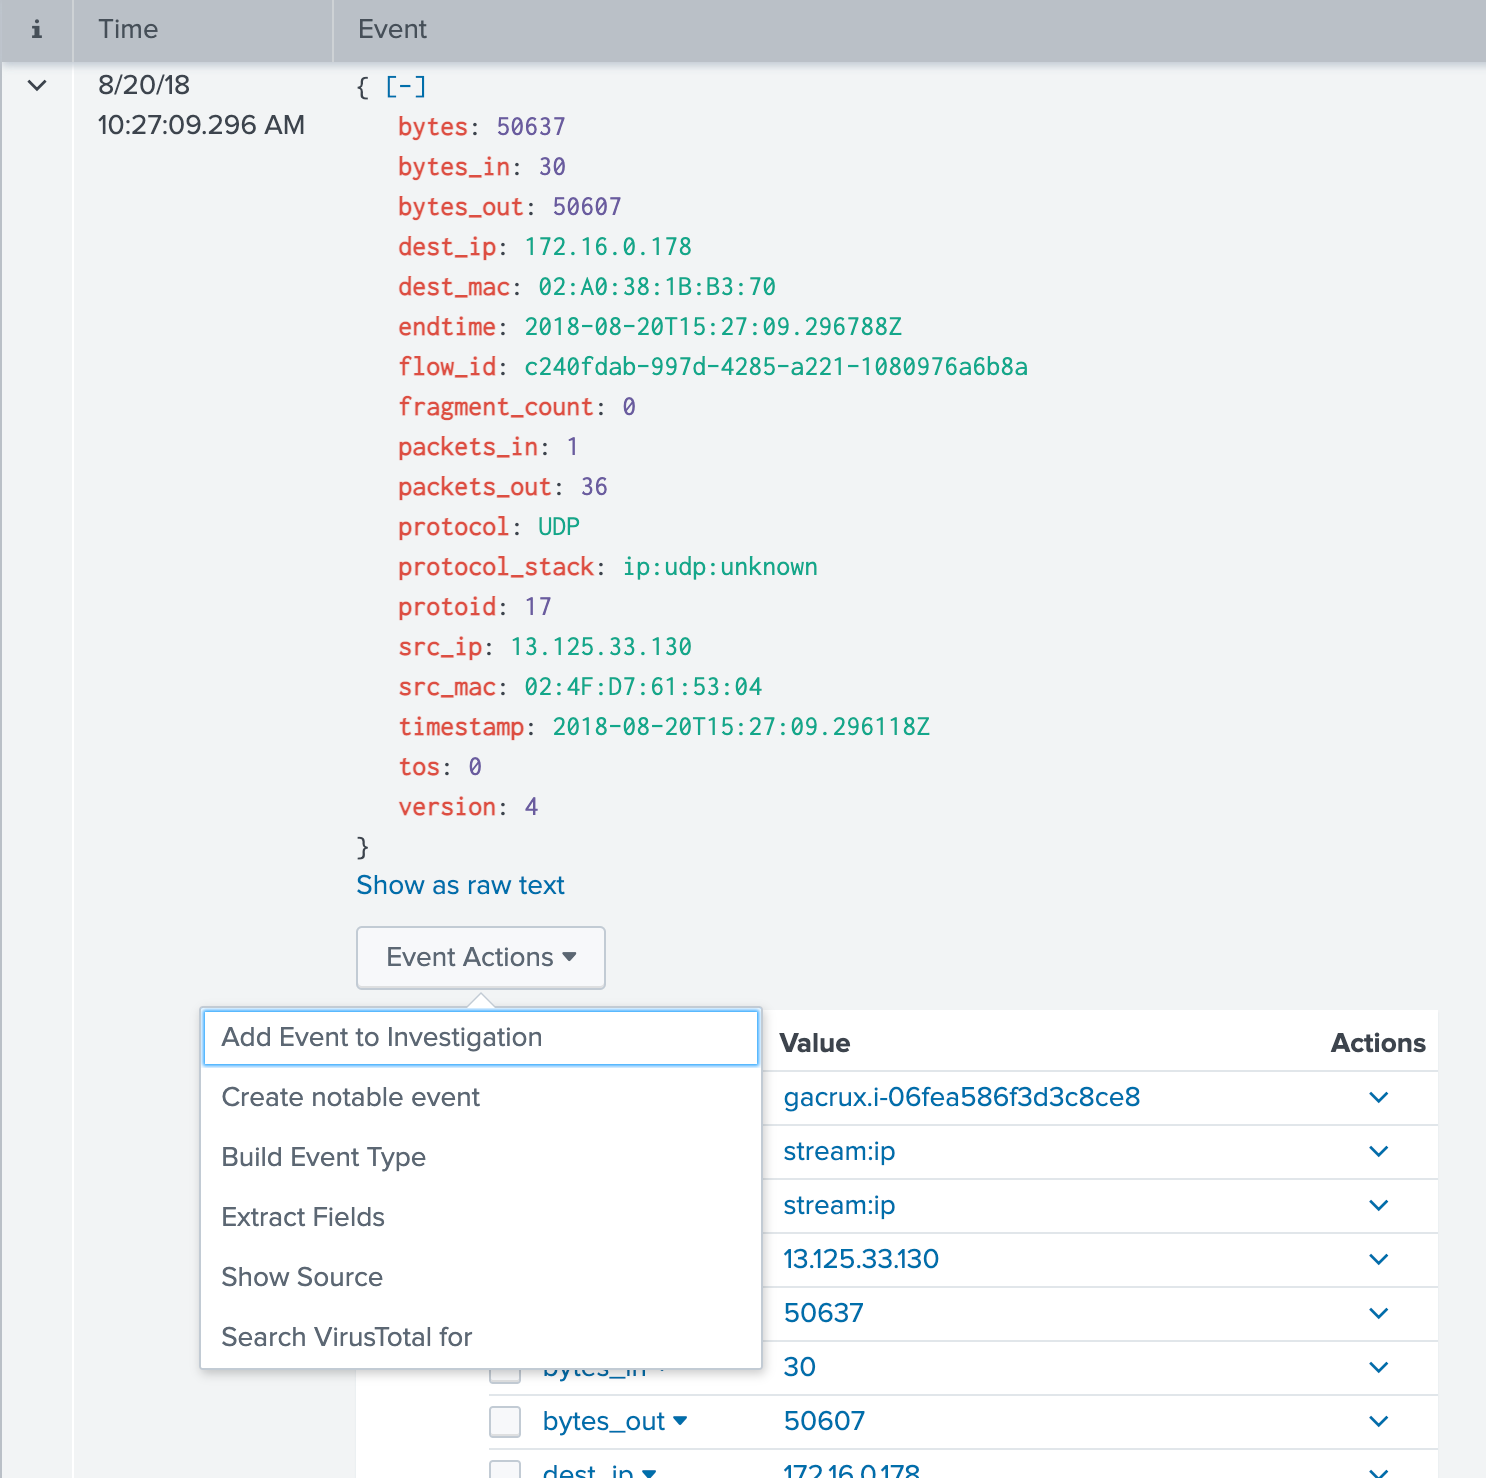
Start an investigation with an event workflow action
When analyzing individual events from a search, you can create an investigation by expanding the event in your search results and click Event Actions, then Add Event to Investigation.
Start an investigation from the Investigations Page
To start an investigation from the Investigations page:
- Click Create New Investigation.
- Type a title.
- Select a status, and optionally, type a description.
- Click Save.

Determine the risk: Using workbench for a deeper dive into the investigation
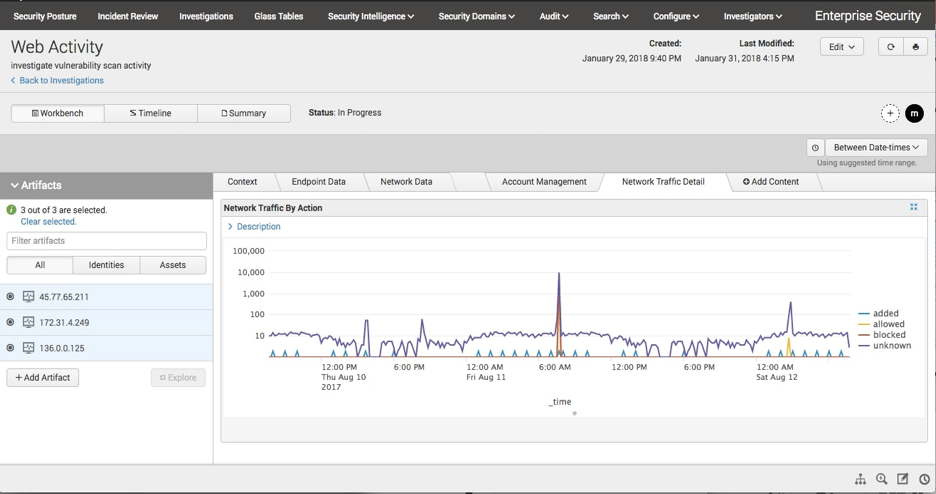
After you have created your investigation within Splunk Enterprise Security, you can open and start assessing it using the workbench. Workbench helps you focus on investigating incidents and quickly getting to mitigation by eliminating the need to switch to other dashboards and panels to gain details on an incident and its artifacts.
Each investigation has a separate workbench where you can investigate artifacts that contributed to the event. By default there are tabs for Context, Endpoint Data, and Network Data. Those panels help you gain additional context into assets and identities, endpoint-related data such as file system activity, and network data such as network traffic that may be contributing to the security event that has occurred.
Artifacts play an important role in investigations, and adding them to the workbench helps you assess whether or not they are affected by, or participants in, the overall security incident. Artifacts you can add include extracted asset and identity data, assets, identities, files, and URLs. You can add artifacts to an investigation in a number of different ways:
- Add artifacts automatically from a notable event
- Add artifacts manually through a simple identification process
- Add artifacts from a workbench panel
- Add artifacts from an event on the investigation
After you have attached artifacts to your investigation, you can work towards a more detailed assessment of those items to understand the risk they present and the overall risk of the event. You can step through the applicable tabs for information relevant to your investigation, such as additional affected assets or details about the affected assets that can accelerate your investigation. For example, if you're investigating a malware detection, you can add affected hosts that you suspect are impacted with malware and determine if there are suspicious processes or files that could be indicative of an infection.
Continue the investigation workflow by detailing your activity and artifacts as evidence by adding events, actions taken, and analyst notes with discoveries. During the process of conducting your investigation, you can add notable events or Splunk Enterprise events that add additional insight and context to the investigation. You can also add searches conducted, suppression filters, and dashboard views to the investigation through your action history to provide a timeline of your investigation steps and to record your activity for later review, should the investigation need to be re-opened or handed off to other collaborators.
Pivoting to explore various angles of an investigation is important to understand the full impact of what may be occurring, what and who could be involved, and the time frame the event took place in. Utilizing searches can help you explore other possible activities that may be connected or running in parallel to your event. Adding useful searches to the investigation from your action history with the investigation bar or relevant events using event actions makes it easy to replicate your work for future similar investigations, and to make a comprehensive record of your investigation process.
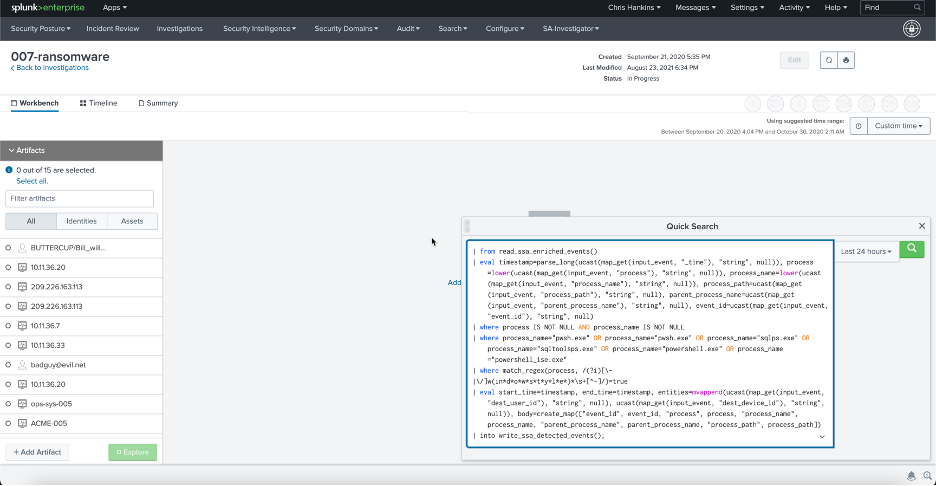
Run a quick search from the investigation bar
You can start a search without opening the search dashboard by clicking Quick Search on the lower investigation bar. The investigation bar is found at the bottom-right side of the Incident Review page or from the Investigation Workbench. It provides several quick action functions that make your investigation easier to perform. Using quick search, you are able to efficiently run a query without ever leaving your workbench.
- Add the search to the investigation in the investigation bar by clicking Add to Investigation.
- Use the Event Actions option to add specific events in the search results to an investigation.
- Click Export to export the search results as a CSV file and save them at investigation time.
- Add the search results as an attachment to a note on the investigation so that it can be referenced later or used by other collaborators.
- Click Open in Search to view the search results on the Splunk Search dashboard.
- Enlarge or shrink your view of the search results by clicking and dragging the corner of the window. Double click to expand the search view to cover most of your screen, or double click again to shrink it.
It’s important to document the steps that you take, such as phone, email, or chat conversations that have taken place as notes in the investigation so that you can easily recall details, or another analyst can easily retrace your steps to quickly understand where to pick up on an investigative effort. You can use notes to add information like relevant URLs and links to online threat research, or upload screenshots and files found as part of your discovery.
Add a note to an investigation
Add a note to an investigation to record investigation details or add attachments. You can add a note from dashboards in Splunk Enterprise Security
- From the investigation bar, click the
icon.
- In the investigation notes window, click Add new Note or Add new Timeline Note.
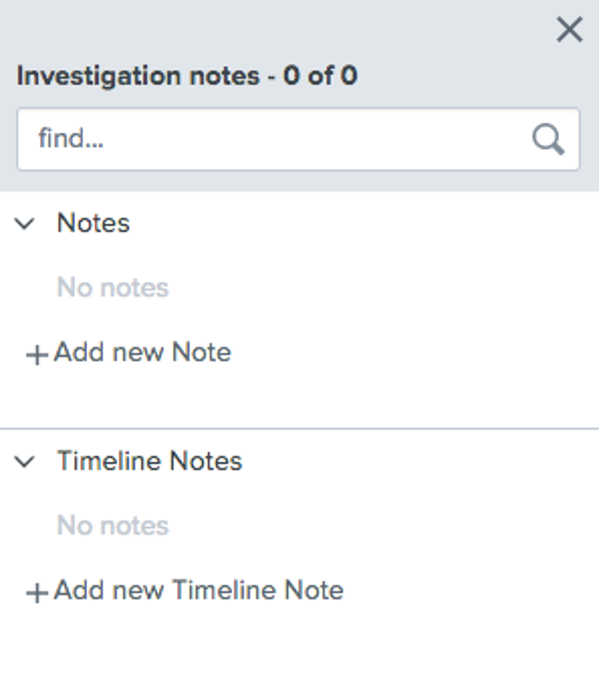
Timeline notes show up in the timeline slide view, while standard notes do not.
- Type a title for your note. For example, "Phone conversation with Ben Schafer."
- Select a date and time of the activity taken and being noted.
- Optionally, click the checkbox to show or hide the note on the timeline, provide a description, or to attach a file to the note.
- Click Add to Investigation to add the note to the open investigation.
When you have reached resolution of your investigation and are able to hand off results to provide mitigation of your event, you can move into your final steps to complete the investigation, close your Splunk Enterprise Security investigation, and optionally, close any associated notable events.
Mitigation and updating the status of an investigation
There may be a point in the investigation where you need to elevate the investigation, hand it off, or resolve it completely. Updating the status of an open investigation from the workbench, summary view, or timeline view is a simple process.
- While viewing the investigation, click Edit > Edit title, description, and status.
- Select a new status to reflect the current state of your investigation.
- Click Save.
You can also update the status of an investigation from the investigation bar.
- Click the
icon and select your investigation.
- After loading your investigation into the investigation bar, click the
icon and select a status.
- Click Save.
Re-assess or review an investigation in Splunk Enterprise Security
You might need to revisit past investigations or review a current investigation for a variety of reasons. Users with the capability to manage all investigations can view all investigations by clicking the title from the investigation bar or from the Investigations page. This can be a useful exercise to teach less experienced analysts how certain types of investigations were conducted, or to help find root causes to build additional layers of defense or correlation activity.
Every investigation in Splunk Enterprise Security includes a summary. From an investigation, click Summary to view the details.
- The summary provides an overview of the notable events and the artifacts attached, or investigated assets and identities, that are associated with that investigation.
- The summary reflects a point in time of the investigation, rather than the overall progress of an investigation. Therefore, the artifacts listed on the summary page reflect the artifacts present at the end of the investigation, rather than all artifacts that you investigated on the workbench.
Before deciding on the direction of investigation, SOC analysts are tasked with determining the nature and specifics of an event to appropriately respond to it. The process taken of gathering evidence related to an event to validate the alert and inform response and recovery activities can vary from analyst to analyst. However, the end goal of any investigative effort is to validate, understand, and react to anomalies in an environment before they become major incidents. Using an efficient and accurate investigation workflow can reduce the overall impact of a threat, which saves you time and energy from chasing the wrong threats.
Next steps
These resources might help you understand and implement this guidance: