Reducing PAN and Cisco security firewall logs with Splunk Edge Processor
Some organizations struggle with the constant influx of log data from Palo Alto Networks (PAN) and Cisco devices. The large log volume is due to this network data being in the syslog format, and it can lead to storage issues, longer processing times, and difficulty in finding relevant logs among the noise. It also increases the cost of log management, and can make it challenging to comply with data retention policies.
Data required
How to use Splunk software for this use case
Splunk Edge Processor supports syslog-based ingestion protocols, making it well-equipped to wrangle complex and superfluous data. You can deploy Splunk Edge Processor as an end-to-end solution for handling syslog feeds, such as PAN and Cisco logs. It includes the functionality to act as a syslog receiver, process and transform logs, and route the data to supported destinations.
With features such as syslog header trimming, unnecessary field dropping, and redundant timestamp information removal, Splunk Edge Processor enhances control and flexibility in log management. The option to route unnecessary logs to S3 for long-term storage further consolidates its position as an efficient and versatile log management solution.
Some examples of success metrics that you should see improvements in when implementing this use case with the Splunk Edge Processor solution are:
- Reduced log volume/size
- Substantial storage savings
- Reduced storage costs
- Faster threat identification and analysis
- Reduced incident response times
- More efficient log management
Splunk Edge Processor is included with your Splunk platform, available at no additional cost. Learn more about the requirements to use Splunk Edge Processor and how to request access if you do not already have it. If this is your first time using Splunk Edge Processor, see Getting started with Splunk Edge Processor.
Prerequisites
Before you start writing an SPL2 pipeline to process and transform incoming logs, configure Splunk Edge Processor to natively listen for events coming over syslog by:
- Opening a port to listen for syslog traffic on the Splunk Edge Processor node;
- Configuring your device/application to send syslog data to Splunk Edge Processor; and
- Configuring Splunk Edge Processor to listen for syslog feed on the opened port.
After you have configured Splunk Edge Processor to receive syslog events, you will see it appear in the Splunk Edge Processor console, as shown in the following screenshot:

Process
You can gain control of Cisco and PAN logs via syslog, where your ultimate goal is to improve search performance. You can do so by reducing event size; removing unnecessary, “noisy” fields; and routing a full-fidelity copy of the data that is to be maintained for compliance purposes in AWS S3. All of these steps reduce ingestion and storage costs.
This solution will walk you through the following:
- Trim log content in every event to remove the unnecessary syslog header content and drop extraneous fields like future_use and time;
- Filter out events that might not be directly useful for immediate security incident investigation, such as the HIPMATCH and CORRELATION event types, and entries related to ROUTE and RAS event subtypes; and
- Route these reduced log events to the Splunk index for active security-related use cases, including searches and alerts, while keeping unmodified copies in AWS S3 for long-term storage.
Create pipelines in Splunk Edge Processor to trim, filter, and route firewall logs
To get started, log in to your Splunk Edge Processor and follow the guided prompts to create your first pipeline:
- Login to the Splunk Edge Processor.
- On the left side menu, click Pipelines.
- In the top right corner of the Pipelines page, click New pipeline. A pipeline menu appears on the right of the screen.
- Define your pipeline’s partition by sourcetype. Select the correct source type for the data you want to process in this pipeline (example: pan:firewall).
- Click Next.
- Add sample data if you would like to test your data flow before applying.
- Click Next.
You will now see the pipeline builder.
The two pipelines below show how a user controls what data the pipeline applies to, how that data is to be processed, and where the processed data is routed. It’s essential to note that this is just one example of how the Splunk Edge Processor can be employed. Just like SPL, the actual query definition depends on the nuances of the data (and your creativity!), and you should tailor the Splunk Edge Processor pipelines to best fit your unique needs.
- Pipeline 1: Shows how to filter and minimize data volume on the way to a Splunk index.
- Pipeline 2: Keeps a raw copy in an AWS S3 bucket for compliance reasons.
Below, you will see references to commands you might not recognize, like remove_readable_timestamp. These aren’t out-of-box SPL2 commands, but are custom functions that you can define to improve usability. Continue reading below the table to learn more about user-defined functions.
Pipeline 1: Filter Palo Alto Firewall logs, route to Splunk Cloud Platform
| Pipeline definition (SPL2) | $source | $destination |
|---|---|---|
|
|
|
|
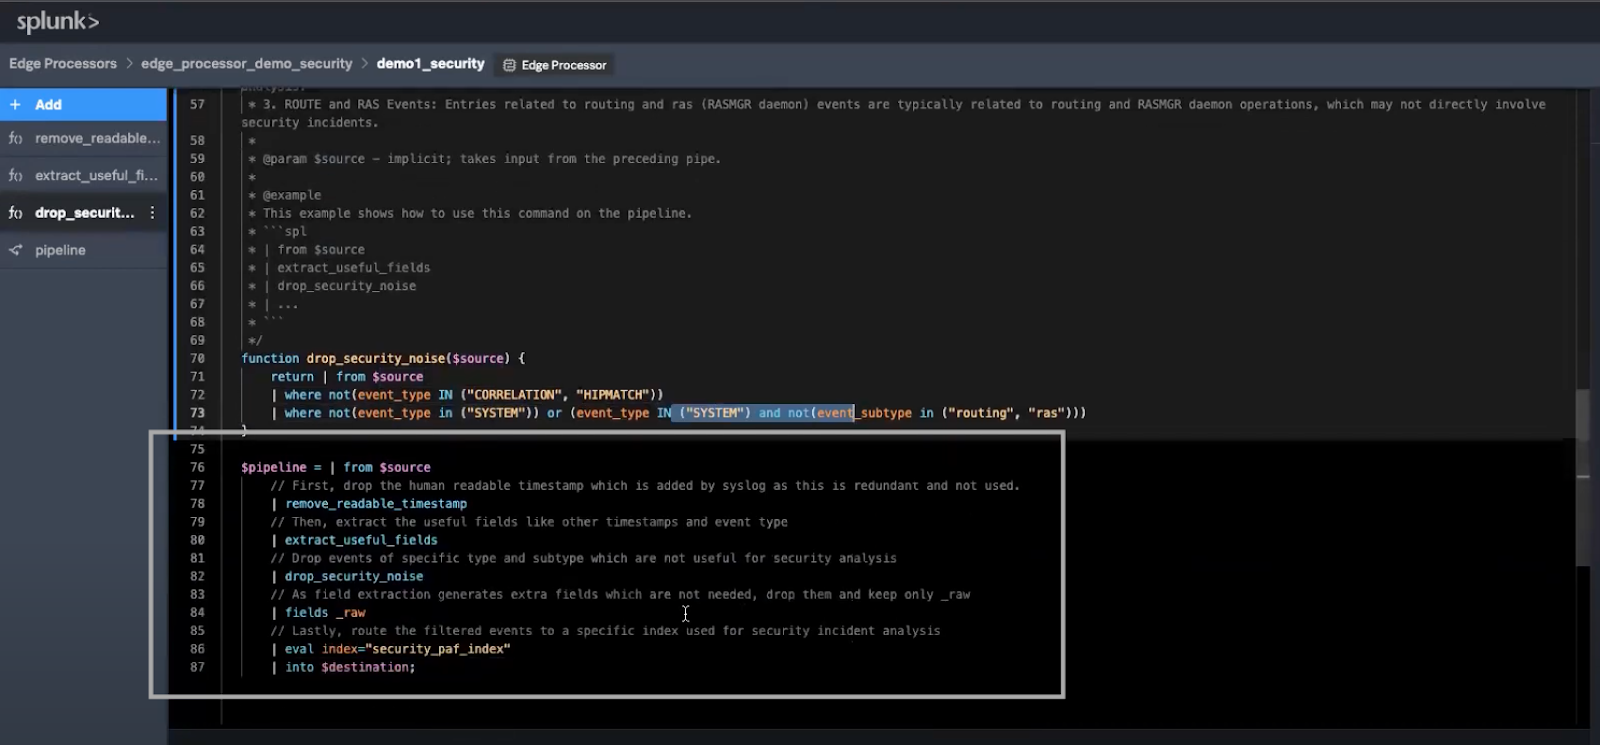
This is what the final pipeline will look like:
You have two options to create Pipeline 1:
Option 1: Create your pipeline with custom SPL2 functions
As you review the Pipeline 1 definition, you’ll notice how readable and straightforward those SPL2 commands are. You might also be thinking, “there’s no way extract_useful_fields is an out-of-box SPL2 command – how does the Splunk platform know what’s a useful field?”
The extract_useful_fields command is made possible through custom SPL2 functions. Custom SPL2 functions are named, reusable blocks of SPL2 code that can wrap complex SPL2 in a simple custom command or eval function that works like an SPL macro but is much more powerful. Here is a breakdown of the custom functions in this pipeline:
remove_readable_timestamp: Each event, as received, begins with a human-readable timestamp appended by syslog. While this might be easy to read, it's unnecessary for processing purposes. A concise SPL2 function can remove this redundancy:function remove_readable_timestamp($source) { return | from $source | eval readable_time_regex = "\\w{3}\\s\\d{2}\\s\\d+:\\d+:\\d+" | eval _raw=replace(_raw, readable_time_regex, "") | fields -readable_time_regex }extract_useful_fields: Before you can filter events based on their relevance, you'll need to extract some of the useful fields required to determine relevance of events to security. In this example, those areevent_typeandevent_subtype, but any fields could be extracted. Here’s how you can extract them efficiently:function extract_useful_fields($source) { return | from $source | rex field=_raw /(\d{4}\/\d{2}\/\d{2}\s\d{2}:\d{2}:\d{2}),([\w\d]+),(?P<event_type>[A-Z]+),(?P<event_subtype>[\w\d]*),\d*,(\d{4}\/\d{2}\/\d{2}\s\d{2}:\d{2}:\d{2})/ }drop_security_noise: By applying filters usingevent_typeandevent_subtype, you can filter noise so you can focus on what's important:function drop_security_noise($source) { return | from $source | where not(event_type IN ("CORRELATION", "HIPMATCH")) | where not(event_type in ("SYSTEM")) or (event_type IN ("SYSTEM") and not(event_subtype in ("routing", "ras"))) }
After you have defined and added the custom functions to your pipeline builder, you can use the SPL2 from the Pipeline 1 definition in the table above:
$pipeline = | from $source
| remove_readable_timestamp
| extract_useful_fields
| drop_security_noise
// As field extraction generates extra fields which are not needed at index-time, use the fields command to keep only _raw
| fields _raw
// Lastly, route the filtered events to a specific index used for security incident analysis
| eval index="security_paf_index"
| into $destination;
Option 2: Create your pipeline with standard SPL2 functions
As you can see, the bodies of each of the custom SPL2 functions above are composed of standard SPL2, just like a macro. All you need to do is use the functions in the pipeline. However, if you prefer to inline all SPL2 in your pipeline without using custom functions, you can do that like this:
$pipeline = | from $source
//Remove readable & redundant timestamp
| eval readable_time_regex = "\\w{3}\\s\\d{2}\\s\\d+:\\d+:\\d+"
| eval _raw=replace(_raw, readable_time_regex, "")
| fields -readable_time_regex
//Extract useful fields
| rex field=_raw /(\d{4}\/\d{2}\/\d{2}\s\d{2}:\d{2}:\d{2}),([\w\d]+),(?P<event_type>[A-Z]+),(?P<event_subtype>[\w\d]*),\d*,(\d{4}\/\d{2}\/\d{2}\s\d{2}:\d{2}:\d{2})/
//Drop security noise
| where not(event_type in ("CORRELATION", "HIPMATCH"))
| where not(event_type in ("SYSTEM")) or (event_type in ("SYSTEM") and not(event_subtype in ("routing", "ras")))
// As field extraction generates extra fields which are not needed at index-time, use the fields command to keep only _raw
| fields _raw
// Lastly, route the filtered events to a specific index used for security incident analysis
| eval index="security_paf_index"
| into $destination;
Pipeline 2: Route unfiltered copy of all PAN firewall logs to AWS S3 bucket
| Pipeline definition (SPL2) | $source | $destination |
|---|---|---|
|
|
sourcetype= pan:firewall |
S3 bucket: security_compliance_s3 |
Apply and verify your pipeline
After you have constructed your pipeline using the SPL2 above, follow these instructions to save and apply your pipeline.
- Test your pipeline rule. Click the blue Preview button in the top right corner of the screen.
- Set the Data destination to the appropriate admin index, as requested by your security team.
- Click Apply to save the destination.
- Click Save pipeline in the top right corner of the screen.
- Give your pipeline a suitable name, such as syslog_filter_firewall_<yourName>.
- Click Save to save your pipeline.
- To try out the new pipeline, click Pipelines on the top left of the page.
- Locate the pipeline you just created, click the three dots next to your new pipeline, and select Apply/remove.
- Select the Splunk Edge Processor you created earlier and click Save. You will see a brief message stating that your changes are being saved.
It may take a few minutes before you see the effects of your pipeline in Splunk Cloud Platform.
You can now verify that your Splunk Edge Processor node is healthy and that the pipeline has successfully been applied:
- To check the status of your node, click the pipeline while on the pipelines page. A panel will open up on the right of the page, showing the status of the Splunk Edge Processor instance that this pipeline has been applied to.
- Click the arrow next to the instance name to view more information.
- After your pipeline has successfully applied, the status of your instance should change to healthy. To verify this, click Edge Processors in the menu on the left of the screen and refresh your web browser until your Splunk Edge Processor displays as healthy.
- Log into the Splunk platform and open the Search & Reporting app.
- Run the following search over the last 15 minutes and verify that you can see the events coming from this pipeline:
index="security_paf_index" sourcetype="pan:firewall"
- You can then check the Useful Fields pane to see that the filtered event types are gone.
- (Optional) To verify that the size of the raw events are also smaller because of the removal of the timestamp, run the following search:
index="security_paf_index" sourcetype="pan:firewall"
| eval event_size = len(_raw)
| timechart avg(event_size)
Next steps
Join the #edge-processor on the Splunk Community Slack for direct support with Splunk Edge Processor (request access: http://splk.it/slack). Then, review the additional resources below to help you better understand and implement this use case:
- Splunk Help: About the Splunk Edge Processor solution
- Splunk Help: Splunk Edge Processor pipeline syntax
- Splunk Blog: Data preparation made easy: SPL2 for Splunk Edge Processor
- Splunk Tech Talk: Introducing Splunk Edge Processor
-
Other use cases to explore:
- Splunk Lantern Article: Implementing use cases in Splunk Splunk Edge Processor (including how to filter Kubernetes data over HEC, mask sensitive information, and modify raw events to remove fields)
- Splunk Lantern Article: Masking IP addresses from a specific range
- Splunk Blog: Filter verbose data sources and transform content for Windows system events