Securing medical devices from cyberattacks
In your role as security operations manager of a healthcare organization, it is important to have visibility into your medical device landscape to assess overall risk to network-connected medical devices. You want to quickly see trends across showcased notable events, any recent spikes in intrusions, and any upward trends in vulnerabilities. You also need to be able highlight potential relationships among these trends and further correlate events.
Data required
When designing searches to secure your medical devices, you will typically use the following data types:
- Medical device data
- Network switch and network router data
- Intrusion detection and prevention data
- Vulnerability scanning data
Your data should include the following fields:
- Device. The IP address
- MAC. The MAC address
- Device profile. This could be a company or other preferred method of profiling devices on your network
- Risk. A qualitative rating defined in the search
- Location. Campus where the device is used
- Registered. As defined in the search
- Last connected. The last time the device was online
- VM. As defined in the search
- Network device. Number of the device
- Port. Port the device operates on
In addition, you should enrich your medical device logs with lookups that provide subjective values that explain importance to your organization. For example, you might want to add a classification value to each device that represents the impact that an exploitation of the device would have on your business.
Finally, Splunk recommends that customers look into using data models, report acceleration, or summary indexing when searching across hundreds of GBs of events in a single search. Depending on your data, search time range, and other factors, implementing these features can help you searches scale appropriately.
How to use Splunk software for this use case
Summary dashboards will help you bring insights to your engineers and deliver measurable KPIs for your engineering, security, and executive teams. This visibility can help you move from a reactive incident response to a proactive risk mitigation approach. Due to the wide variety of medical devices and their associated logs, this article provides recommendations of searches to run and add to dashboards through visualizations, but it does not provide the SPL for searches. If you are a new Splunk customer, the Search Tutorial is a good resources to help you get started writing searches.
Executive dashboard
On this dashboard, you might want to include visualizations for searches that provide the following information:
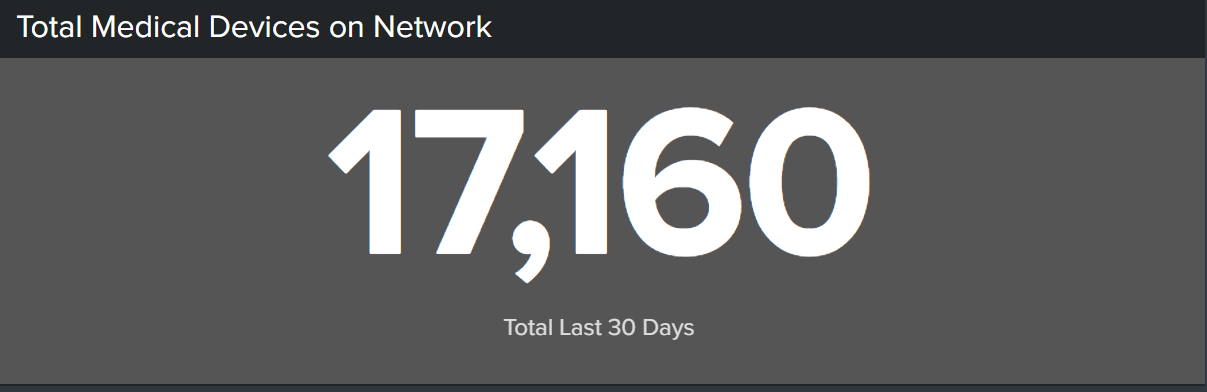
- Total medical devices on network.
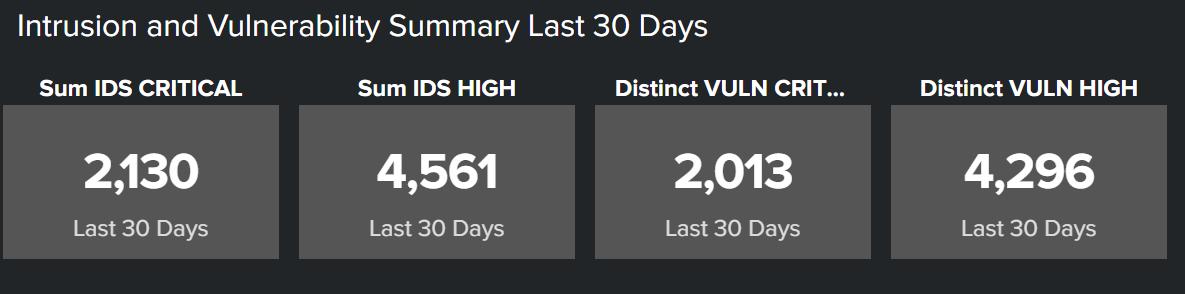
- Intrusion and vulnerability summary (last 30 days). You should showcase vulnerabilities and intrusion detection system events, but you can highlight any other notable events unique to your organization’s critical areas of risk. You can further break down these events by the criticality (Critical, High, Medium, Low).
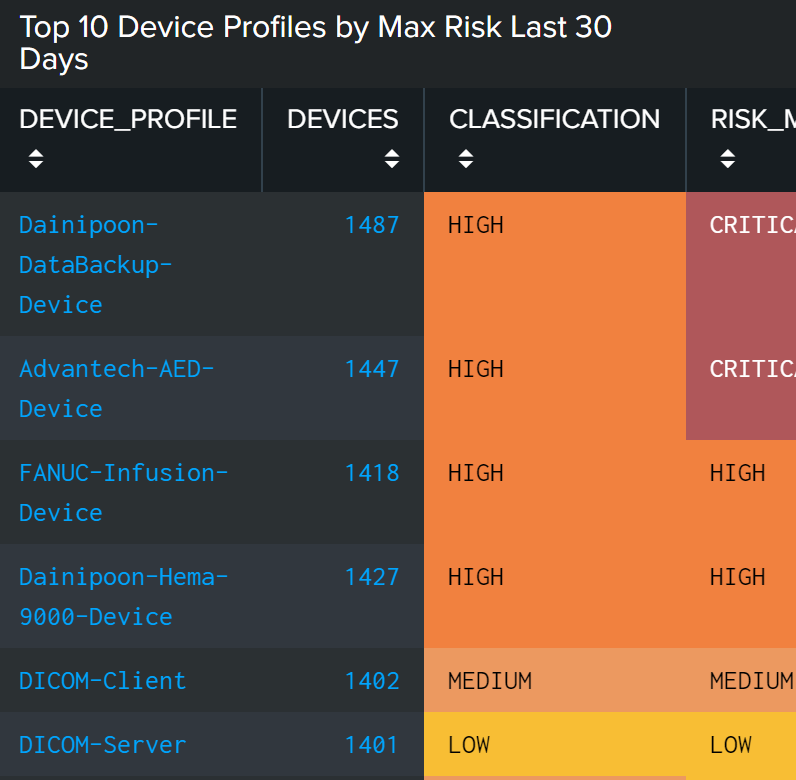
- Top 10 device profiles by maximum risk (last 30 days). In this example, the first two devices “Dainippon-DataBackup-device” and “Advantech-AED- Device” have a “Critical” Risk score. Splunk Enterprise Security automatically calculates the risk score based on the risk type and number of notable events identified on the profile of devices. The device classification is determined by your organization based on the impact the device would have on the business if exploited.
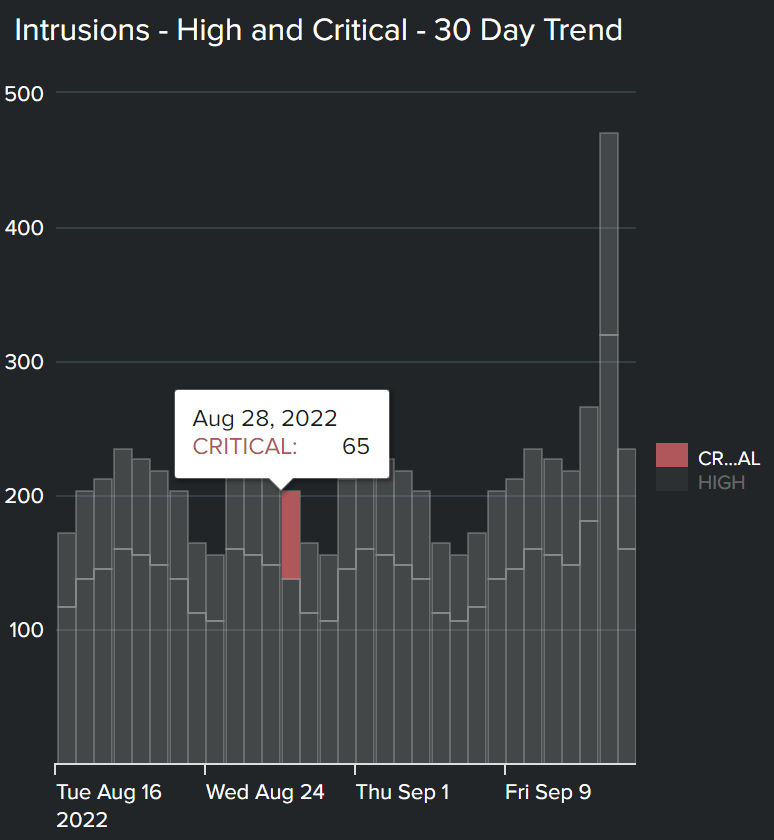
- Intrusions, high and critical (30 days trend). You can use bar graphs to see trends across showcased notable events, and see if there is a recent spike in intrusions and upward trend in vulnerabilities. This could highlight a potential relationship between the two so you can further correlate across events.
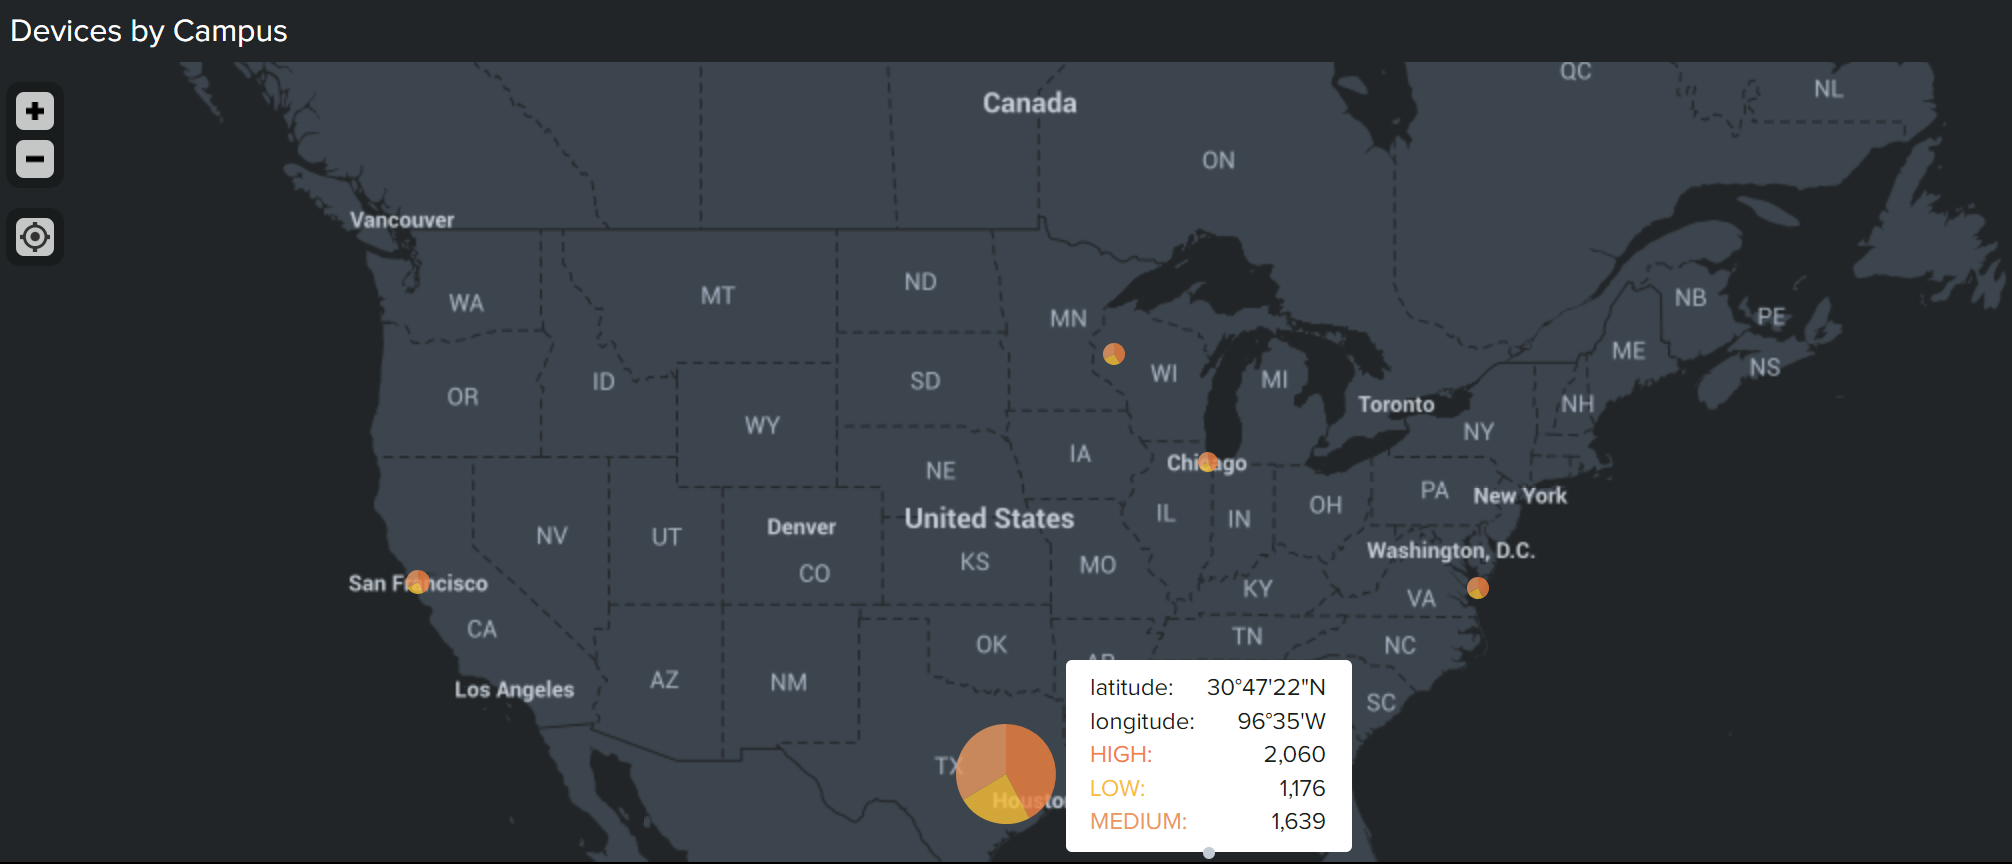
- Devices by campus. If your campuses are geographically dispersed, a heatmap can bring to your attention connection attempts or successful connections/communications from a source other than a campus.
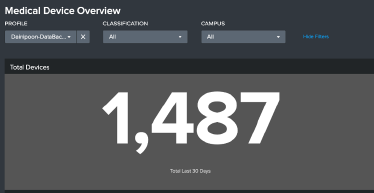
Medical device overview
On this dashboard, you might want to include visualizations for searches that provide the following information:
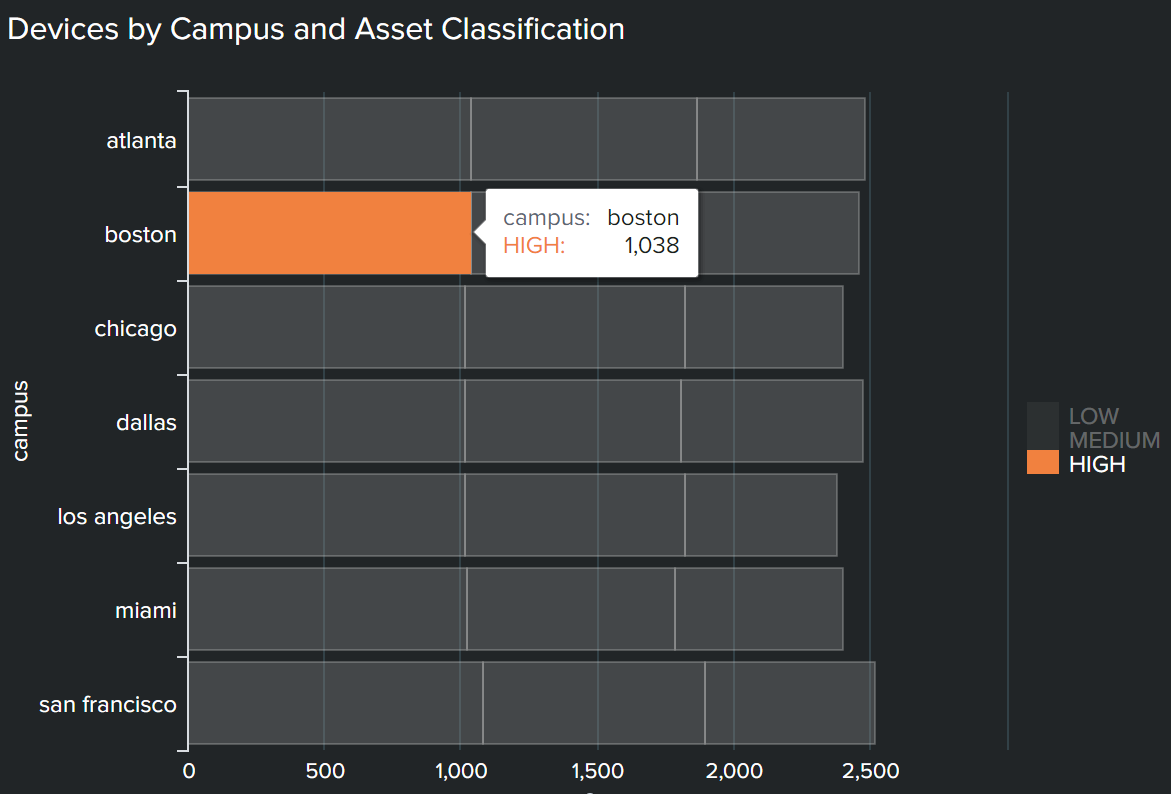
- Total devices and Devices by campus and asset classification. You can configure filters on this dashboard so that you can drill down into a specific device profile. When you select a profile, you can see the number of medical devices communicating with that profile, as well as visualize the categorization and connection by campus location.
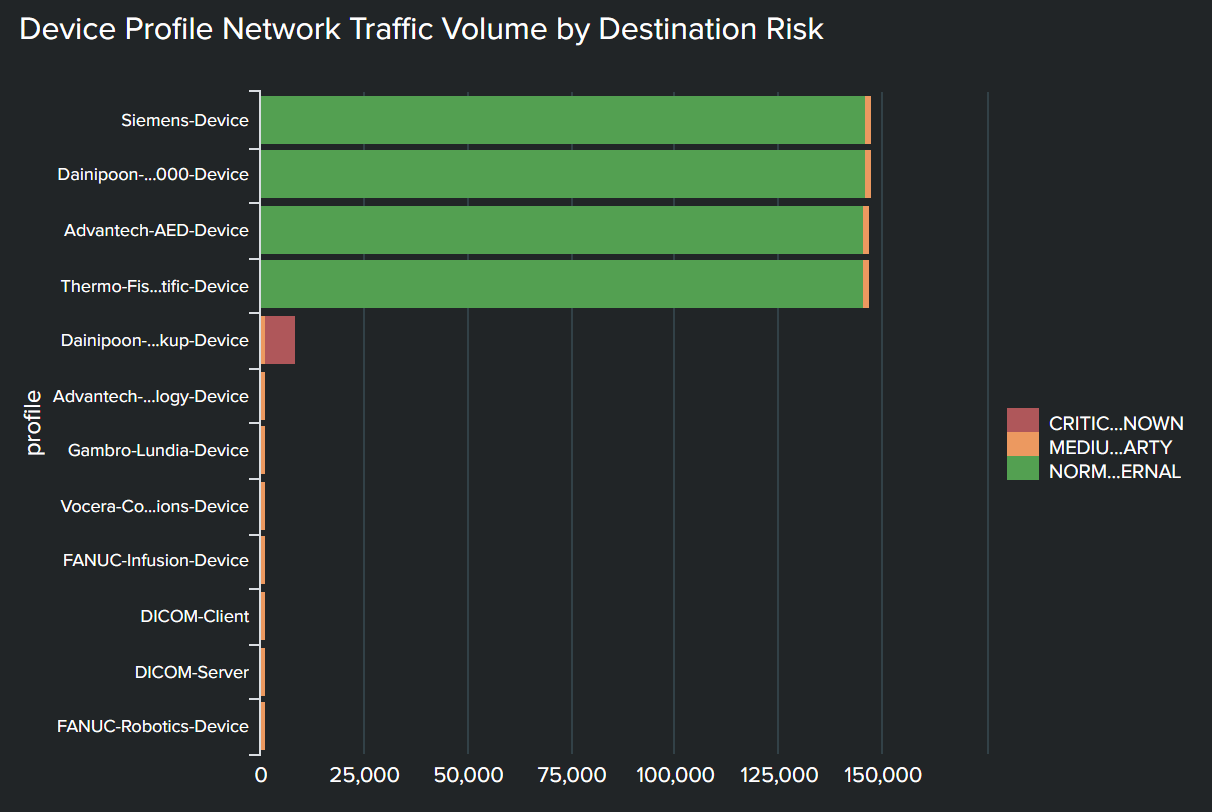
- Device profile network traffic volume by destination risk. This panel provides you with visibility into applications and destination IPs communicating with devices. Color coding also carries a meaning:
- Green means traffic and communications are normal, with devices only communicating with clinical applications that they should be
- Orange represents traffic and communications with outside IP addresses that device is authorized to communicate with but should be monitored closely
- Red represents where the device should not be communicating with the IP address at all, for example, malicious IPs outside the firewall
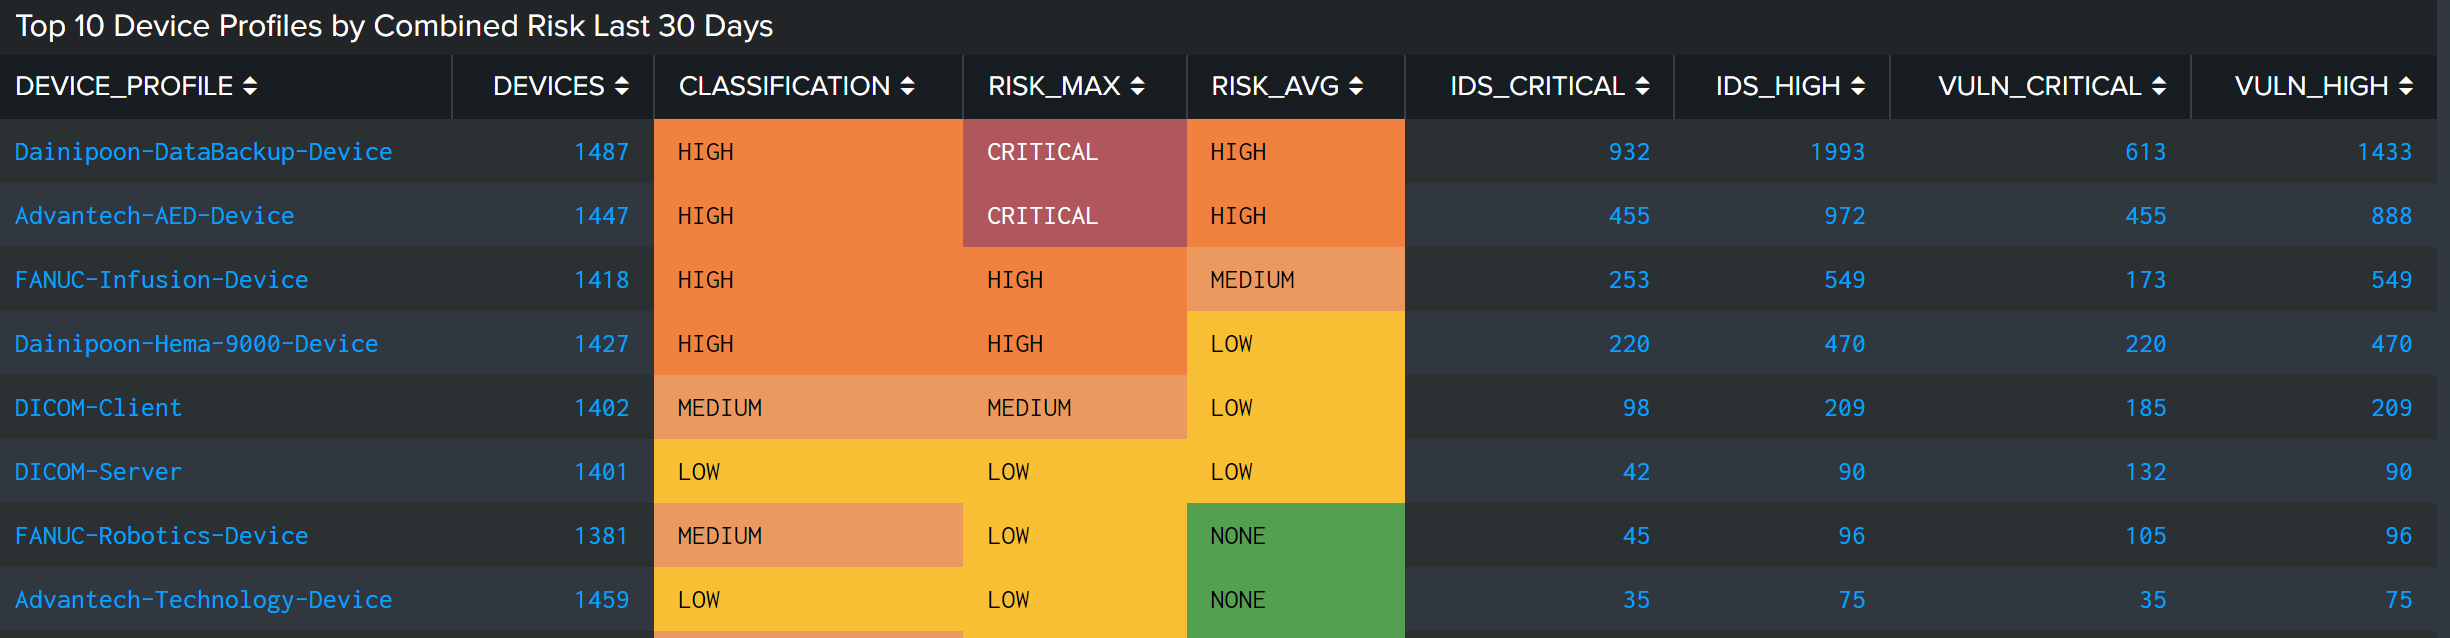
- Top 10 device profiles by combined risk last 30 days. As you start analyzing the profiles of devices, you can see a breakdown of the IDS attacks and distinct vulnerability counts showcased on the executive dashboard. You can see exact counts tied to the critical devices you are investigating, and drill further into each notable event. Doing so will help you determine if IDS and vulnerabilities persist on these devices and have yet to be mitigated by the engineering team.
Medical device network traffic flow analysis
On this dashboard, you might want to include visualizations for searches that provide the following information:
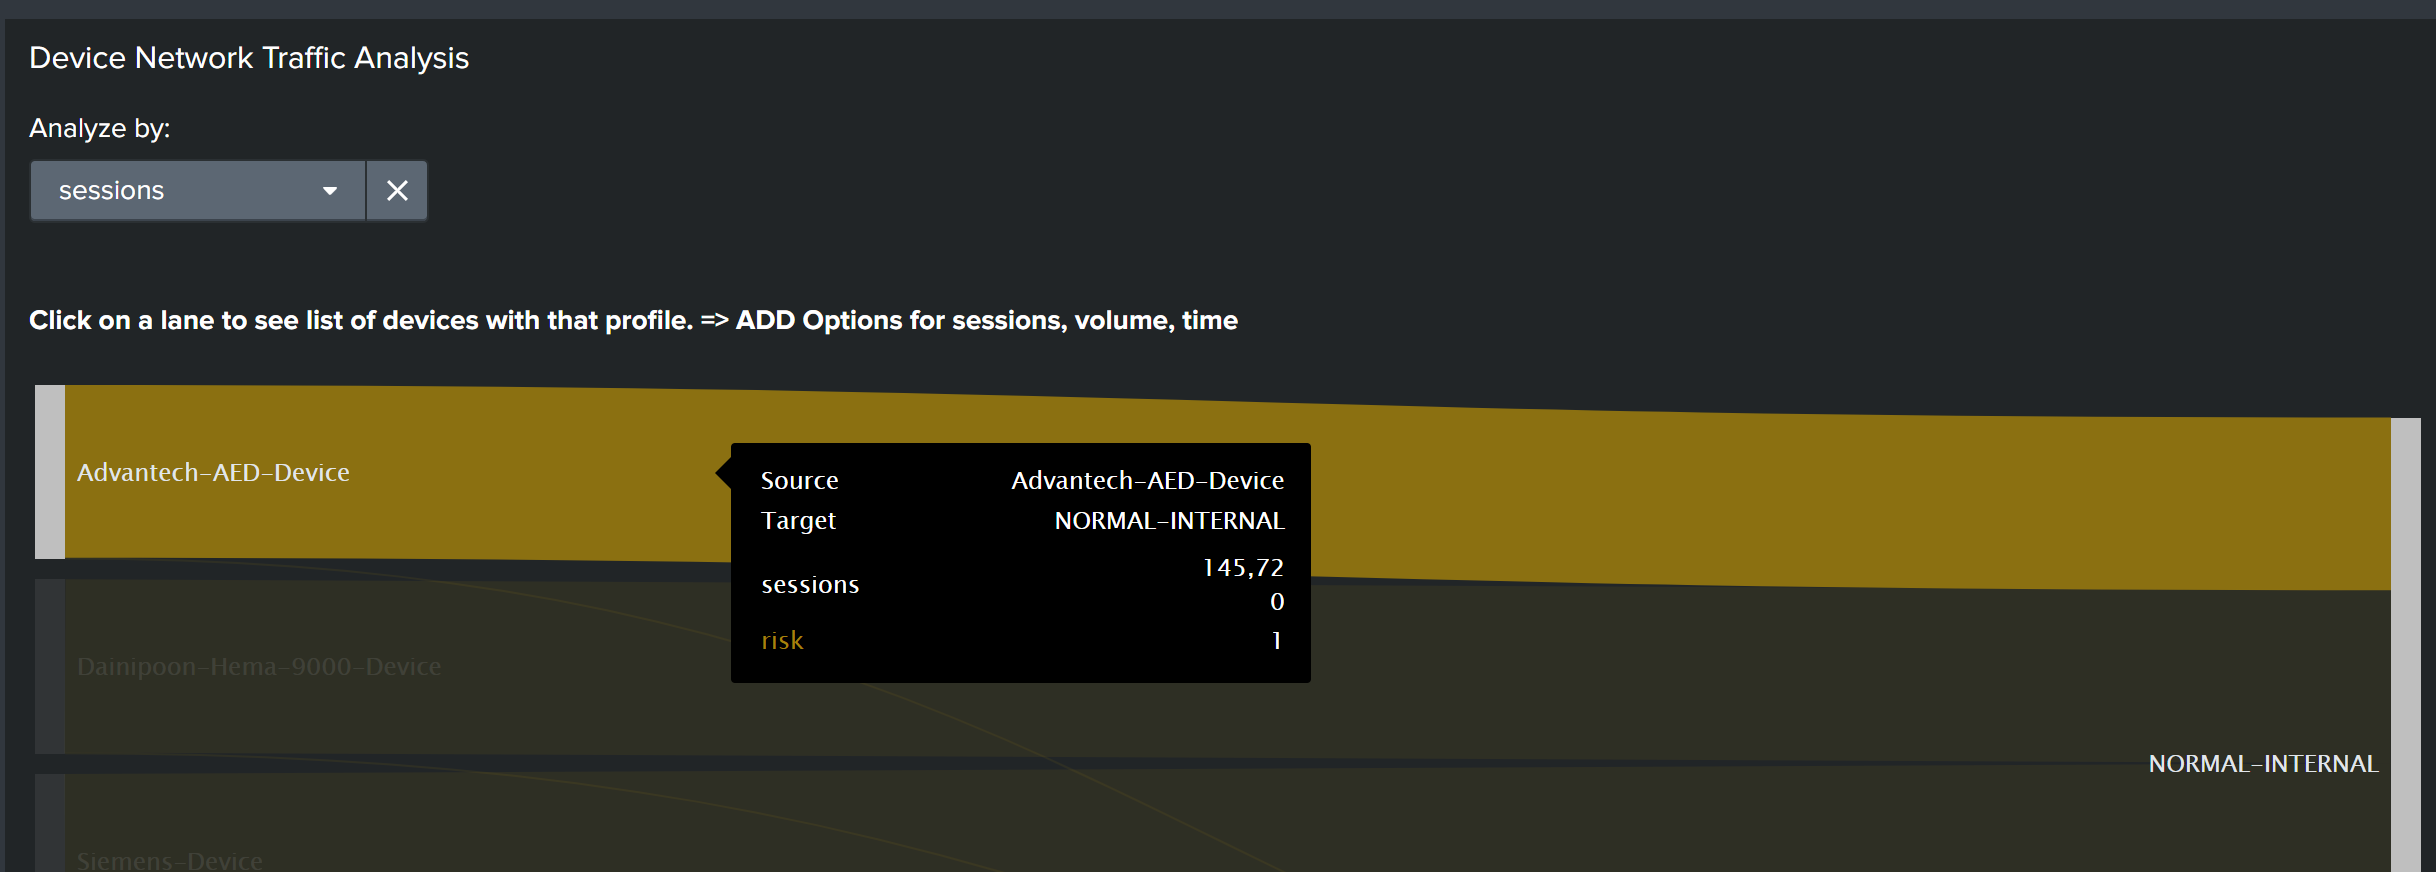
- Device network traffic analysis. Use this visualization to see key session and risk information for each device profile. You can create a sorting field to analyze the profiles by session, time, or traffic volume.
- Device and destination list. This chart can help you drill into network traffic flow analysis. This example shows there is one, “12.34.43.21” unknown IP that the Dainipoon-DataBackup-Device is communicating with. The chart shows the volume of data that is being transmitted, the number of sessions initiated, and the length of time for each active session. Engineering teams can use this information to decide whether to take this device offline completely or work with a manufacturer to apply patches to fix the vulnerabilities.

Next steps
If you are not currently using Splunk software for medical device security and would like more information, you can contact sales to discuss your environment and assess your requirements.
If you are a current customer in the healthcare industry, most customers have OnDemand Services per their license support plan. Engage the ODS team at OnDemand-Inquires@splunk.
Finally, these additional Splunk resources might help you understand and implement this use case:
- Resources: Healthcare and life sciences
- Video: Patient flow and medical device security
- Splunk Docs: Dashboards and visualizations