Creating SLOs and tracking error budgets with SignalFlow
Service Level Objectives (SLOs) and other measurements of service levels (such as Service Level Indicators or Service Level Agreements) are important metrics for DevOps teams and ITOps analysts. SLOs are used by a number of different teams in your organization for different purposes:
- Application teams use them to measure the success or failure rates of various services
- DevOps and ITOps teams use them to set aspirational goals for services
- DevOps, Operations, and Management use SLOs as a common framework to understand long-term service health
SLOs are most often concerned with trends over time, so it's important that you can track SLOs like error minutes, monthly budgets, and availability per quarter. In order to set appropriate SLOs, you need to use charts, which track trends over time, and alerts, which notify you of events in time.
You also need to use SLO error budgets, which allow you to budget a certain amount of downtime or “error minutes” to each service. Error budgets allow you to better prioritize work on operational health versus new features.
You can use SignalFlow to both create SLOs and track your error budgets.
Data required
How to use Splunk software for this use case
Create the SLO
Create your SLO by stating the conditions that need to be met and the alerting criteria that accompany them.
In the example of creating an SLO to track downtime minutes, if you identify that you need a way to mark times when your service traffic dips below a 99% success rate, you'd need an alert on whatever "success rate" means to you. If you decided you wanted to mark times when your service traffic dips below a 99% success rate, tracking those events in minute-long increments or downtime minutes, you'd need a way to force alerts to happen every minute while in an alerting state.
From there, you might want to use your measure of downtime minutes and track them on a monthly or quarterly basis against a budgeted number of downtime minutes, meaning you'd need to take the count of those minute-long alerts and compare it against a constant number (the budgeted number of downtime minutes).
You can use SignalFlow to create these minute-long alerts, and track the number of alerts in a time period.
Create an alert
You can use SignalFlow to track alerts as a timeseries using the `alerts()` function to count the number of alerts during a period of time.
This requires:
- An alert that only goes off for one minute at a time.
- During long stretches of time where the alert would be triggered, configure it to turn on and off every minute.
- You'll likely use a rate for this alert. Error rate is the most common.
- A charting method that can manipulate alert data and use stats functions on it. This includes a way to reset the “count” of monthly, quarterly, weekly, etc.
Here is an example of a SignalFlow function to produce an alert that will fire once every minute that a metric is breaching the alertable threshold:
filter_ = filter('sf_environment', '*') and filter('sf_service', 'adservice') and filter('sf_kind', 'SERVER', 'CONSUMER') and (not filter('sf_dimensionalized', '*')) and (not filter('sf_serviceMesh', '*'))
A = data('spans.count', filter=filter_ and filter('sf_error', 'false'), rollup='rate').sum().publish(label='Success', enable=False)
B = data('spans.count', filter=filter_, rollup='rate').sum().publish(label='All Traffic', enable=False)
C = combine(100*((A if A is not None else 0)/B)).publish(label='Success Rate %')
constant = const(30)
detect(when(C < 98, duration("40s")), off=when(constant < 100, duration("10s")), mode='split').publish('Success Ratio Detector')
This table provides an explanation of what each part of this function achieves. You can adjust this example based on the specifics of your environment.
| SignalFlow function | Explanation |
|---|---|
filter_ = filter('sf_environment', '*') and filter('sf_service', 'adservice') and filter('sf_kind', 'SERVER', 'CONSUMER') and (not filter('sf_dimensionalized', '*')) and (not filter('sf_serviceMesh', '*')) |
Define a filter. This example uses APM data, so this filter is mostly targeting down to a specific service, adservice. |
A = data('spans.count', filter=filter_ and filter('sf_error', 'false'), rollup='rate').sum().publish(label='Success', enable=False) |
Create a success rate. This is the inverse of error rate, used so you can get an alert if it goes below that number.
|
constant = const(30) |
Make a detector for downtime minutes or the minutes below the success ratio threshold.
The remainder of the alert criteria creates a trigger for when the success rate (C) is below 95% for 40 seconds. It also uses the
|
Create an error budget chart
Here is an example of a SignalFlow function to create a chart that tracks alert minutes. You can also specify to have the chart reset monthly so you know if your error budget for the month has been used up.
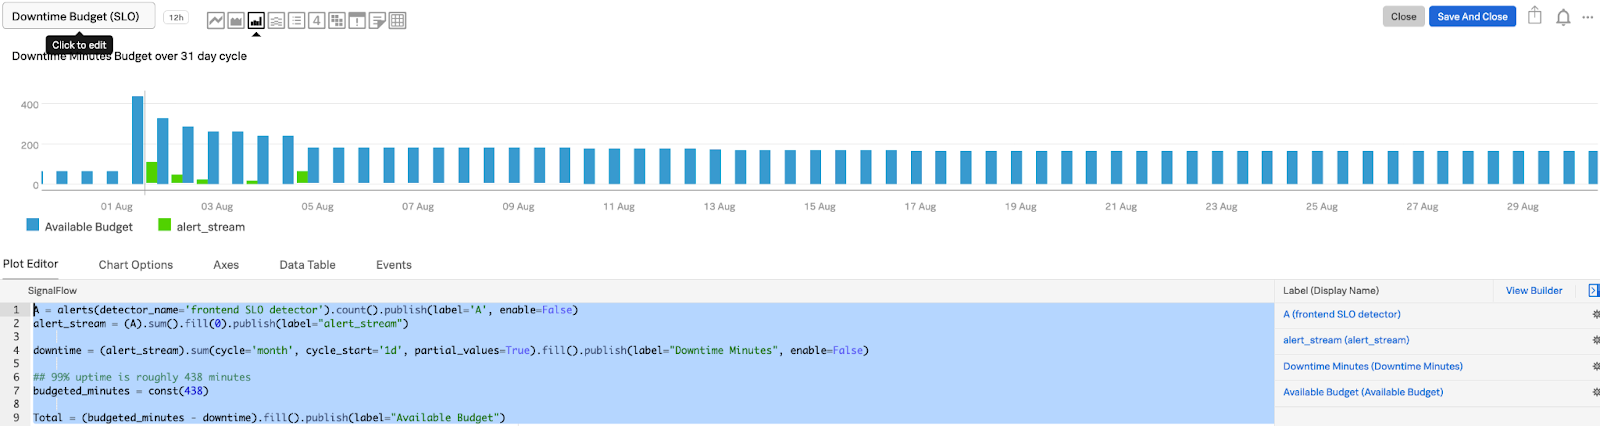
## Chart based on detector firing
AM = alerts(detector_name='THIS IS MY DETECTOR NAME').count().publish(label='AM', enable=False)
alert_stream = (AM).sum().publish(label="alert_stream")
downtime = alert_stream.sum(cycle='month', partial_values=True).fill().publish(label="Downtime Minutes")
## 99% uptime is roughly 438 minutes
budgeted_minutes = const(438)
Total = (budgeted_minutes - downtime).fill().publish(label="Available Budget")
This table provides an explanation of what each part of this function achieves. You can adjust this example based on the specifics of your environment.
| SignalFlow function | Explanation |
|---|---|
## Chart based on detector firing |
Define a metric stream from the detector you created previously. Take the alert stream and sum it. |
downtime = alert_stream.sum(cycle='month', partial_values=True).fill().publish(label="Downtime Minutes") |
Create a downtime minutes stream. Sum the summed alert stream with a cycle= of month/week/etc and allow partial_values just in case. Use |
budgeted_minutes = const(438) |
Create a constant for the number of minutes in our “error budget” or “downtime budget”. |
Total = (budgeted_minutes - downtime).fill().publish(label="Available Budget") |
Create the total available budget. Subtract the downtime stream from the budgeted minutes constant value. Use |
Next steps
The resulting chart looks like this:
You can also achieve the same results by using Terraform.
The content in this article comes from a previously published blog, one of the thousands of Splunk resources available to help users succeed. In addition, these resources might help you understand and implement this guidance:
- GitHub: SignalFlow repo
- GitHub: Observability-Content-Contrib repo