Using the Splunk platform to monitor key horse-related data points
Most people consider Splunk a tool for solving problems in complex digital infrastructures. Companies around the world use Splunk software to help their security, IT and DevOps teams keep their organizations securely up and running so the business can continue to innovate and deliver for its customers.
However, almost every hobby imaginable today involves data of some sort. Any time you use an app to facilitate a hobby, data is generated. And all data can be Splunked. If you are using multiple devices, the various data sources can be ingested into the Splunk platform and then used to create dashboards that will help you run analyses and make correlations to improve your performance or output.
This fun sample use case shows a number of ways that the Splunk platform can be used to monitor key data points related to horses, such as their water consumption and their gait.
Example data sources
| Data source | Used for tracking |
|---|---|
| GPS (ESP32, RasPi, etc.) |
Movement of the horse
|
| Flowmeter (water sensor) | Liters of water drunk by the second when the horse is in a holding area |
| Weather data | Outdoor temperature |
| Riding tracking app (such as Equilab) |
|
Use case sample search results
While most Splunk Lantern articles offer step-by-step guidance so you can implement the use case in your environment, the variety of applications and devices and their related source types is too great to offer that sort of information here. This article shows charts only as consideration for what you might be able to do with your Splunk instance that you aren't doing now.
How much water a horse drinks per day
These daily values can be compared to an average to help assess potential health issues. You can also bring in weather data as an additional data point to understand the effects of certain weather types on water consumption to get an idea of when a seeming outlier might actually be normal.


When weather affects available water for horses
This chart uses the following data points from multiple sensors:
- Brown line: Temperature over time
- Purple bars: How many liters a horse drank at a point in time
- Pink bars: How many attempts at drinking a horse made
The green and orange bars are when the horse was not in the stable because it was out being ridden or walked.
Here, the owner could see that when the temperature went below 0°C, it took nearly two hours until the water in the pipes froze, roughly 22:00 - 0:00. Then, from 0:00 until nearly 11:00, the horse made multiple attempts to drink, but couldn't because the water was frozen. Finally, the owner would learn from this chart that it took nearly two hours after the temperature rose above 0°C for the ice in pipes to thaw and water to become available to the horse again.

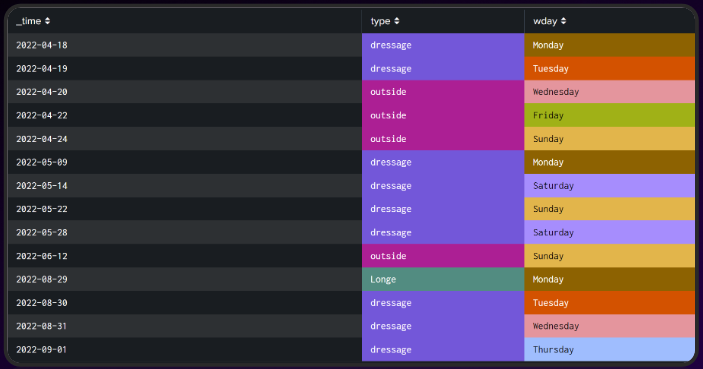
How much exercise a horse gets on a given day
This data can be split out by gait or by location, for example, pasture versus walker.

The distance a horse goes can also be charted in comparison to the temperature to ensure they aren't overworked on very hot days.

How many beats per minute a horse gets at each gait
Different gaits have different beats, which are footfalls or combinations of footfalls before all four hooves have touched the ground and the cycle of the gait starts again. The beats per minute metric can help show how fast a horse was going, in comparison to its other gaits or to other horses at the same gait.

Predicting training
A ride tracking app, such as the one shown in the screenshots below, can show patterns. In the first screenshot, the horse was trained by a rider. The ride used the whole length of the hall and went in all sorts of directions. In the second screenshot, the lines go in circles because the horse was moving on a rope in an exercise called longing. A human can easily see the differences and follow the movement of the horse.

However, an IT system needs to learn what the horse is doing. To train the system you can take each data point during the ride and calculate the average from the center point for the whole ride. For longing, that center point is highly centralized from each data point because the horse moves in a circle. But for riding, the center point becomes more like a line, which teaches the system that the horse was being ridden rather than longed. Then you can chart that data in the Splunk platform.
Finally, by integrating with the Splunk Machine Learning Toolkit, the owner could classify future training types based on the previous data set, without having to redo the calculations each time.

Next steps
You can go beyond the capabilities of the Splunk platform and add in Splunk ITSI (ITSI) to manage your entire horse stable operation. On the left-hand side, each horse has been added to ITSI as a service. Each "service" can then have KPIs, for example, water consumption, how many kilometers the horse walked in a given day, whether the walk was in the walker, in the pasture, or in a training session, and more. On the right-hand side are the facilities. The owner could track how many people or horses are already in the halls, how much space is needed by training type, times when the halls are very empty, or when there is maintenance ongoing. They could also add a schedule for the walker since there are only eight slots available on it at any given time.

We hope you enjoyed this non-traditional Splunk Lantern use case and that it inspires you to think about how you might use the Splunk platform in non-traditional ways. Here are a few additional creative uses of Splunk software that might interest you:
- Splunk Blog: 10 Years of Listens: Analyzing My Music Data with Splunk
- Splunk Blog: Monitoring Family Pickle Consumption with Splunk!
- Splunk Ebook: Surfing. Beehives. Beer.