Monitoring AWS Relational Database Services
You've got your AWS Cloud data into Splunk Observability Cloud, and now you’re looking to answer some questions as it relates to Amazon's Relational Database Services (RDS).
- How can you keep track of the instances deployed in AWS by class? This is important if you're responsible for system availability, performance, and cost-effectiveness.
- How can you keep control of provisioning database engines that do not adhere to company policy?
- How can you monitor the read performance of RDS database instances and notify the database support team? Degradations can impact your critical applications and end user experience.
- How can you monitor the write performance of RDS instances? Write latency and write throughput are key metrics you need to keep an eye on.
- How can you monitor system performance metrics for each RDS database instance? You need to monitor CPU% utilization, read-write latency, network throughput, and disk IOps to make sure the type of RDS instance has enough capacity provisioned and is not over-provisioned.
Data required
About AWS RDS
RDS is an Amazon cloud hosted managed services for databases. This means that Amazon handles most of the management tasks for sustaining the database instances. The application developers can then focus on the application, and the users can focus on providing value to the business.
Each RDS Database instance contains a database (DB) engine that is specific to relational database software. Amazon RDS currently supports MySQL, MariaDB, PostgreSQL, Oracle, and Microsoft SQL Server.
- ► Learn about RDS properties and UI basics in Splunk Infrastructure Monitoring
-
Splunk Infrastructure Monitoring scans every RDS database instance for your AWS accounts and imports the properties of each instance plus any tags set on each instance, as shown in the table below. Engine and engine version properties are included in this table.
RDS Name Custom Property Description AvailabilityZone
aws_availability_zone
Name of the DB instance Availability Zone
DBClusterIdentifier
aws_db_cluster_identifier
If the DB instance is a member of a DB cluster, contains the name of the DB cluster
DBInstanceClass
aws_db_instance_class
Name of the compute and memory capacity class of the DB instance
DBInstanceStatus
aws_db_instance_status
Current state of the DB instance
Engine
aws_engine
Name of the database engine this DB instance uses
EngineVersion
aws_engine_version
Database engine version.
InstanceCreateTime
aws_instance_create_time
DB instance creation date and time
Iops
aws_iops
New Provisioned IOPS value for the DB instance. AWS might apply this value in the future, or might be applying it at the moment.
MultiAZ
aws_multi_az
Indicates if the DB instance is a Multi-AZ deployment
PubliclyAccessible
aws_publicly_accessible
Accessibility options for the DB instance. “true” indicates an Internet-facing instance with a publicly resolvable DNS name that resolves to a public IP address. “false” indicates an internal instance with a DNS name that resolves to a private IP address.
ReadReplicaSourceDBInstanceIdentifier
aws_read_replica_source_db_instance_identifier
If the DB instance is a Read Replica, this value is the identifier of the source DB instance.
SecondaryAvailabilityZone
aws_second_availability_zone
If this property is present, and the DB instance has multi-AZ support, this value specifies the name of the secondary Availability Zone.
StorageType
aws_storage_type
Storage type associated with the DB instance
Each DB engine has its own supported features, and each version of a DB engine may include specific features. Additionally, each DB engine has a set of parameters in a DB parameter group that controls the behavior of the databases that it manages.
The following image shows the UI when RDS is selected from the AWS Navigation in Splunk Infrastructure Monitoring. You can see a quick view of the instances with the provided heatmap or an instance list.

You can also group common RDS database instances by various options such as region, state, AWS tag name, and more. In the following image, you can see that the instances have been grouped by AWS region, so you can then see separate heat maps for each AWS region.
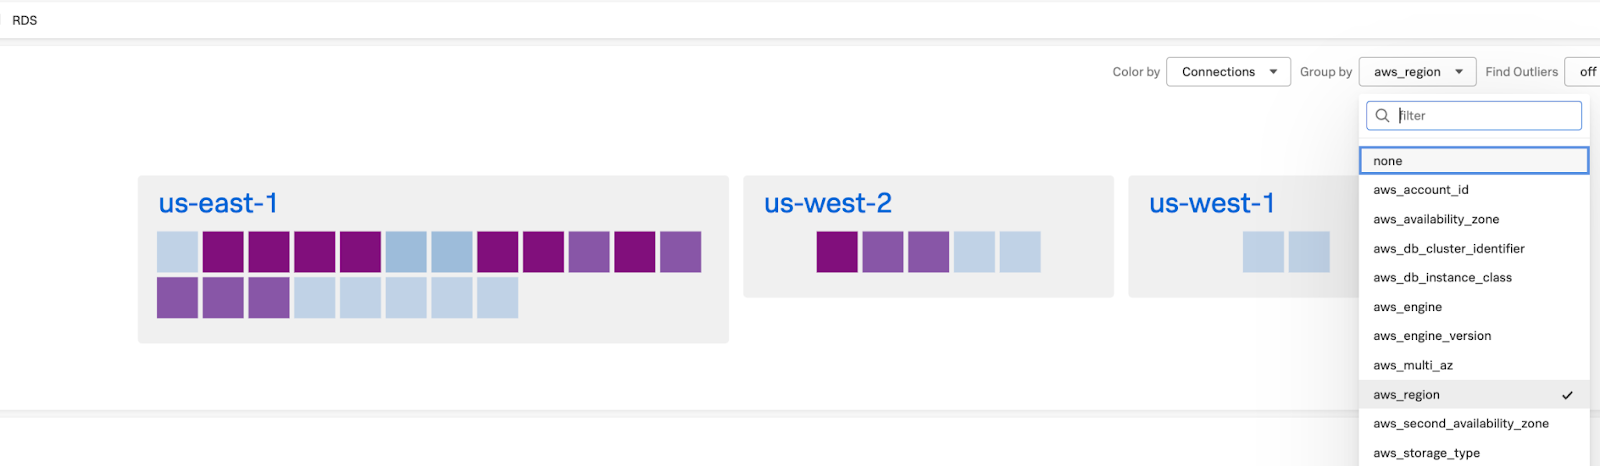
You can also hover over any instance in the region and click to drill down deeper and explore more metrics.

How to use Splunk software for this use case
- Monitoring RDS database services instances
- Monitoring RDS database performance metrics
- Monitoring RDS system metrics
Best practices for creating and managing detectors
- Before developing detectors, spend some time writing down your requirements and expected outcomes.
- Apply good naming conventions to detector names. Configure detectors and alert messages in a standard way. Establish operational practices, policies, and governance around standards.
- Make sure each detector alert has a clear SOP (Standard Operating Procedures) documented. This drives operational excellence.
- Use critical severity sparingly and only under special conditions requiring the highest level of intervention. Consistent standards are also important so that severity levels are interpreted in a consistent way by all consumers.
- Detectors require validation and ongoing tuning to remain relevant. Establish best practices around managing the lifecycle of a detector, from initial creation and onboarding to archiving or decommissioning.
- Make sure detectors are validated and well-tuned before turning on the production operations notifications. Think of assigning operational recipients in Splunk Infrastructure Monitoring as a move to production.
- High quality alerts are key to driving operational excellence and value back to the business.
Next steps
Still having trouble? Splunk has many resources available to help get you back on track.
- Splunk Community: Ask your question to the Splunk Community, which has provided over 50,000 user solutions to date.
- Splunk Customer Support: Contact Splunk to discuss your environment and receive customer support.
- Splunk Education: Comprehensive Splunk training to fully unlock the power of Splunk Observability Cloud.