Monitoring RDS database performance
This article introduces you to some of the different AWS RDS database performance metrics you might want to monitor:
The procedure you'll use to create a detector in Splunk Infrastructure Monitoring to monitor these metrics is the same regardless of the metric you want to monitor. You can jump straight to Creating a detector to monitor RDS performance metrics to see how it's done.
The charts you'll see in Splunk Infrastructure Monitoring, which give you metrics for database performance, are displayed with percentile distributions. Percentiles are often more useful than averages because outliers can misrepresent the typical performance.
Each of the metrics described below is accompanied by its chart in Splunk Infrastructure Monitoring. The graphs plot the minimum, P10 (or tenth percentile), P50 (otherwise known as median), P90, and maximum. The most prominent color in several of the screenshots below is pink, which is the maximum.
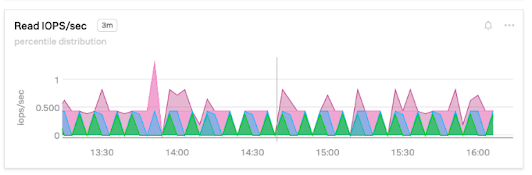
ReadIOPS
ReadIOPS shows how many disk read I/O operations per second your database has. They take longer than responses that are cached in memory, so you want this number to be as low as possible. If it’s too high, consider adding more RAM to your instances. You can add capacity by switching to SSDs with provisioned IOPS storage.
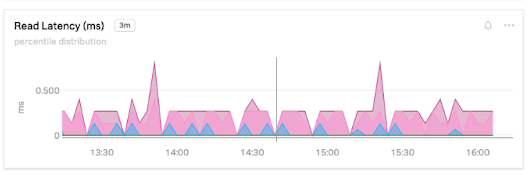
ReadLatency
Read performance is important for web applications because content is more often displayed than edited. Read latency can directly impact user experience by making pages faster to load. Because of this, optimizing reads can have a big impact on performance and cost-effectiveness.
Read latency is the amount of time it takes to respond to a read request such as a select statement. The lower this is, the faster that pages load and transactions complete. For the most simple reads, you want this to be in the tens of milliseconds. If it’s too high, take a look at your slow query log to determine which queries are taking the longest and then tune them for better performance.
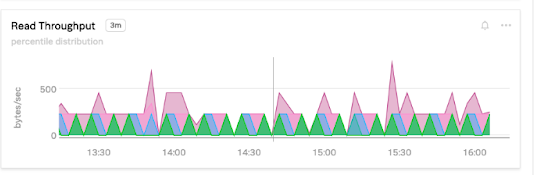
ReadThroughput
ReadThroughput shows how many bytes per second your database is reading from disk. Read throughput will be high if your application reads large volumes of data per request, or your responses are heavily cached. It can be lower if you have smaller data sizes, complicated queries that generate high latency, or slow magnetic disks.
Monitoring write performance is important to make sure that updates are immediately available or at least not far behind real-time. Also, if your database is heavily indexed, writes can be more resource-intensive. If you make heavy use of the query cache, lots of writes can lower your read latency.
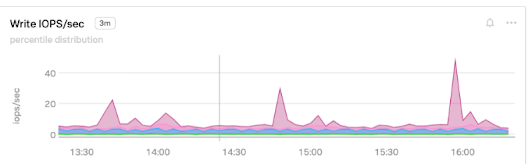
WriteIOps
The average number of disk write I/O operations per second. Your database writes many I/O operations to disk per second. If you need more, consider switching to SSDs with provisioned IOPS.
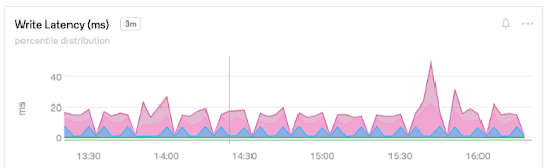
WriteLatency
Write latency is the time it takes to complete a write operation in the database, such as an insert, update, or delete. Low latencies are important for real-time applications. If you use read replicas, you should also check your ReplicaLag to make sure they are not too far behind.
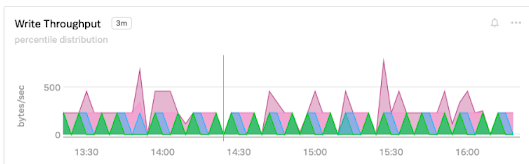
WriteThroughput
The number of bytes per second that you are writing into the database is write throughput. This can be lower if you use table indexes, table locking, foreign key constraints, or slow magnetic disks.
Creating a detector to monitor RDS performance metrics
The following steps can be used as an example of how to create a detector in Splunk Infrastructure Monitoring to monitor metrics relating to your RDS database instances. In this example, we'll create a detector for the WriteLatency metric.
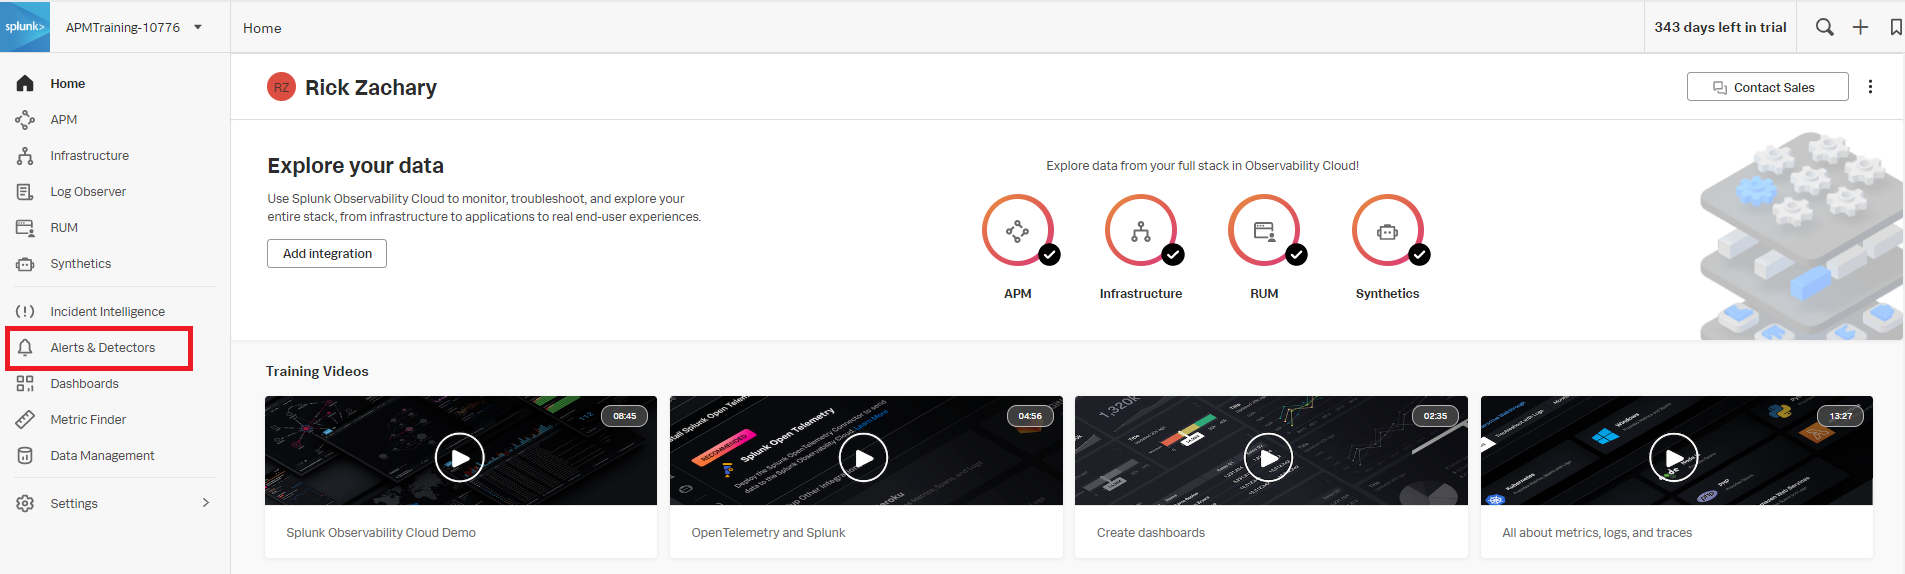
- In Splunk Observability Cloud, click Alerts & Detectors in the left navigation pane.
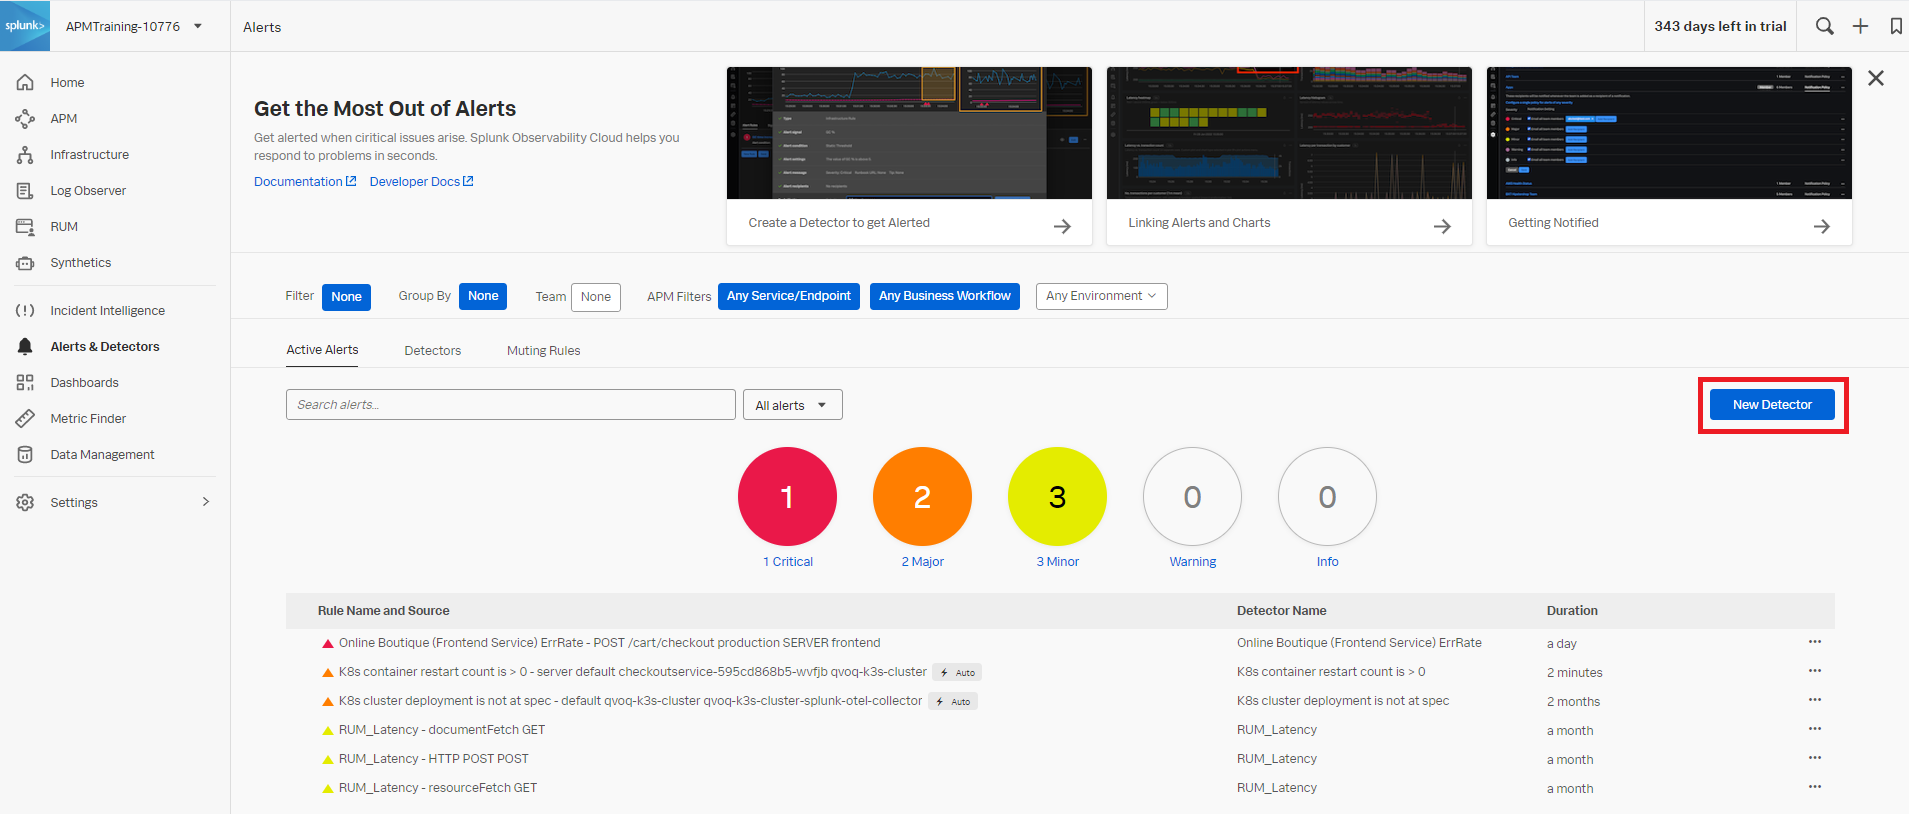
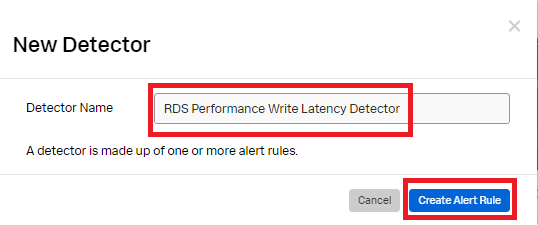
- Click New Detector.
- Enter the detector name and click Create Alert Rule.
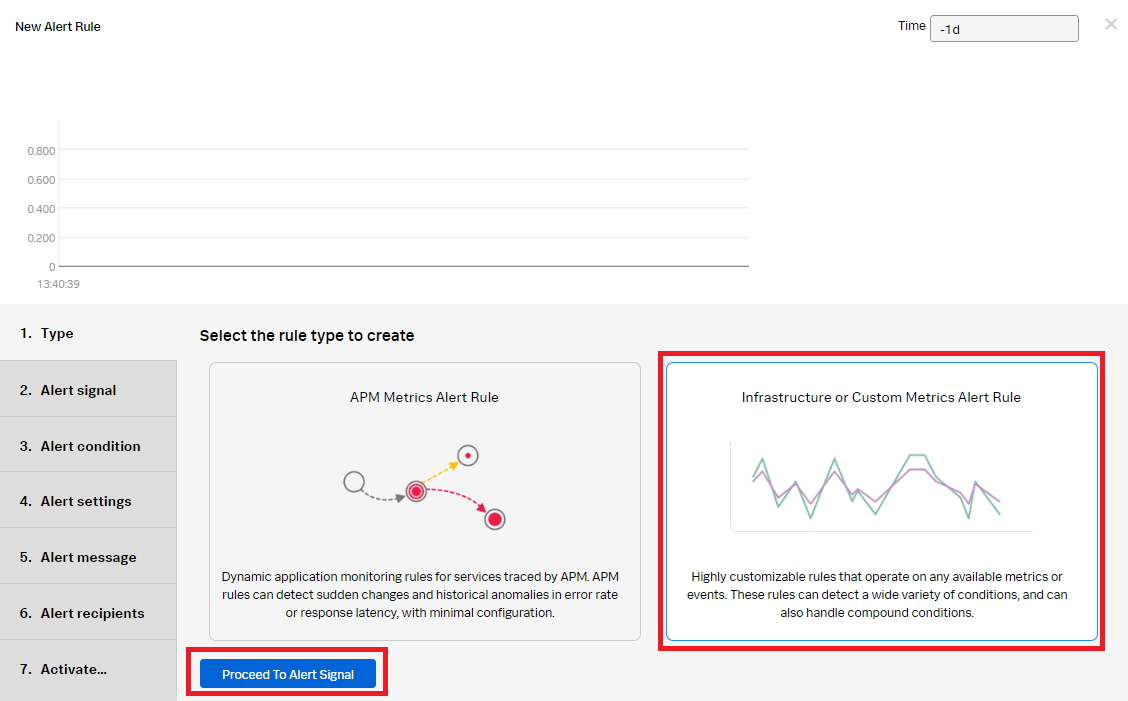
- Click Infrastructure or Custom Metrics Alert Rule and then click Proceed To Alert Signal.
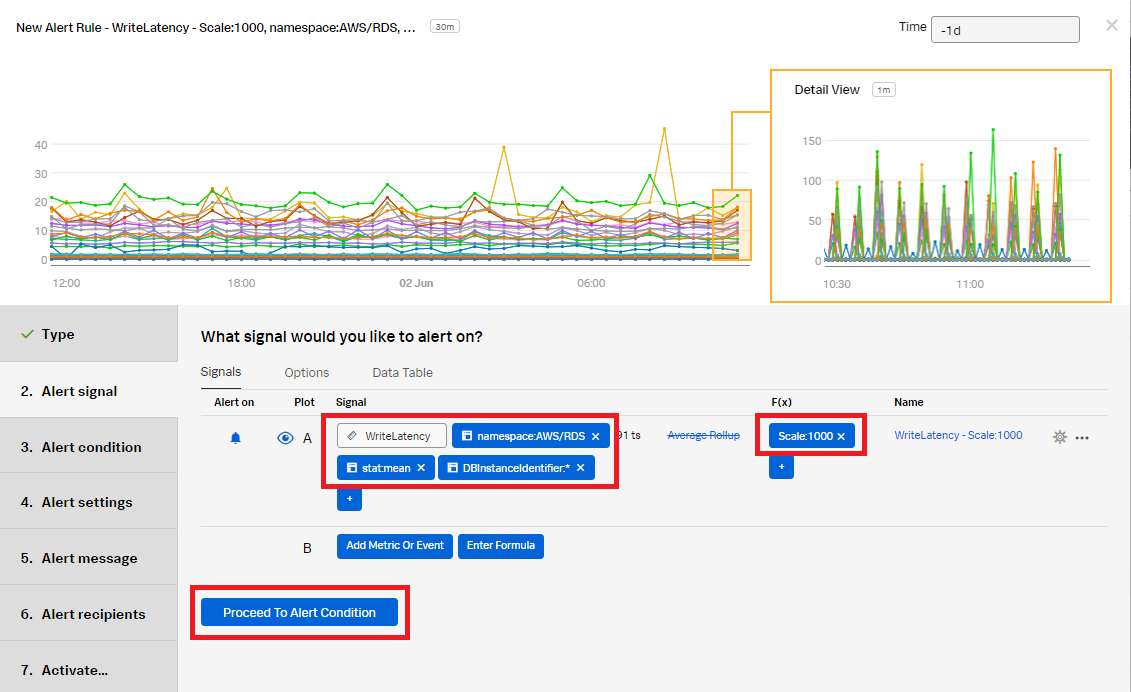
- In the Alert signal section, set the Signal metric as WriteLatency. Add the following filters:
- namespace: AWS/RDS
- stat: mean
- DBInstanceIdentifier: * (This includes any database with an instance identifier.)
- Click Add Analytics and set it as Scale with a value of 1000. Click Proceed To Alert Condition.
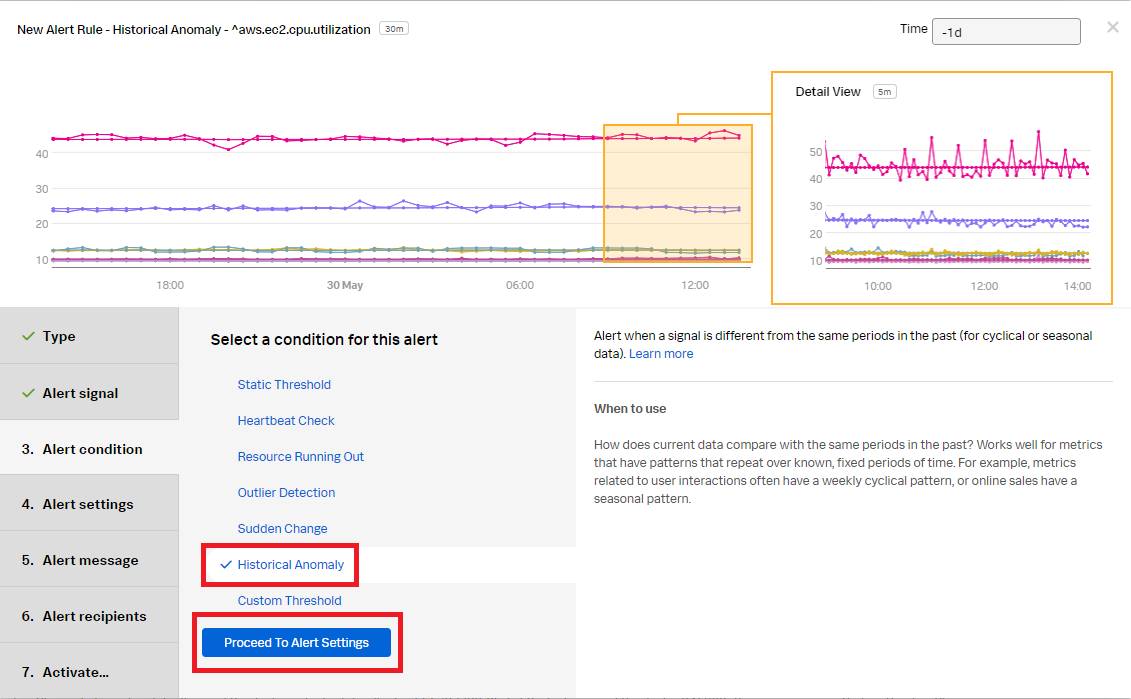
- In the Alert condition section, click Historical Anomaly to alert when the signal is different from the same period in the past. Click Proceed To Alert Settings.
- In the Alert settings section, use the default setting to alert when the count is too high, based on the threshold setting in advanced settings with a low sensitivity. Click Proceed To Alert Message.
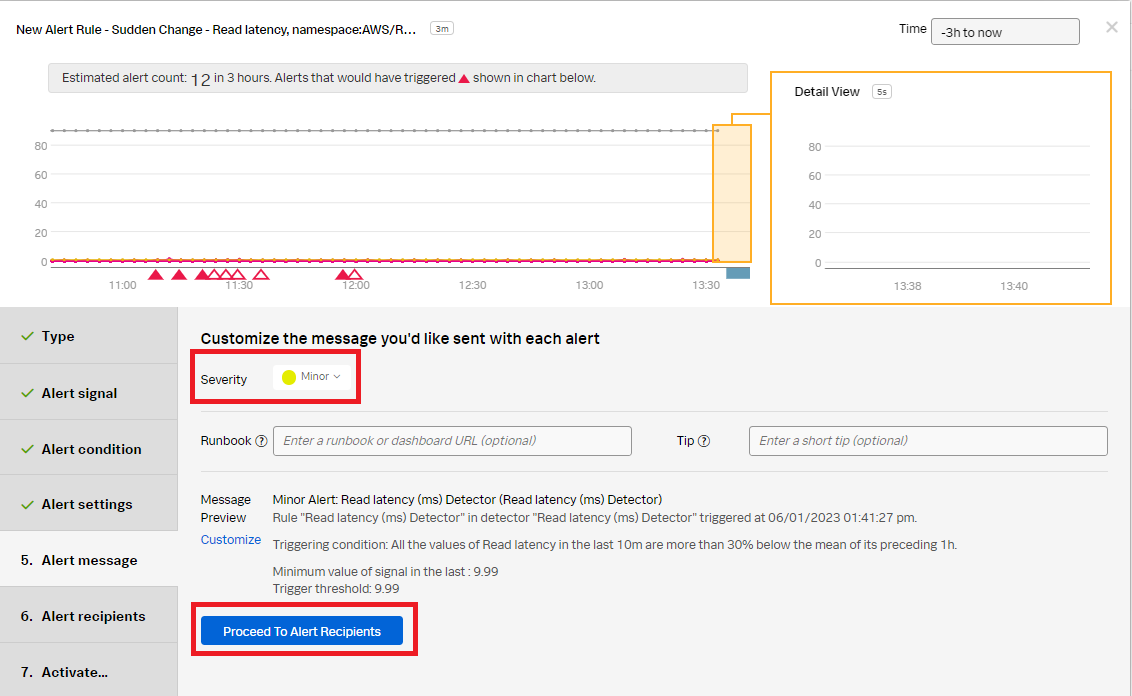
- In the Alert message section:
- Set the alert severity. You can choose from Critical, Major, Minor, Warning, or Info depending on the alert severity defined by your organization.
- (Optional) Enter a runbook or dashboard URL and a short tip for end user troubleshooting the alert.
- Customize the message by clicking Customize.
- Click Proceed to Alert Recipients.
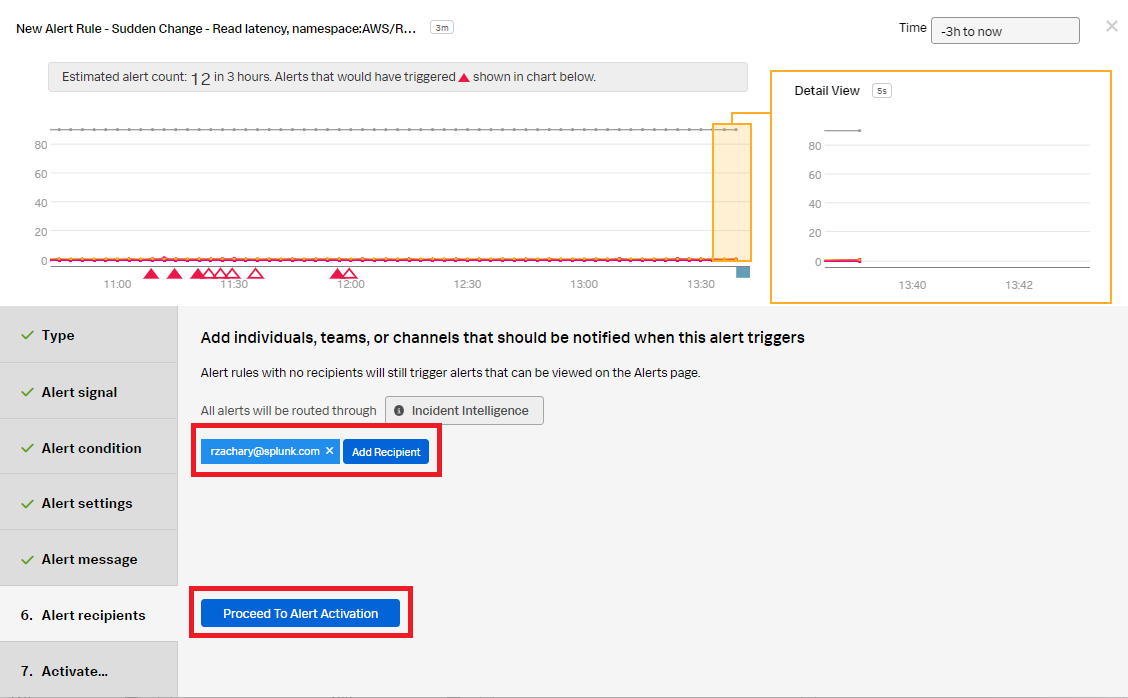
- In the Alert recipients section, select the recipients to send the Alert message to. You can add an email address, team, or webhook. Then click Proceed to Alert Activation.
- In the Activate section, click Activate Alert Rule.


You now have a detector that will send a notification when there is write latency for your RDS database instances.
Next steps
You might also be interested in other processes associated with the use case Monitoring AWS Relational Database Services.