Monitoring RDS database services instances
Monitoring the instances you deployed in AWS is essential to ensure system availability, performance, and cost-effectiveness.
This article shows you how to monitor the following:
Number of database instances
It's easy to add additional instances, but it’s expensive to leave them running when you don’t need them. For example, someone on your team might have added a read replica to do some analytics jobs, but then forgot to shut it down. Or you might have scripts in Elastic Beanstalk or other places that add new instances automatically or behave unexpectedly. It’s a good idea to set an alert to fire if the number of instances goes beyond a normal level.
Number of databases by class
One of the easiest ways to scale your database is by increasing the size of your instance. But doing this too many times will cost you a lot of money for large instances. Keep an eye on these instance types to make sure you’re not overspending. It’s also a good idea to set an alert to fire if the number of large database instance classes exceed a normal level.
- ► How to create a detector in Splunk Infrastructure Monitoring to monitor number of databases by class
-
The following steps can be used as an example of how to create a detector in Splunk Infrastructure Monitoring to monitor RDS database instances by class.
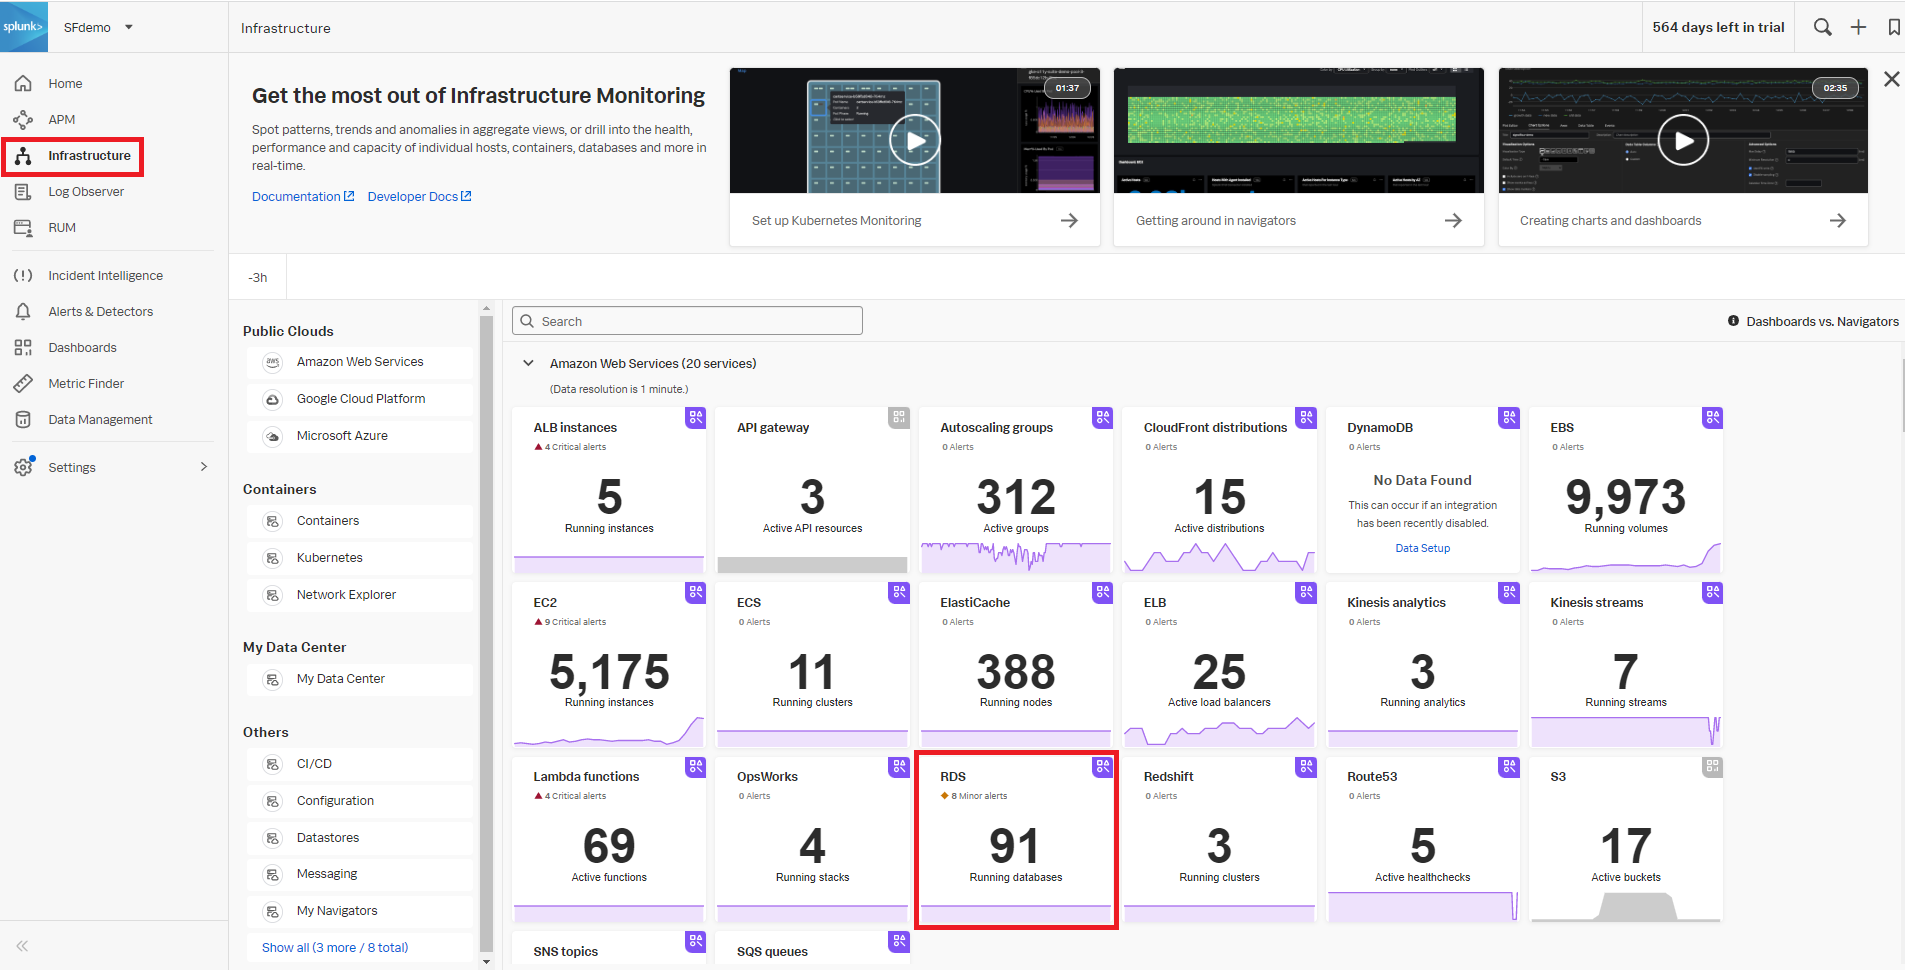
- In Splunk Observability Cloud, click Infrastructure in the left navigation pane. Under Amazon Web Services, click RDS to view the list of databases and their details.
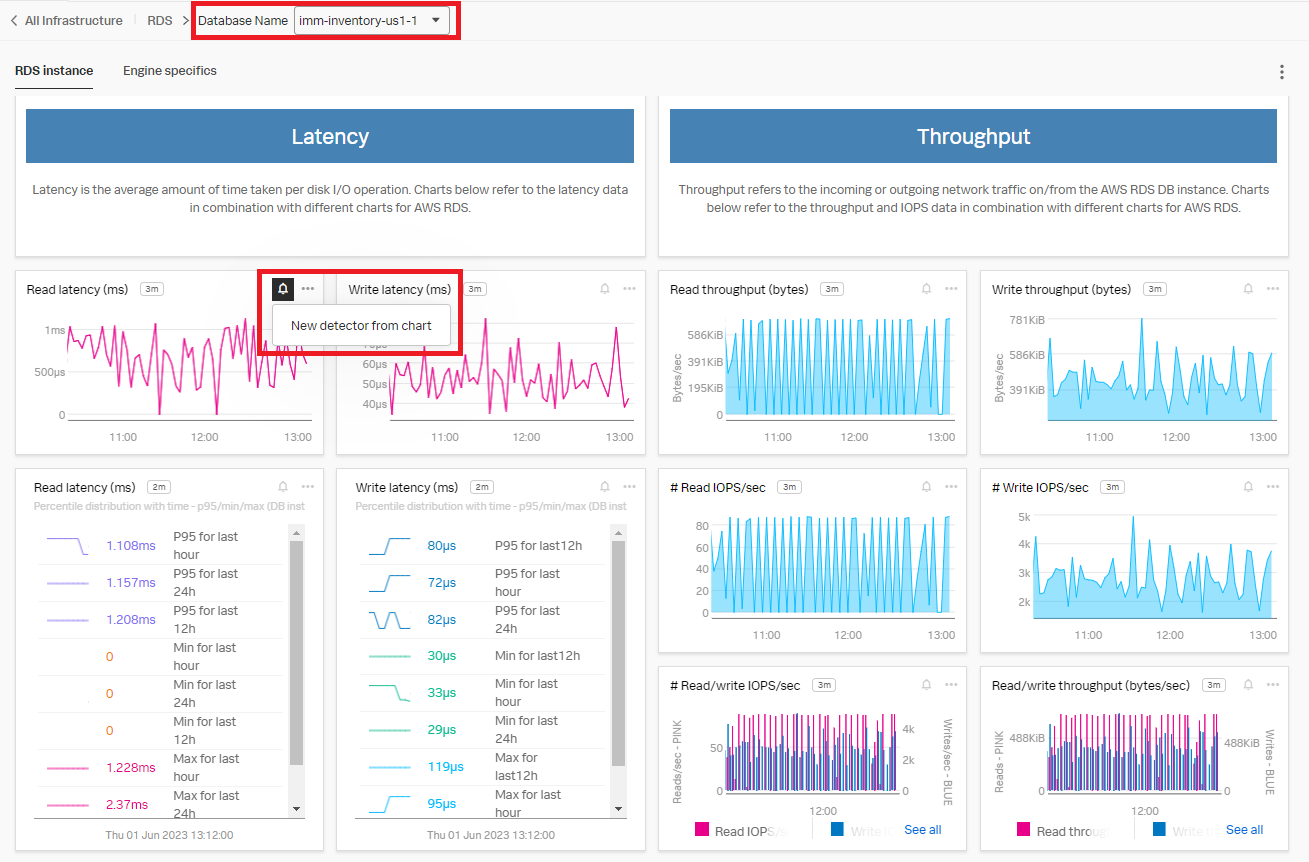
- Click a database instance to monitor in the drop-down field at the top of the screen. You can use the Read Latency (ms) chart as a template to create the new detector. Click the bell icon in the upper right of the chart, then click New detector from chart.
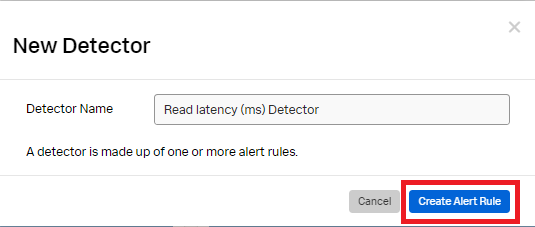
- Click Create Alert Rule in the New Detector pop-up.
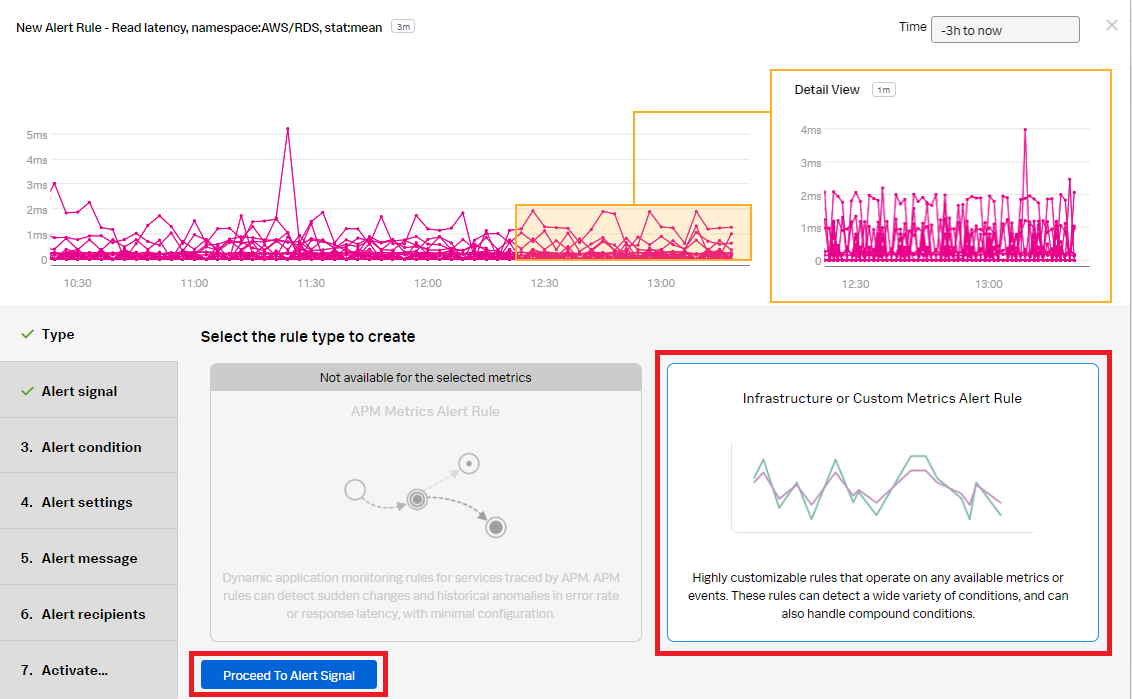
- In detector type, select Infrastructure or Custom Metrics Alert Rule, then click Proceed To Alert Signal.
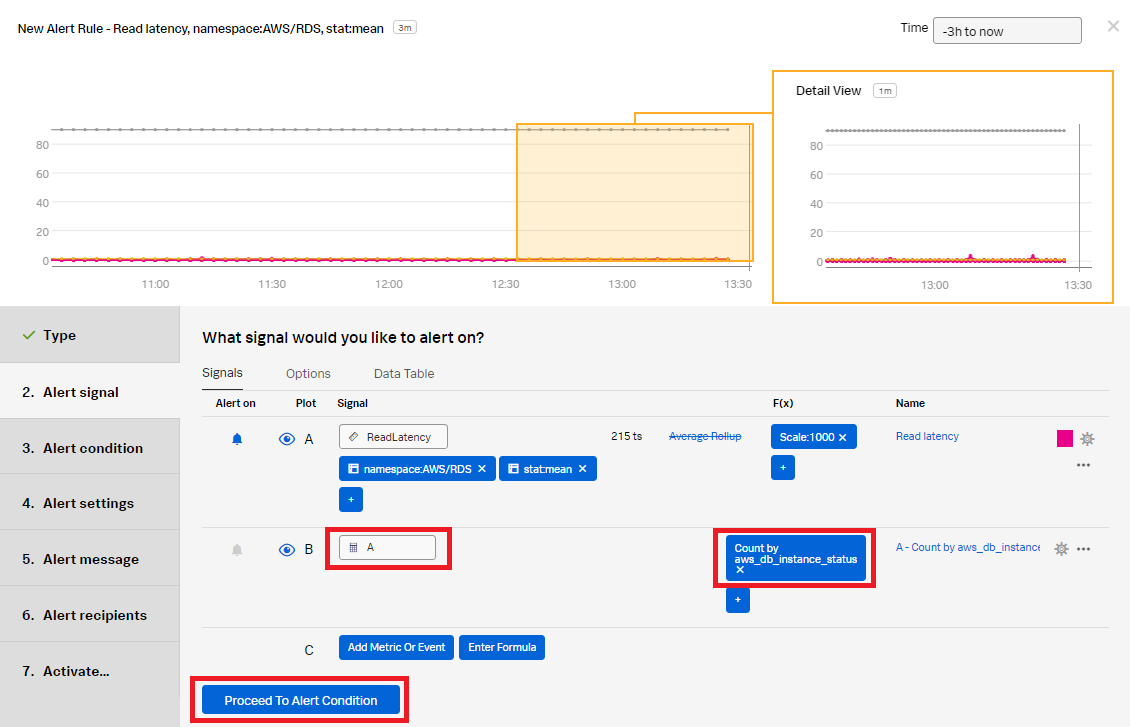
- In the Alert signal section:
- For Plot B, click Enter Formula. Enter "A" to reference the ReadLatency in Plot A.
- Click Add Analytics.
- Click Count and Group by aws_db_instance_status.
- Click Proceed To Alert Condition.
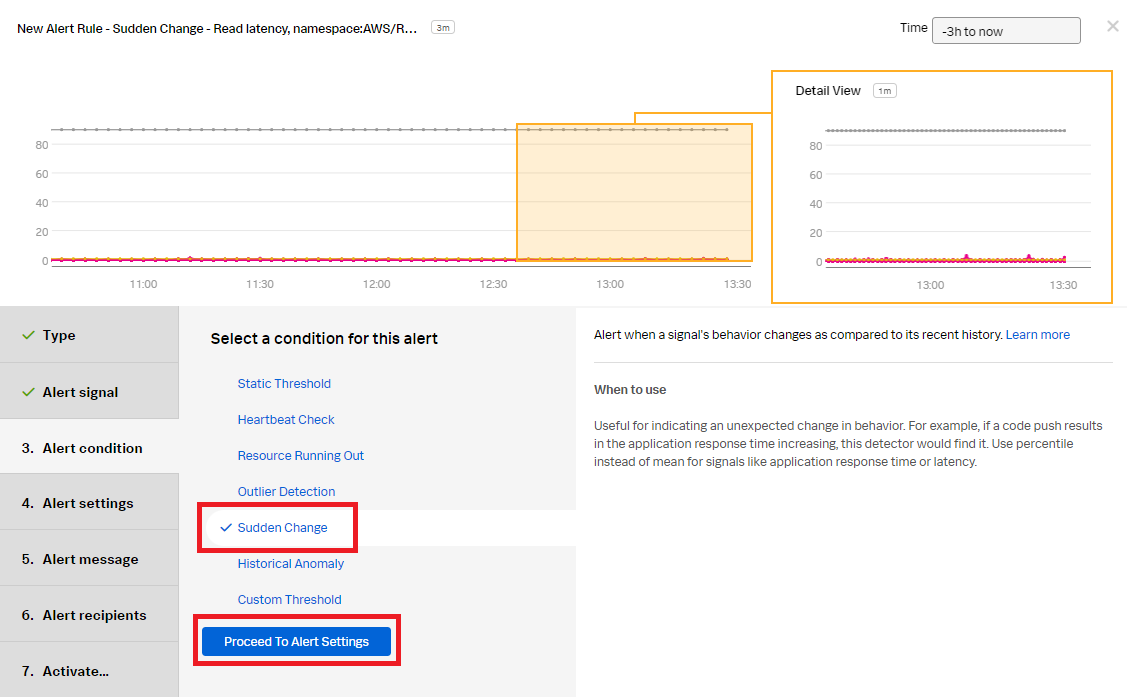
- In the Alert condition section, select Sudden Change to be notified when there is a sudden change in the count of database instances. Click Proceed To Alert Settings.
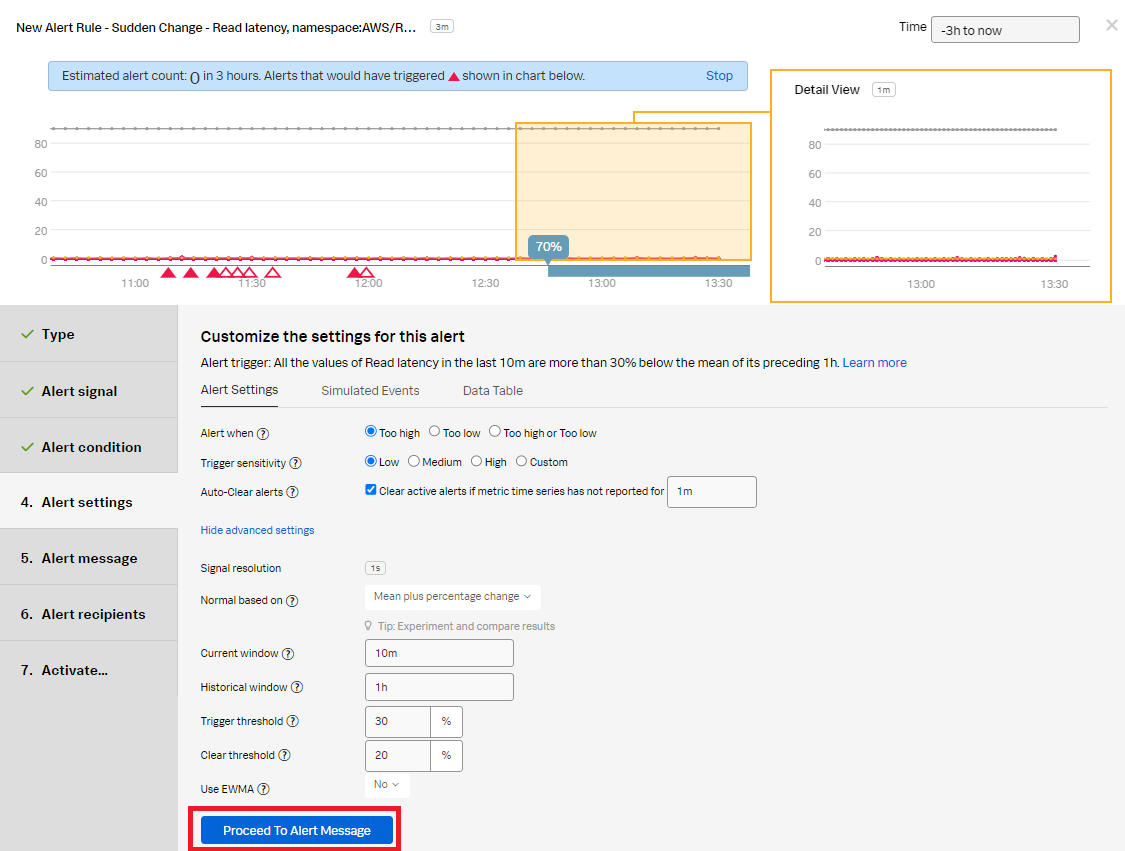
- In the Alert settings section, use the default setting to alert when the count is too high based on the threshold setting in advanced settings with a low sensitivity. Click Proceed to Alert Message.
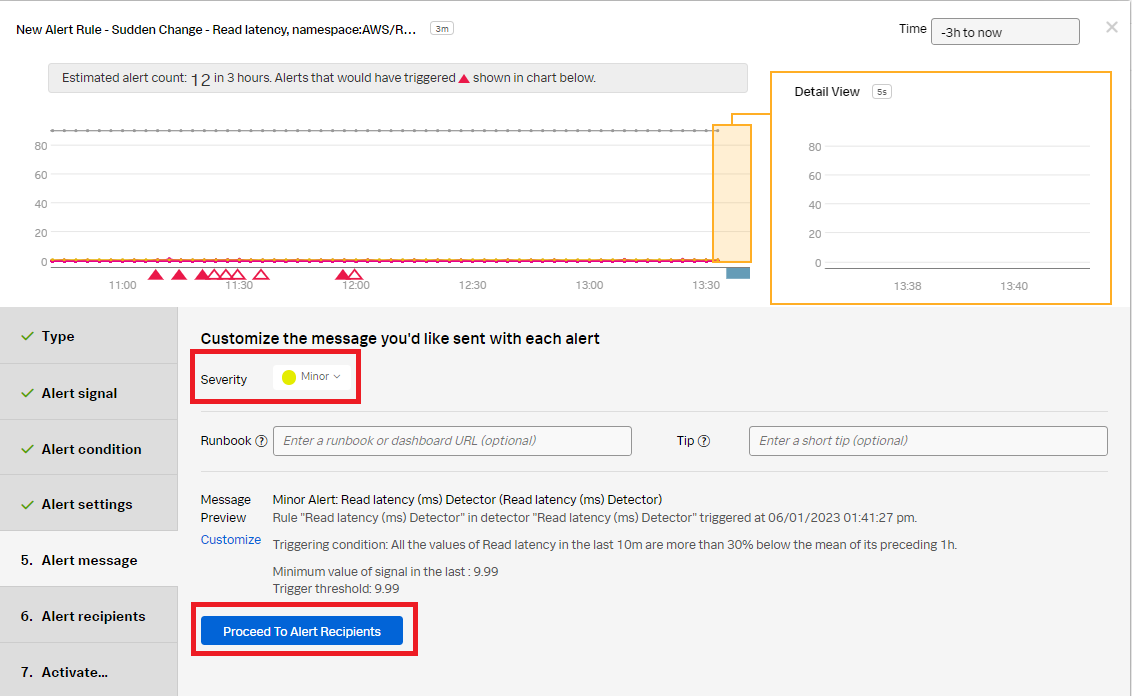
- In the Alert message section:
- Set the alert Severity. You can set it to Critical, Major, Minor, Warning, or Info depending on the alert severity defined by your organization.
- (Optional) Enter a runbook or dashboard URL and a short tip for the end user troubleshooting the alert.
- Customize the message by clicking Customize.
- Click Proceed to Alert Recipients.
- In the Alert recipients section, select the recipients to send the Alert message to. You can choose an email address, team, or webhook. Click Proceed to Alert Activation.
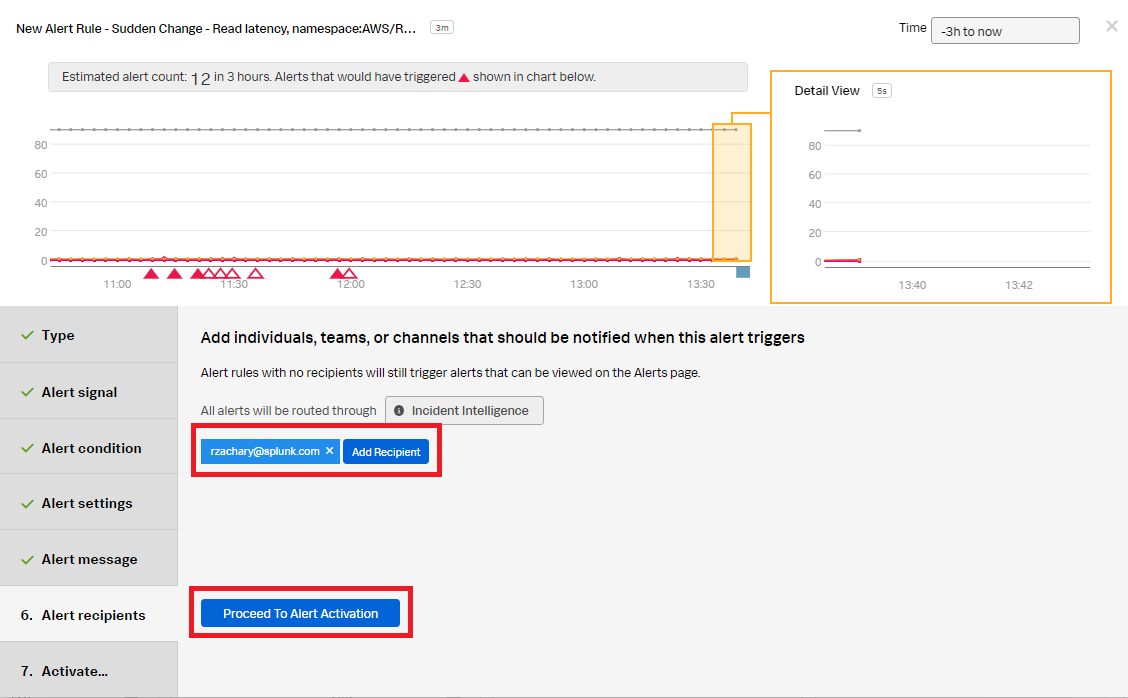
- In the Activate section, rename the detector to a meaningful name, for example, "RDS Instance Monitor Change Detector". Click Activate Alert Rule.
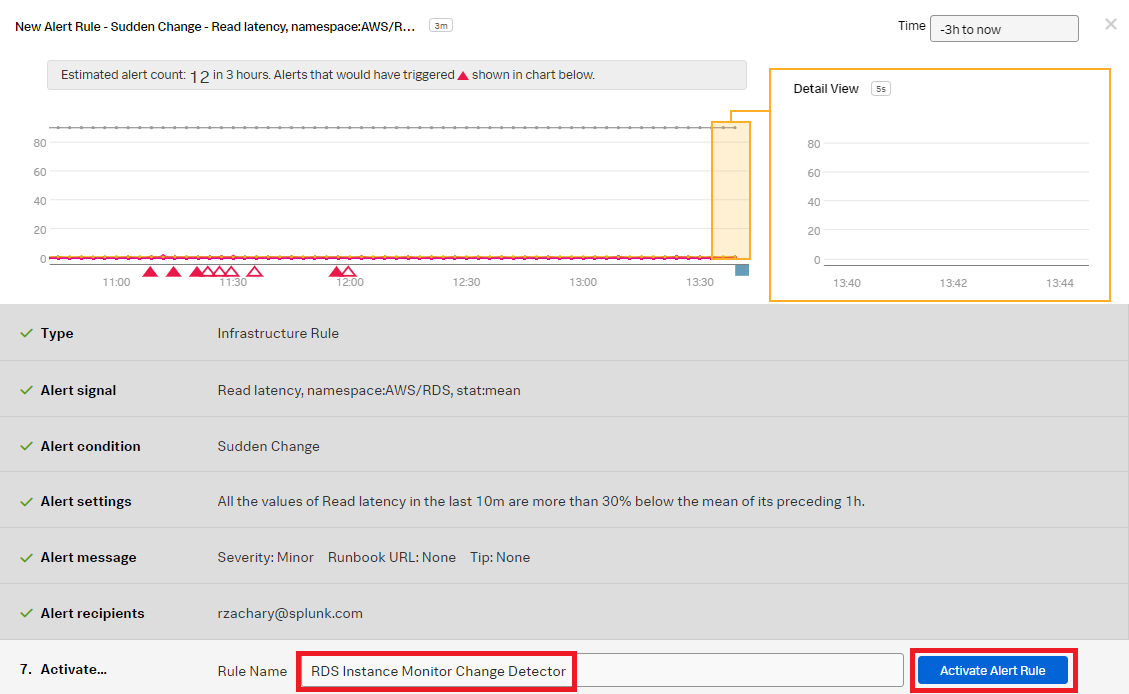
You now have a detector that will send a notification when the number of database instances is too high, based on the threshold settings.
- In Splunk Observability Cloud, click Infrastructure in the left navigation pane. Under Amazon Web Services, click RDS to view the list of databases and their details.
Engine names for compliance
The Engine Name property shows you the different engines being used by your company. This can be helpful if you have a company policy that says you can only use certain engines. For example, if the Aurora engine which is out of company policy starts being used by your team, this detector will result in an alert letting you know that it is being used.
- ► How to create a detector in Splunk Infrastructure Monitoring to monitor engine names for compliance
-
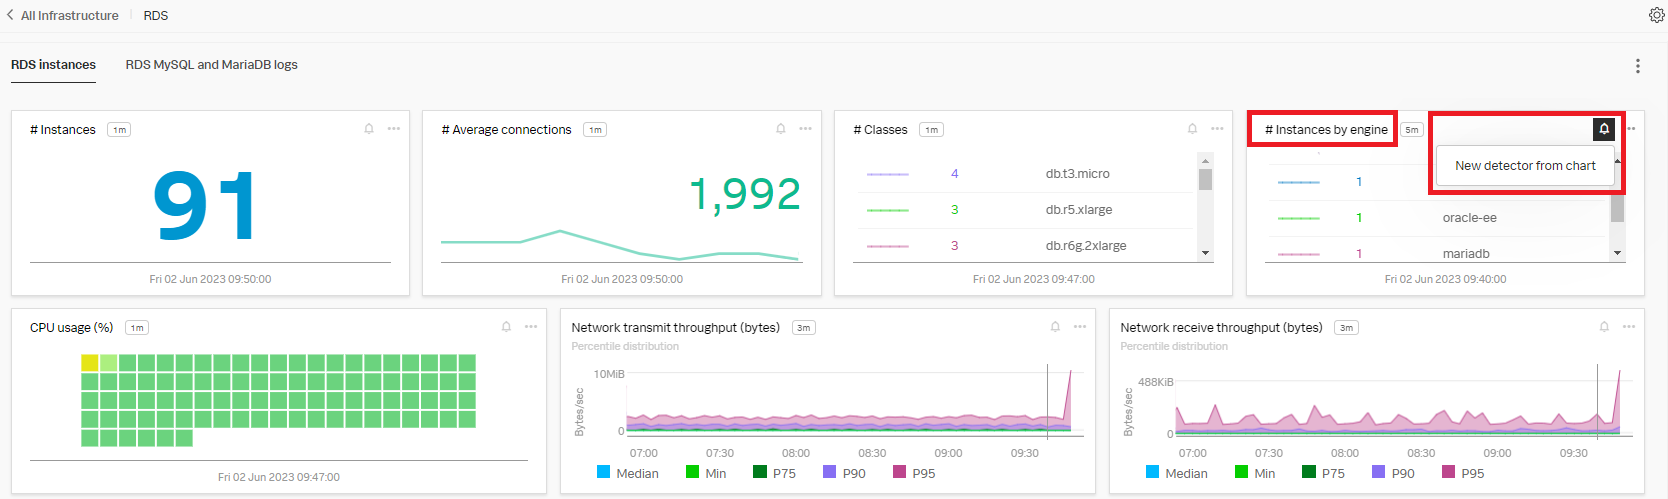
- In Splunk Observability Cloud, click Infrastructure in the left navigation pane. Under Amazon Web Services, click RDS to view the list of databases with their details.
- Use the "# Instances by engine" chart as a template to create the new detector. Click the bell icon in the upper right of the chart, then click New detector from chart.
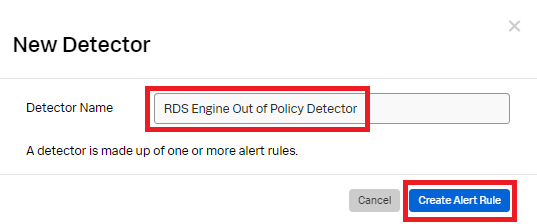
- Rename the detector to a meaningful name, for example, "RDS Engine Out of Policy Detector". Click Create Alert Rule.
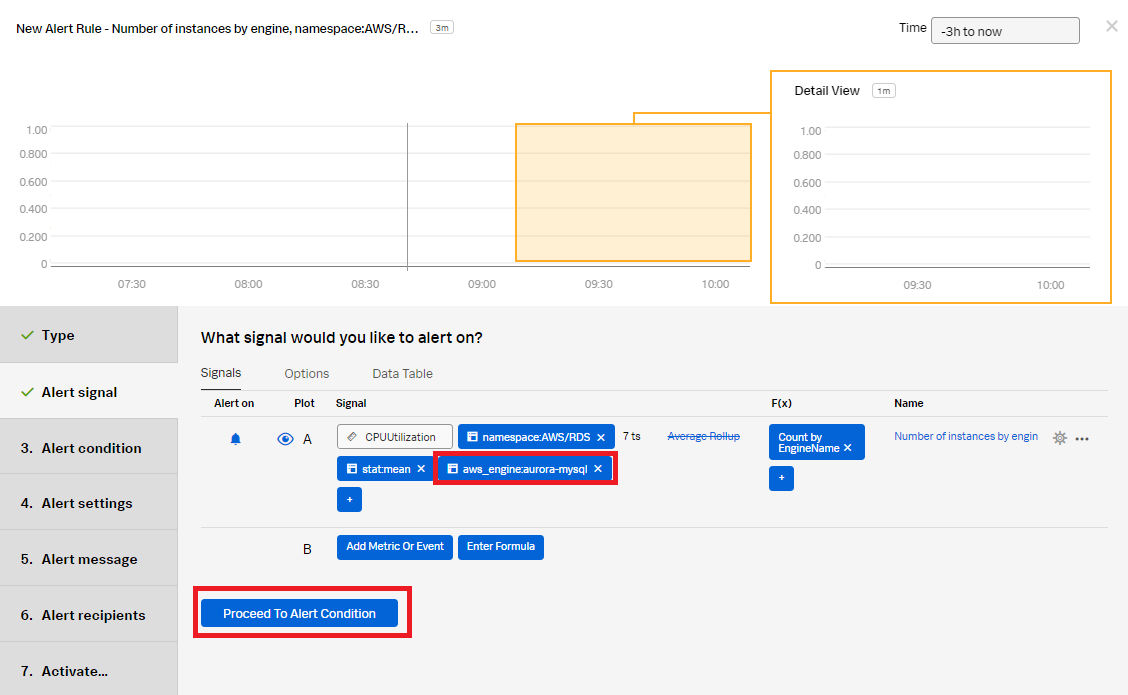
- In the Alert signal section, in CPUUtilization Signal, replace the EngineName: * filter with the aws_engine:aurora-mysql filter to notify for Aurora databases that are out of company compliance. Click Proceed To Alert Condition.
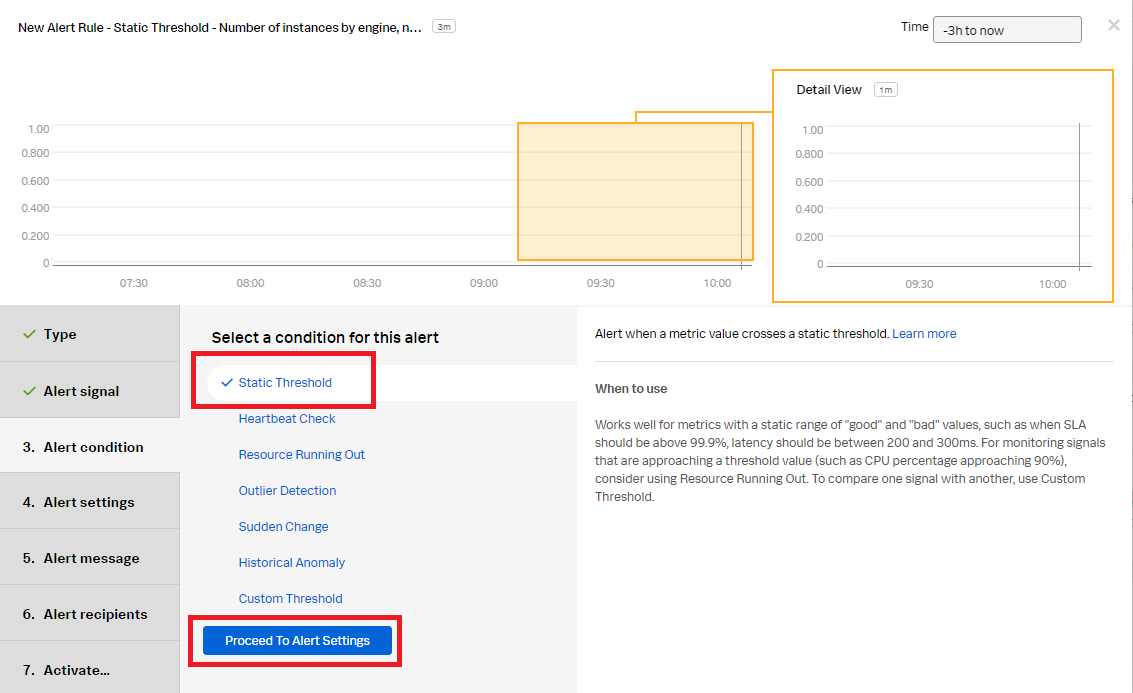
- In the Alert condition section, select Static Threshold, then click Proceed To Alert Settings.
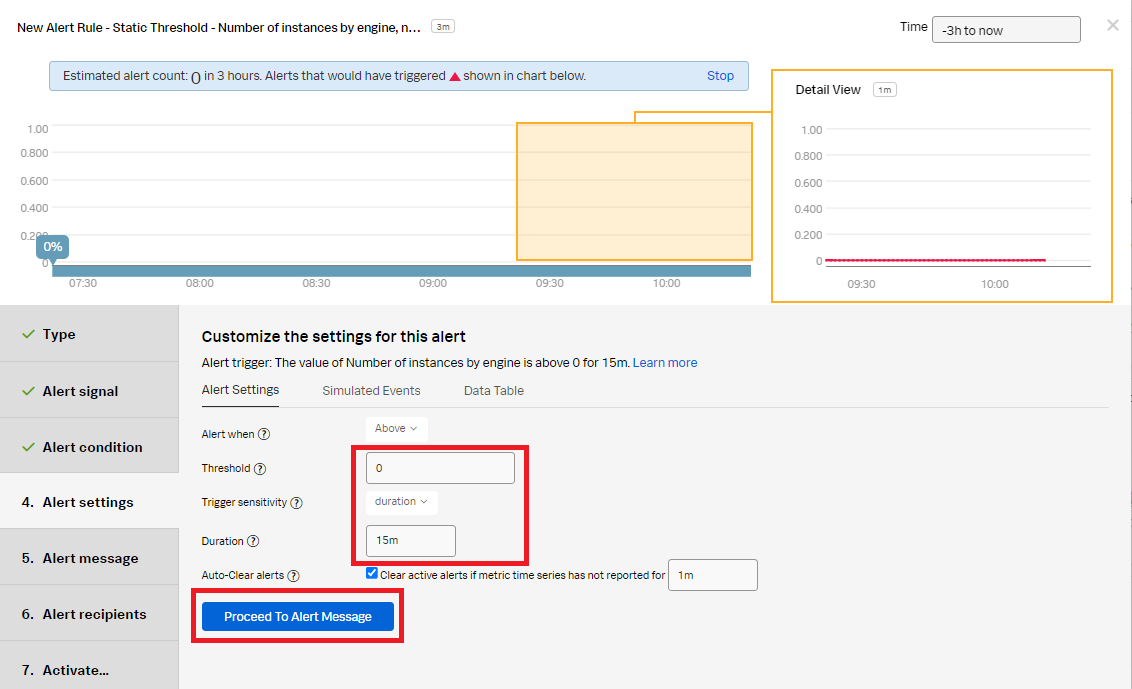
- In the Alert settings section:
- Set the Threshold to 0 to notify when an Aurora database has been added.
- Change the trigger sensitivity to Duration.
- Set the Duration to 15m.
- Click Proceed To Alert Message.
- In the Alert message section:
- Set the alert severity. You can set it to Critical, Major, Minor, Warning, or Info depending on the alert severity defined by your organization.
- (Optional), Enter a runbook or dashboard URL and a short tip for end user troubleshooting the alert.
- Customize the message by clicking Customize.
- Click Proceed to Alert Recipients.
- In Alert recipients section, select the recipients to send the alert message to. You can choose an email address, team, or webhook. Click Proceed to Alert Activation.
- In the Activate section, click Activate Alert Rule.
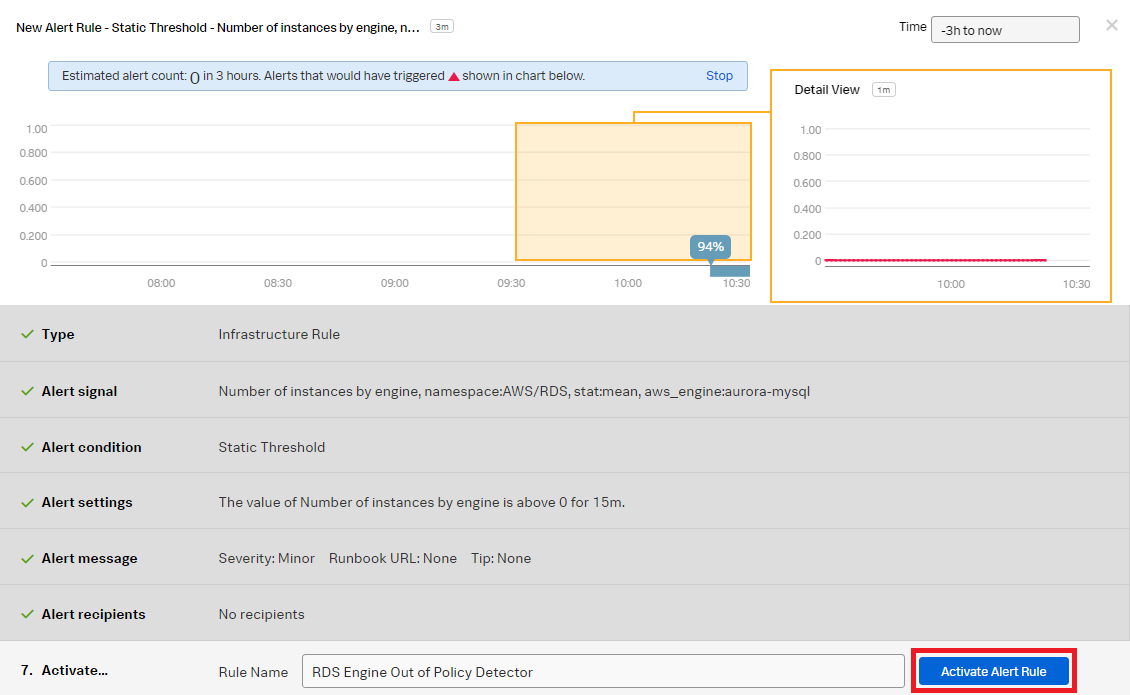
You now have a detector that will send a notification when an Aurora database instance has been added.
- In Splunk Observability Cloud, click Infrastructure in the left navigation pane. Under Amazon Web Services, click RDS to view the list of databases with their details.
Next steps
You might also be interested in other processes associated with the use case Monitoring AWS Relational Database Services.