Monitoring RDS system metrics
This article introduces you to some of the different AWS RDS system metrics you might want to monitor:
You can also monitor the EC2 instance supporting the RDS instance to ensure its workload is healthy and sized correctly.
The procedure you'll use to create a detector in Splunk Infrastructure Monitoring to monitor these metrics is the same regardless of the metric you want to monitor. You can jump to Creating a detector to monitor RDS system metrics to see how it's done.
Metrics
You might want to keep track of the following metrics:
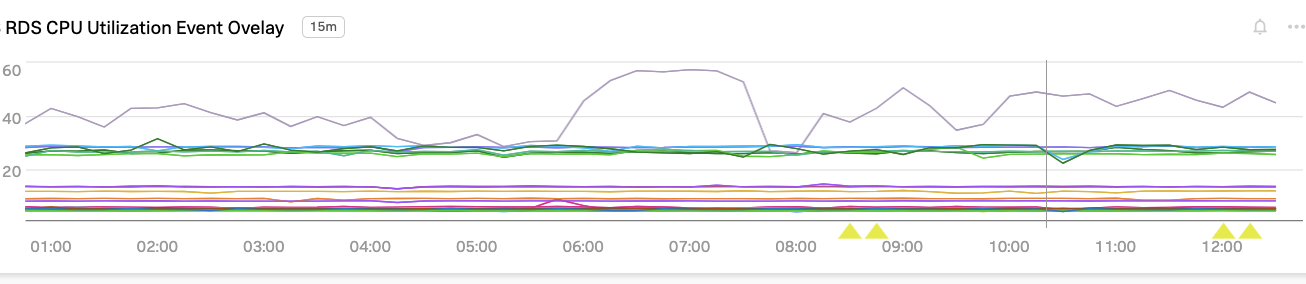
CPU Utilization
CPU utilization is the total number of CPU units used per RDS instance, expressed as a percentage of the total available. If this metric exceeds 90 percent for more than a brief period, you could be having a negative impact on your read or write latency. You might want to consider upgrading to larger instances with more CPUs or additional read replicas or shards.
You can learn more about read replicas in AWS documentation - Working with read replicas.
DatabaseConnections
This is the number of database connections. Check your instance type for the limit on the number of connections allowed. It’s a good idea to set an alert to fire before you hit the limit. You might want to check the connection pool size in your application servers or add additional capacity.
NetworkReceiveThroughput
It’s important to monitor the number of bytes per second you receive through the network interface. Each instance type has a set capacity for network throughput. Snapshots and replication can also use up your network capacity.
NetworkTransmitThroughput
Your database writes many I/O operations to disk per second. If you need more, consider switching to SSDs with provisioned IOPS.
Creating a detector to monitor RDS system metrics
The following steps can be used as an example of how to create a detector in Splunk Infrastructure Monitoring to monitor RDS system metrics. In this example, we'll create a detector for the CPU Utilization metric.
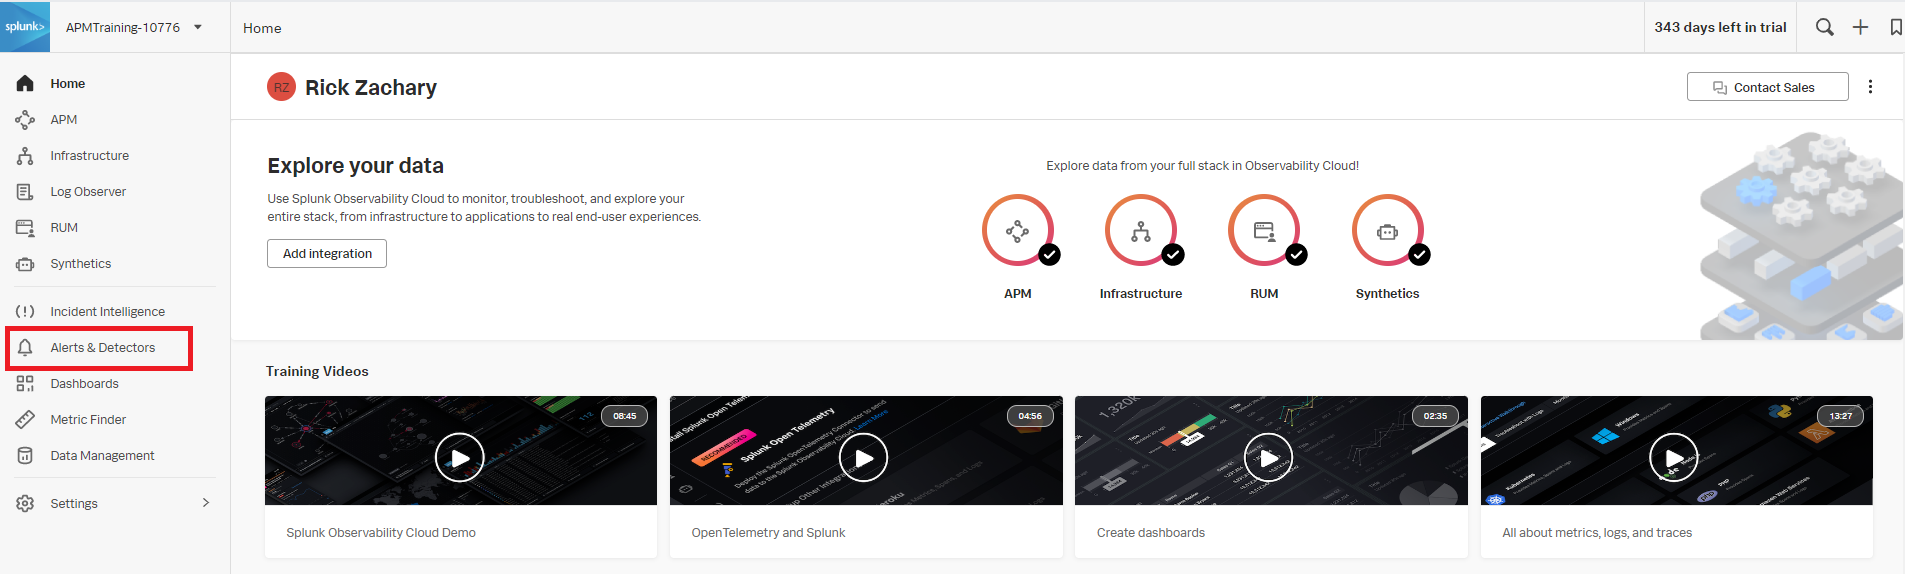
- In Splunk Observability Cloud, click Alerts & Detectors in the left navigation pane.
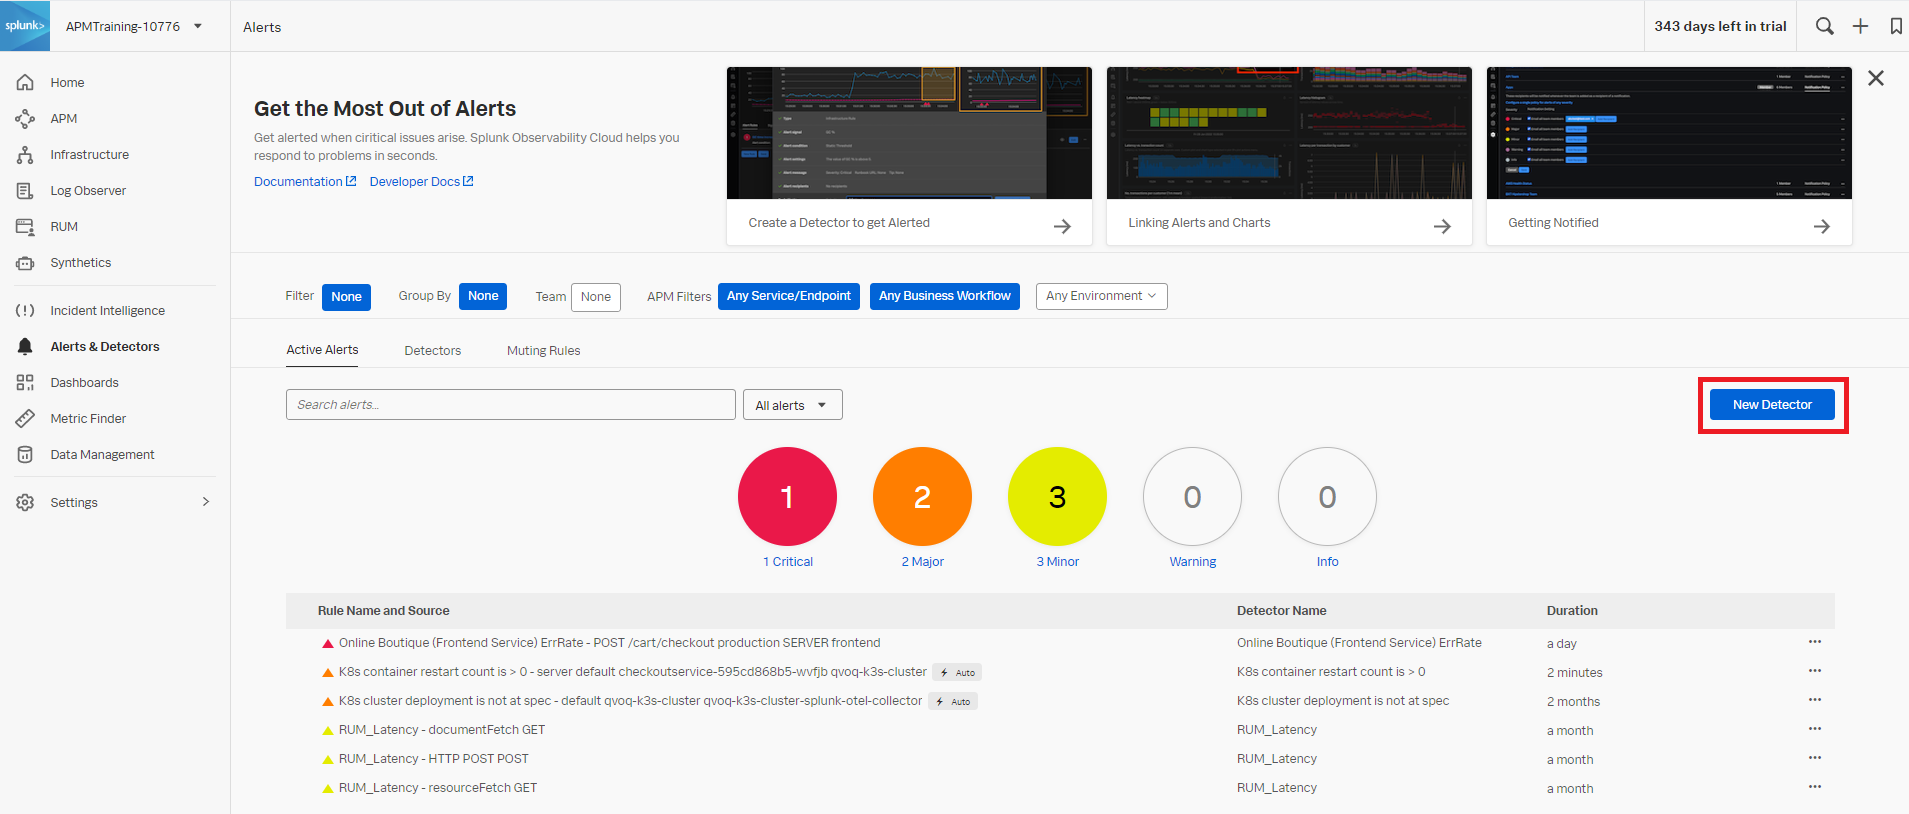
- Click New Detector.
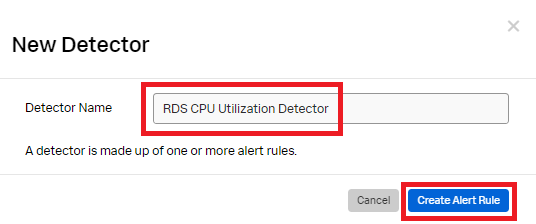
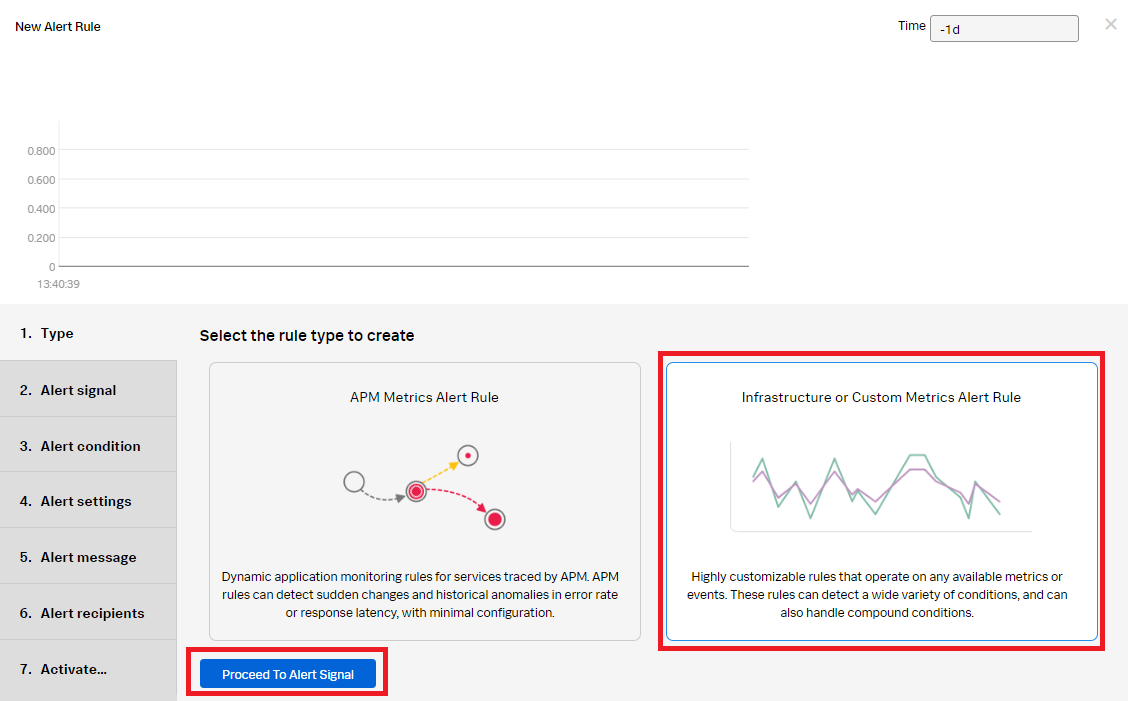
- Enter the detector name and click Create Alert Rule.
- Click Infrastructure or Custom Metrics Alert Rule and then click Proceed To Alert Signal.
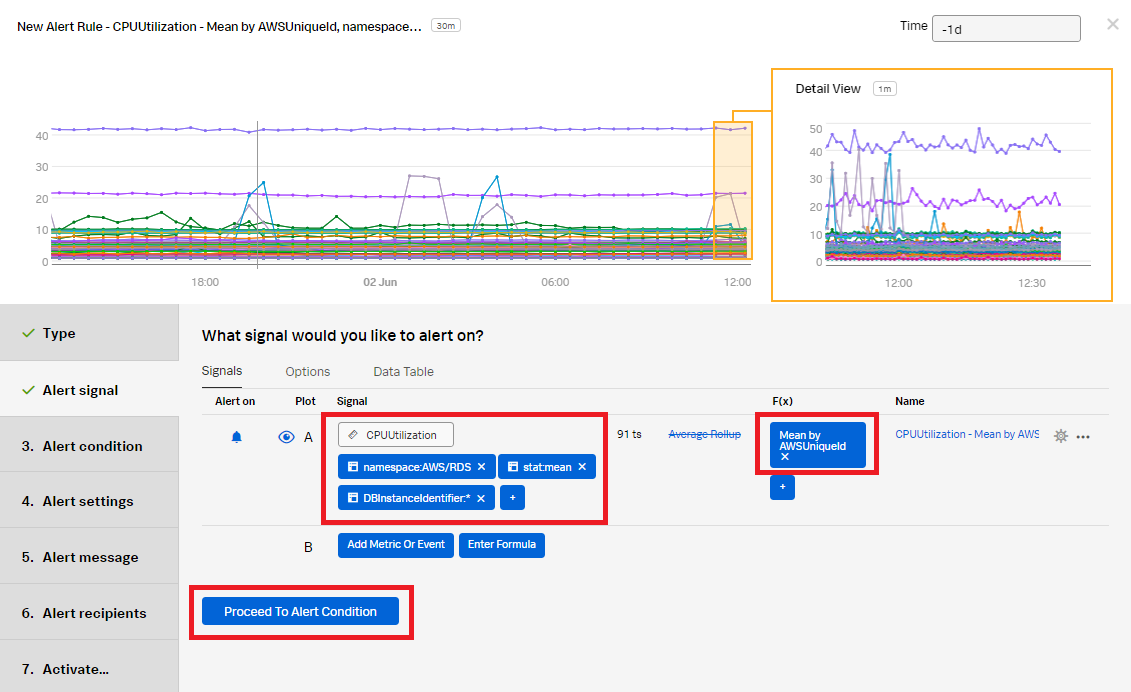
- In the Alert signal section, set the Signal metric as CPUUtilization. Add the following filters:
- namespace: AWS/RDS
- stat: mean
- DBInstanceIdentifier: * (This includes any database with an instance identifier.)
- Click Add Analytics, set it as Mean and group it by the value of AWSUniqueid. Click Proceed To Alert Condition.
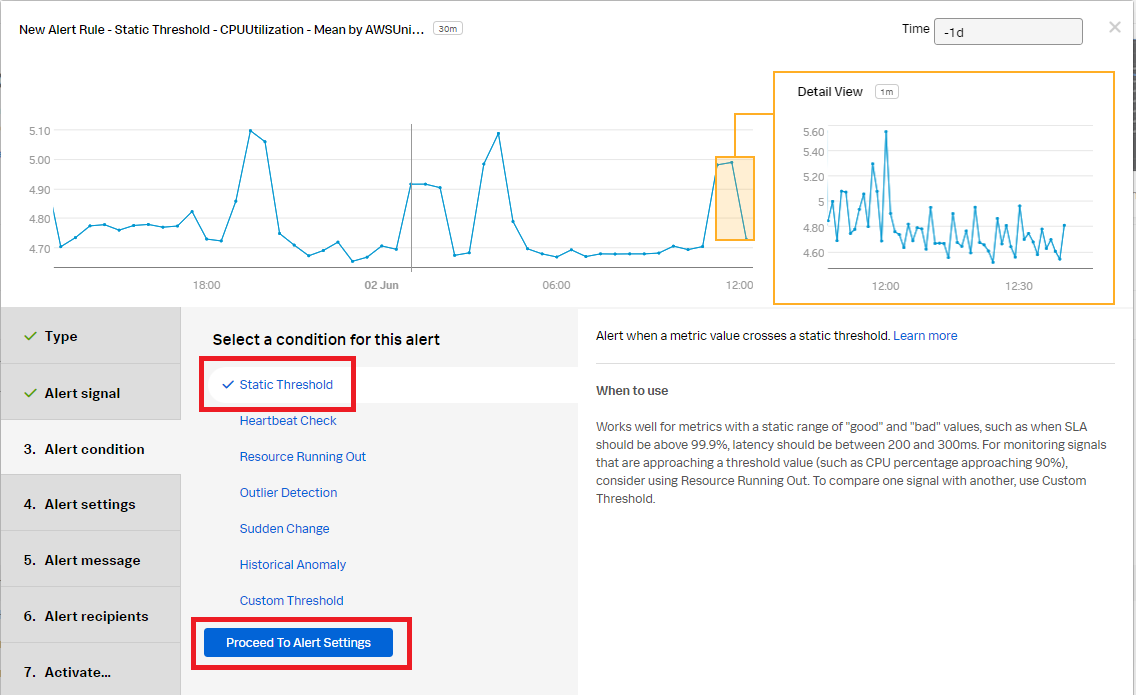
- In the Alert condition section, select Static Threshold, then click Proceed To Alert Settings.
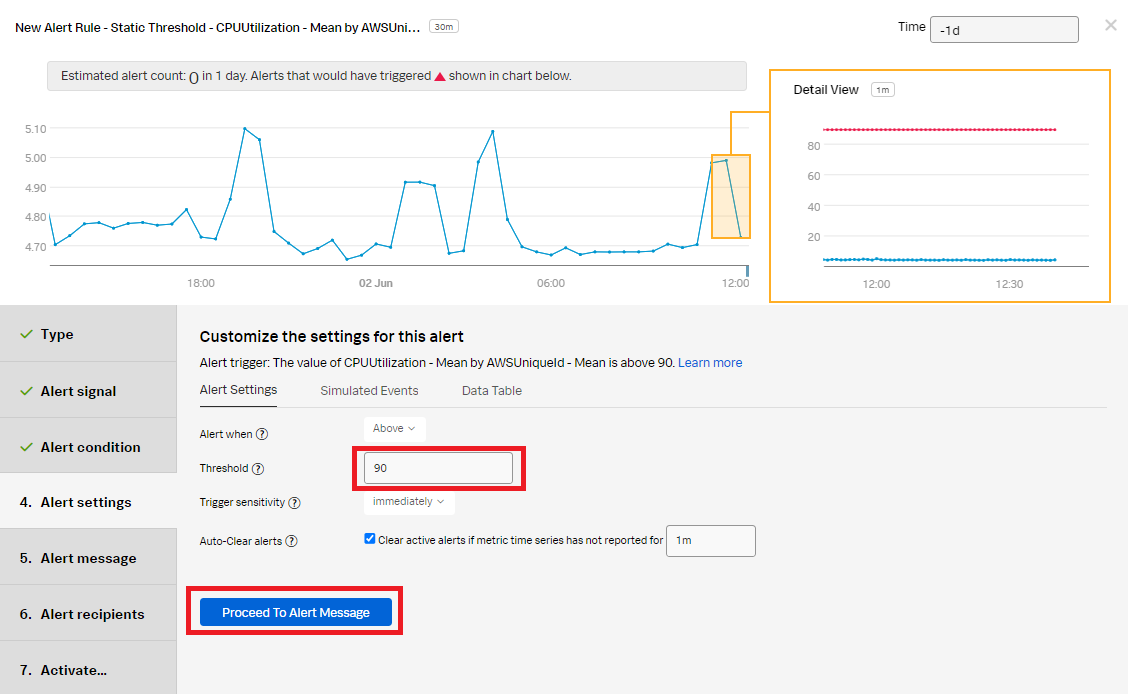
- In the Alert settings section, set the Threshold value to 90. Click Proceed To Alert Message.
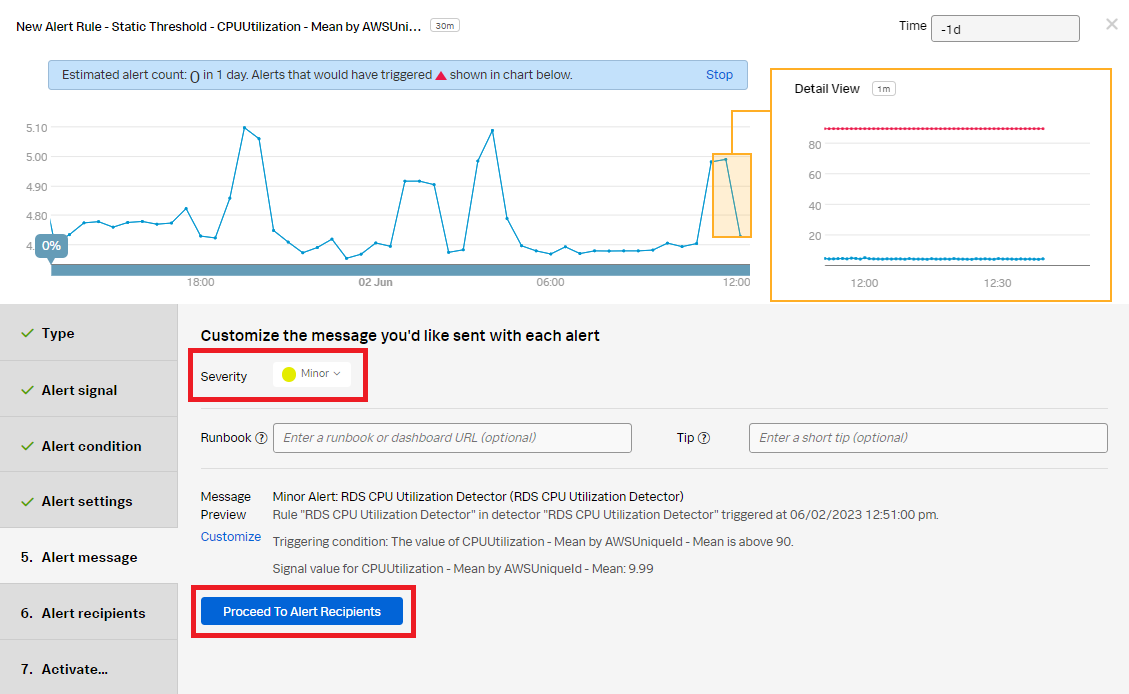
- In the Alert message section:
- Set the alert severity. You can set it to Critical, Major, Minor, Warning, or Info depending on the alert severity defined by your organization.
- (Optional) Enter a runbook or dashboard URL or a short tip for end user troubleshooting the alert.
- Customize the message if appropriate by selecting Customize.
- Click Proceed to Alert Recipients.
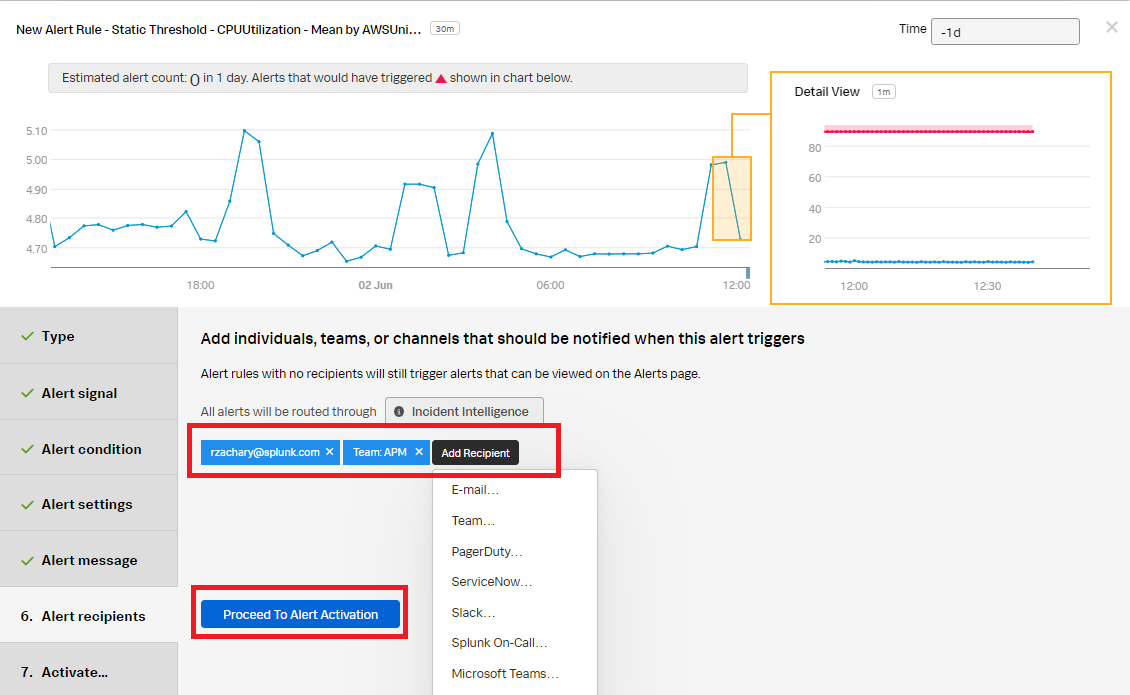
- In the Alert recipients section, select the recipient(s) to send the alert message to. You can choose an email address, team, or webhook. Click Proceed to Alert Activation.
- In the Activate section, click Activate Alert Rule.
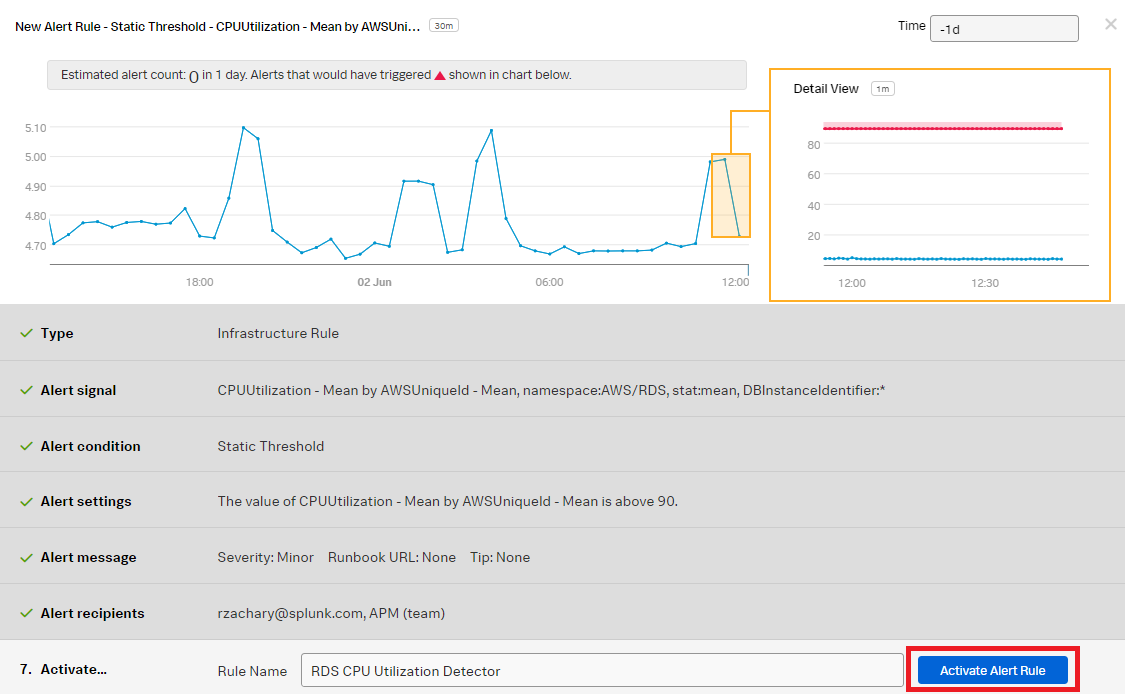
You now have a detector that will monitor CPU utilization and send notifications when CPU utilization becomes too high.
Next steps
You might also be interested in other processes associated with the use case Monitoring AWS Relational Database Services.