Detect Kubernetes nodes running out of resources or pods that are in a pending phase
You work for a large organization that uses the Kubernetes container management platform. However, you are often finding your nodes are running out of resources, rendering your applications unable to scale. You need to carefully monitor your Kubernetes nodes to ensure you can take action quickly when this happens.
How to use Splunk software for this use case
You can use Splunk Infrastructure Monitoring to create a detector that monitors for this critical situation.
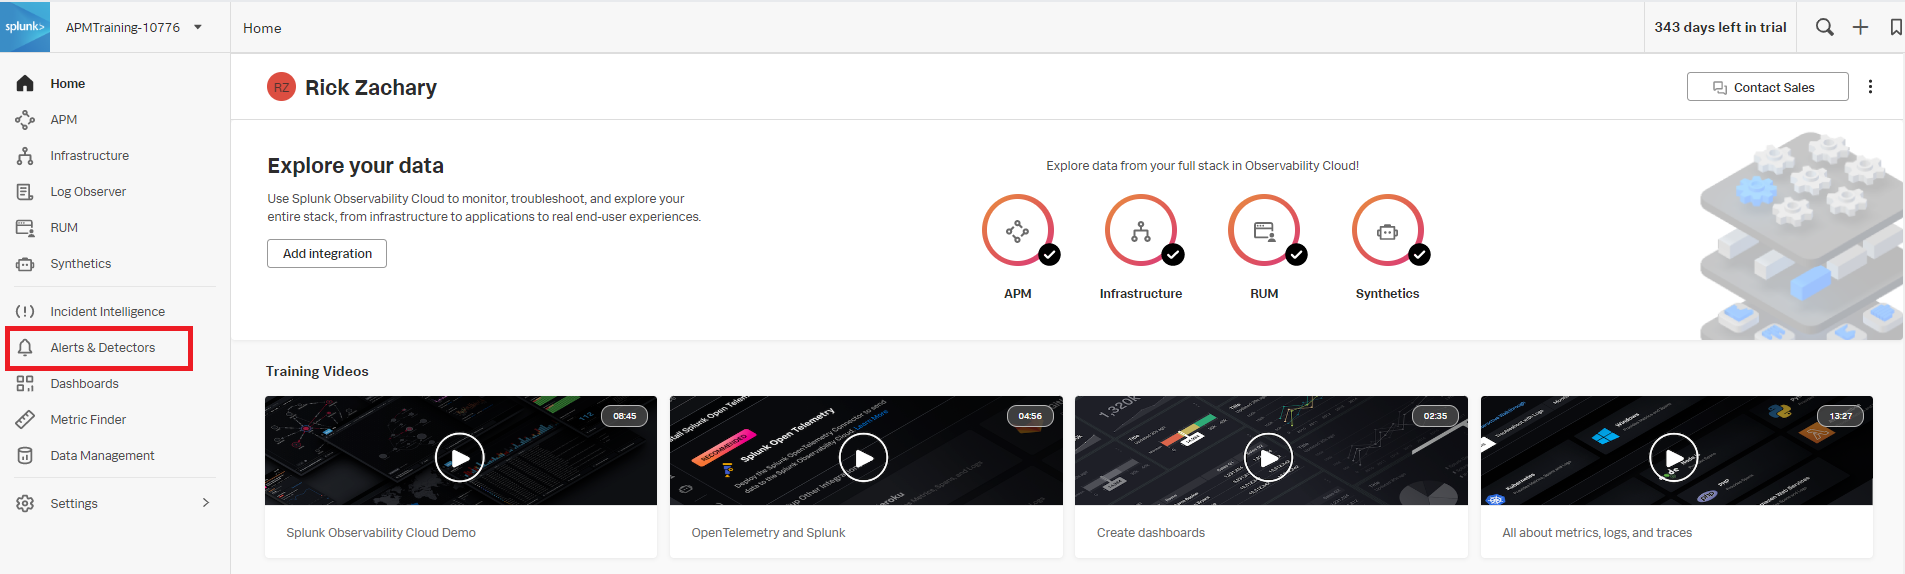
- In Splunk Observability Cloud, click Alerts & Detectors in the left navigation pane.
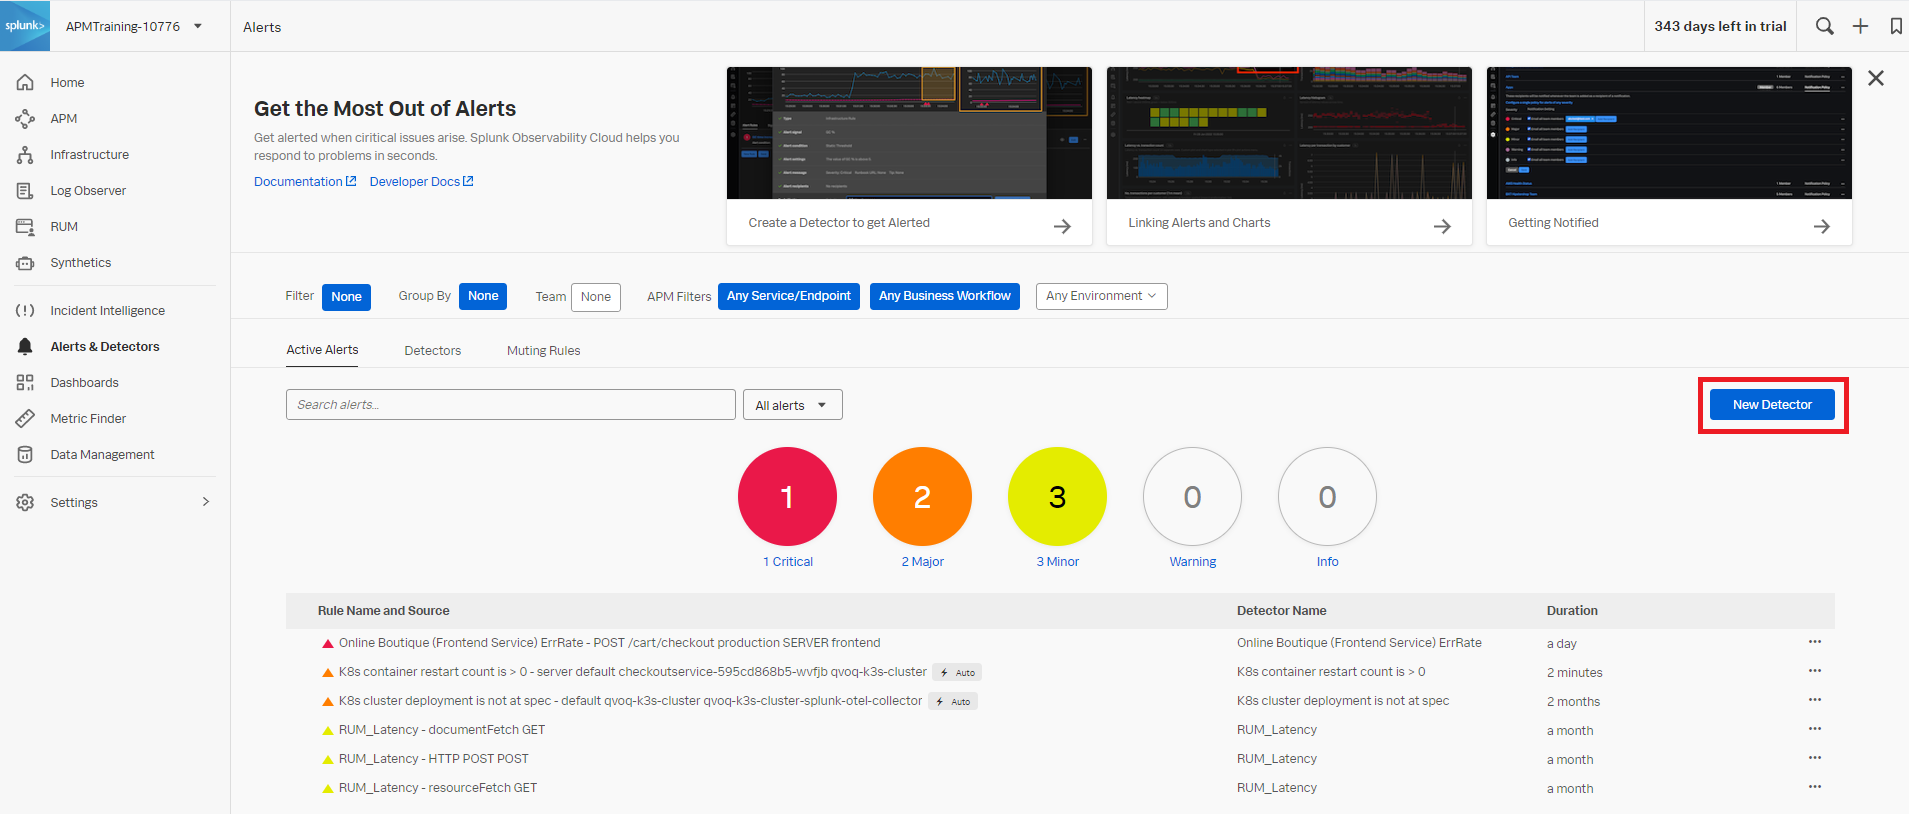
- Click New Detector.
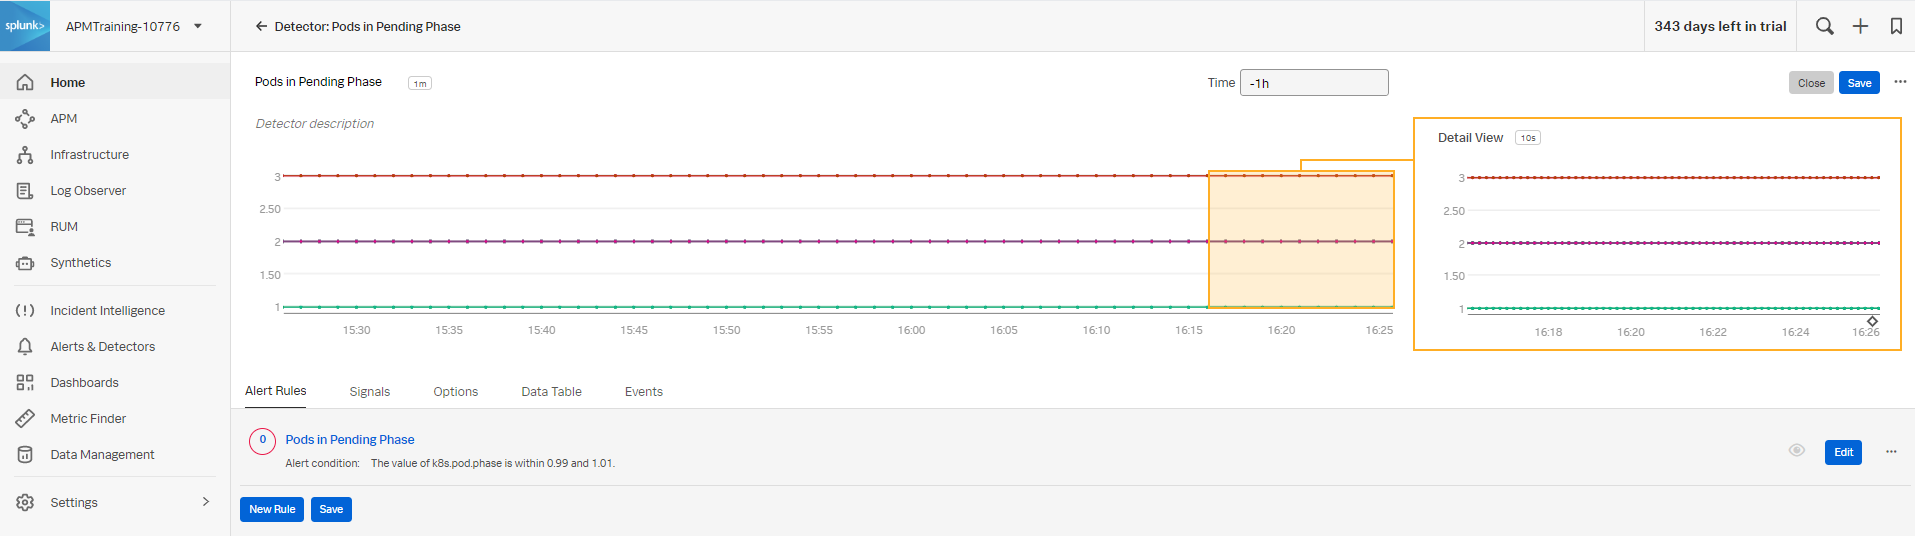
- Enter an appropriate name for the detector. The example below uses
Pods in Pending Phase. Click Create Alert Rule to proceed.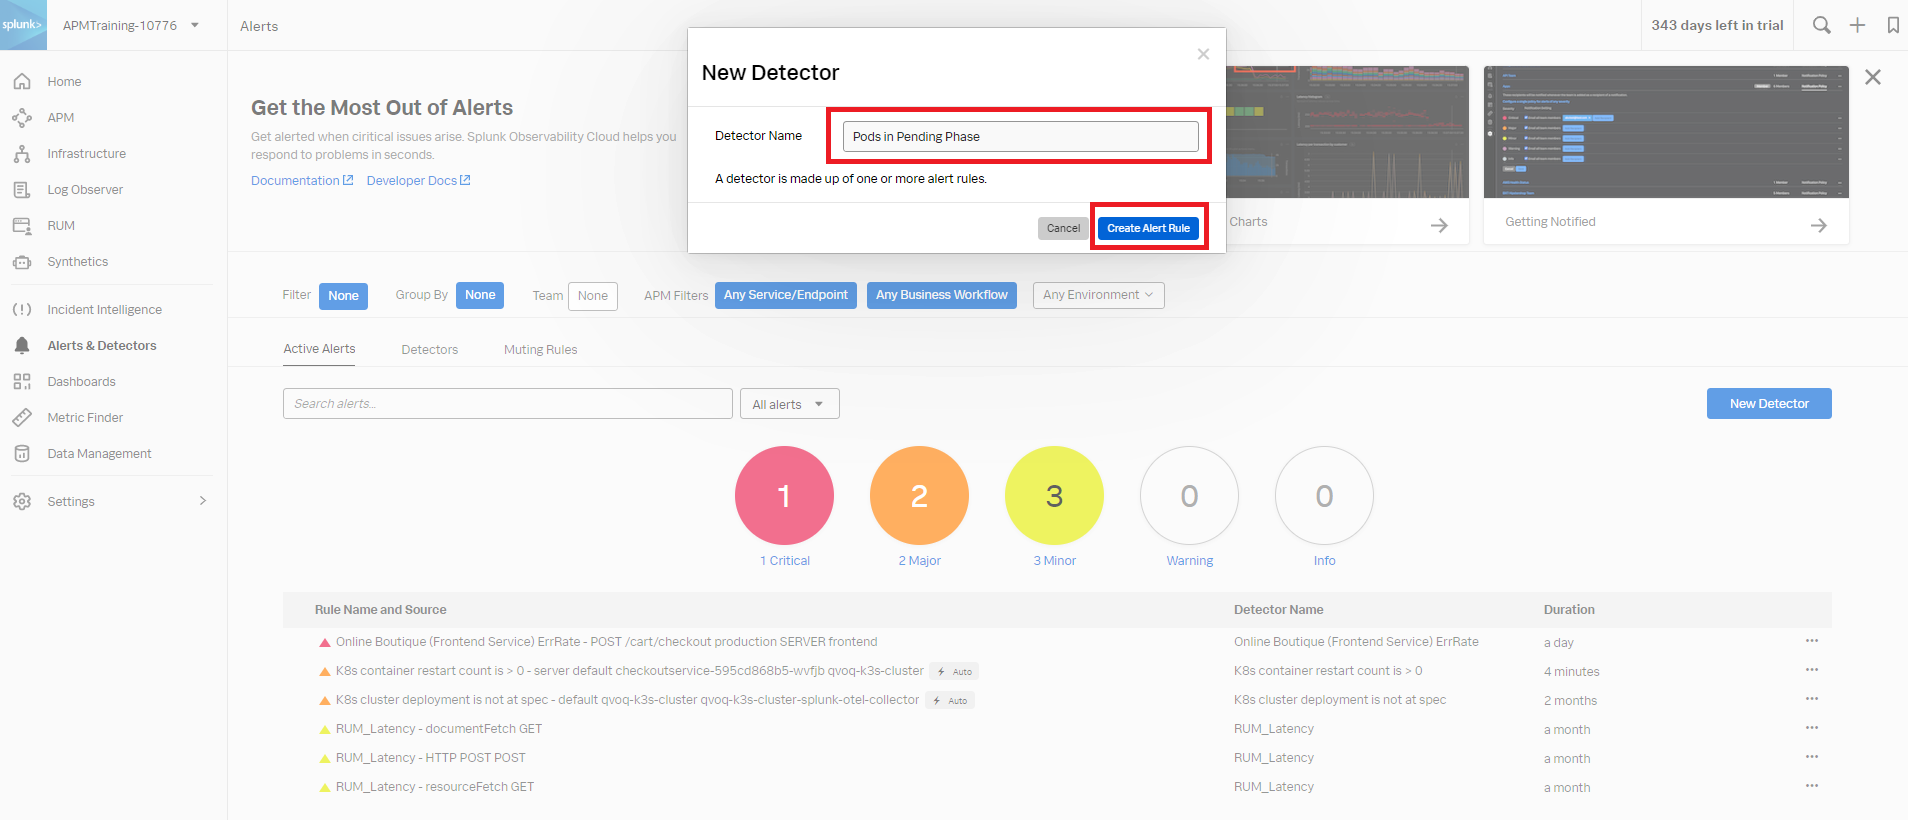
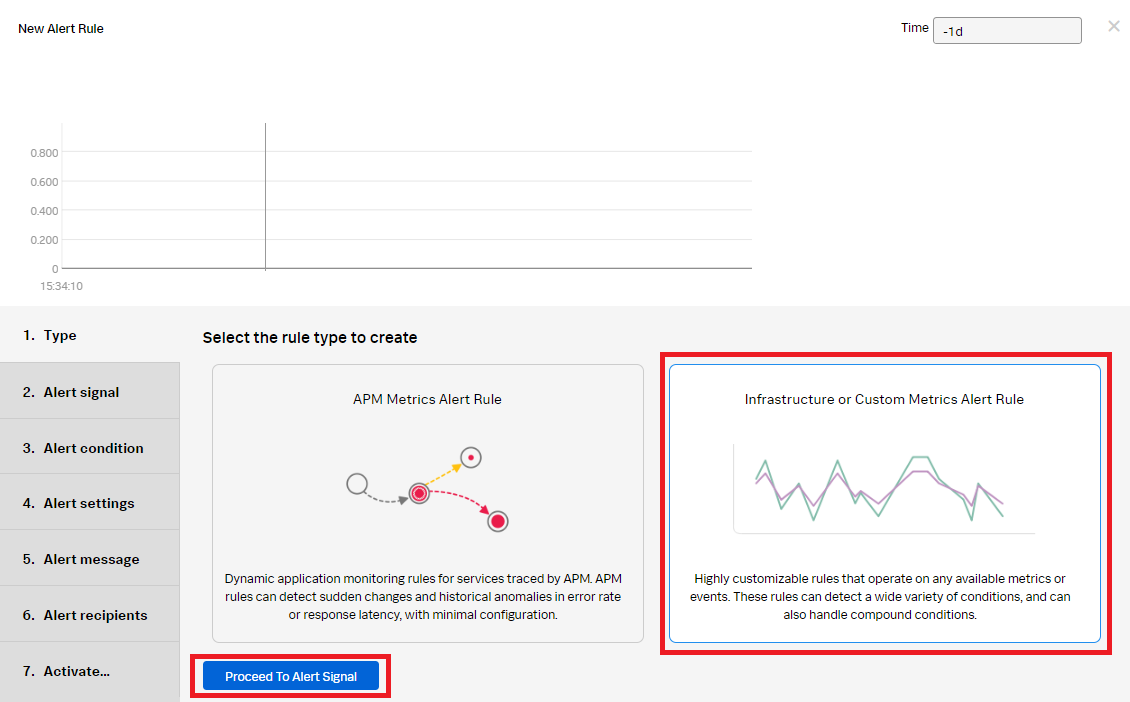
- Click Infrastructure or Custom Metrics Alert Rule and then Proceed to Alert Signal.
- Enter the metric name. The example below shows the metric
k8s.pod.phasewith a preview of the metric values. Click Proceed to Alert Condition.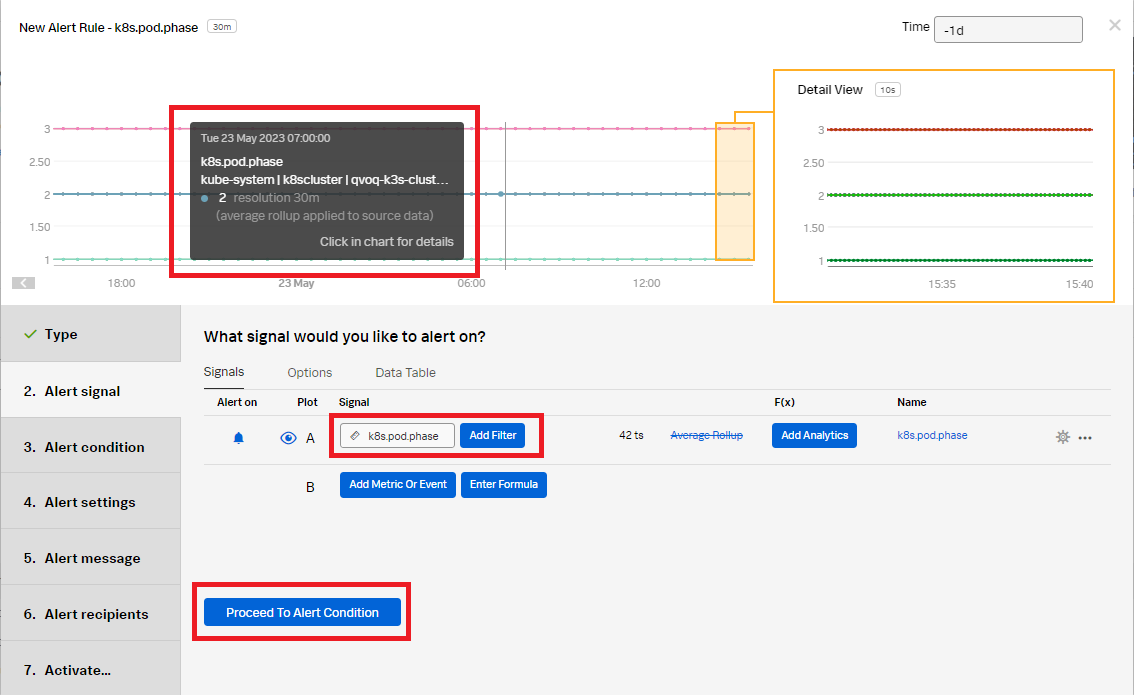
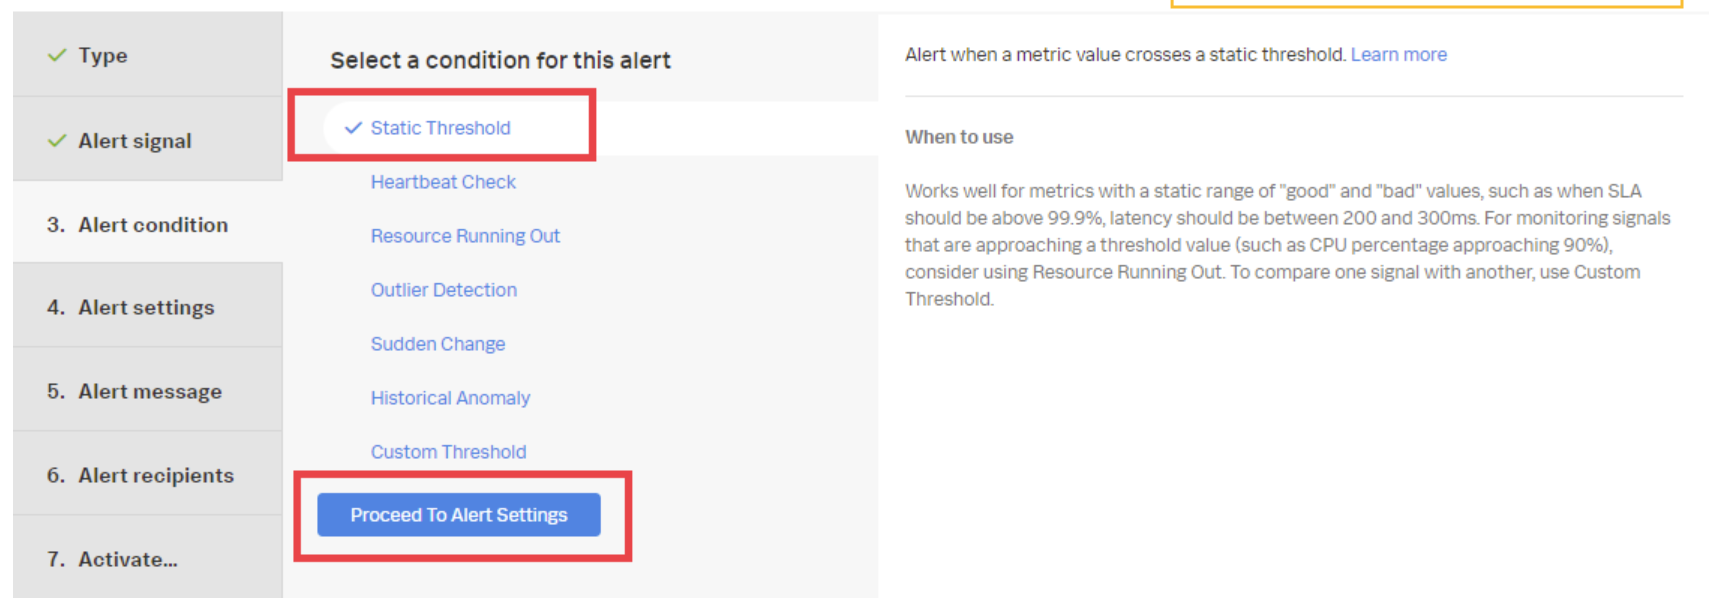
- Click Static Threshold so that the alert will trigger on a value of 1, then click Proceed to Alert Settings.
- Enter the Alert settings for the conditions the alert will trigger on:
- Alert when: Select Within Range.
- Lower threshold: Enter .99 (so the condition is true when the metric value is 1.)
- Upper threshold: Enter 1.01.
- Trigger sensitivity: Set to duration.
- Duration: Set to 5m. Since pods take time to come up from pending, set the value to 5 minutes to avoid false positives due to system slowness. This means the condition must be true for 5 minutes before the alert will trigger.
- Auto-Clear alerts: Check the box and set to 5m. If the pod goes offline and the metric is no longer being recorded, the alert will clear.
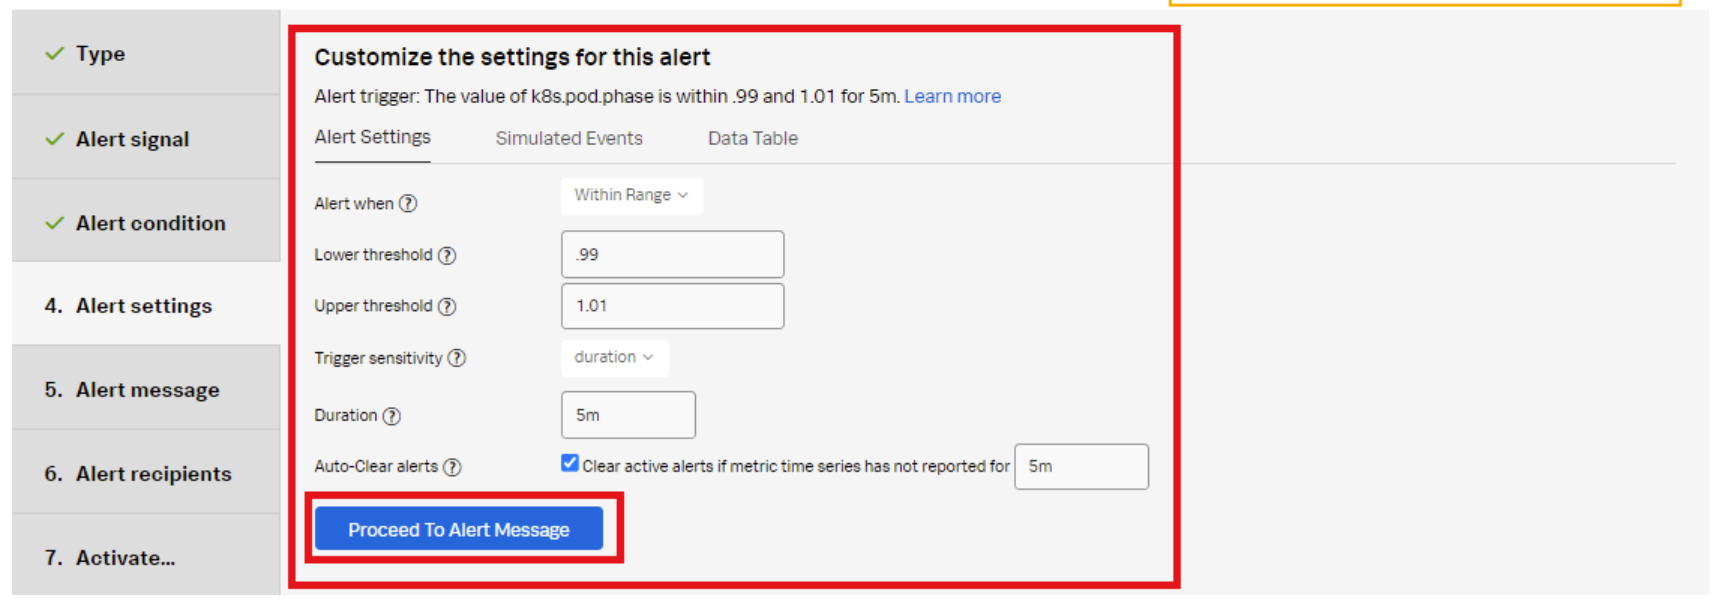
- Click Proceed to Alert Message.
- Set the alert Severity. You can choose from Critical, Major, Minor, Warning, or Info, depending on how you perceive the alert severity.
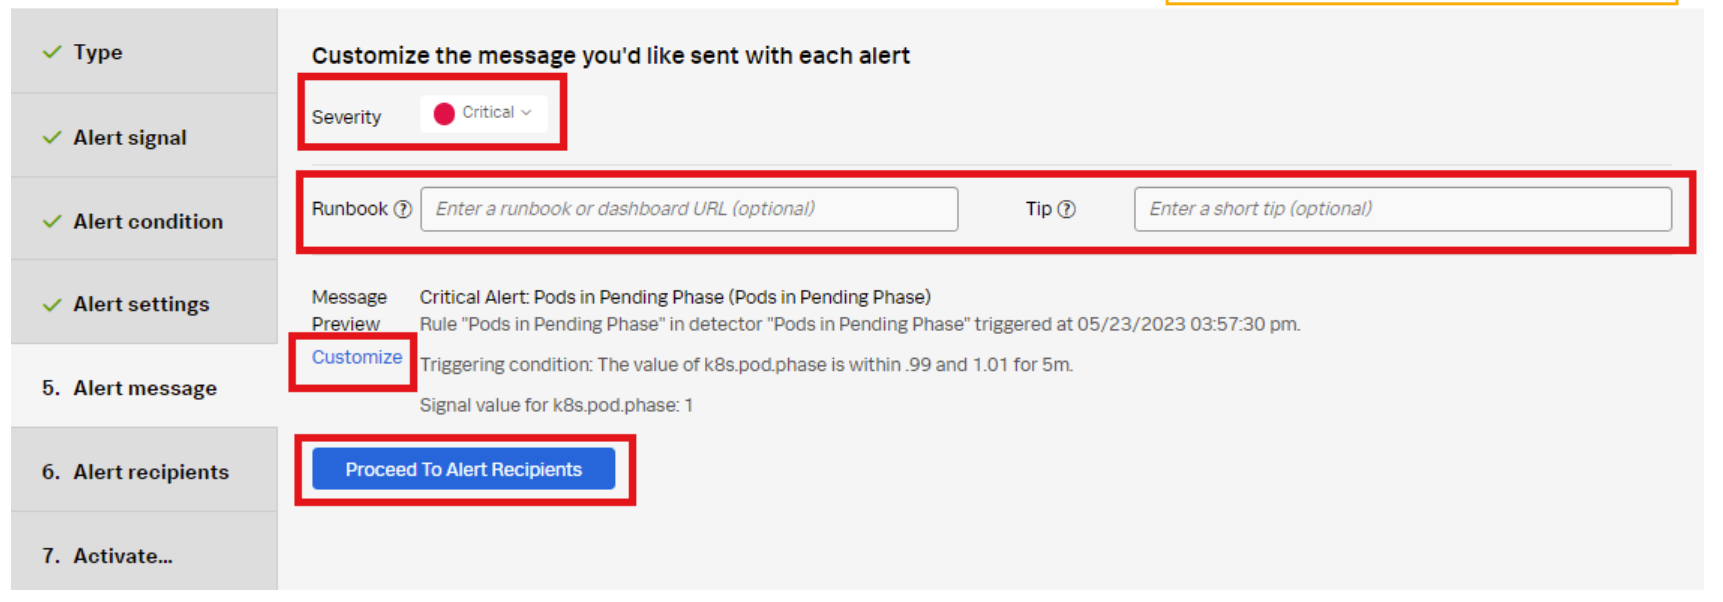
- (Optional) Enter a Runbook or dashboard URL, and enter a short tip for end users who might be troubleshooting the alert.
- (Optional) Click Customize to further customize the alert message.
- Click Proceed to Alert Recipients.
- Click Add Recipient to customize the recipients to send the alert message to. You can choose to add your own email address, any email, team, or webhook.
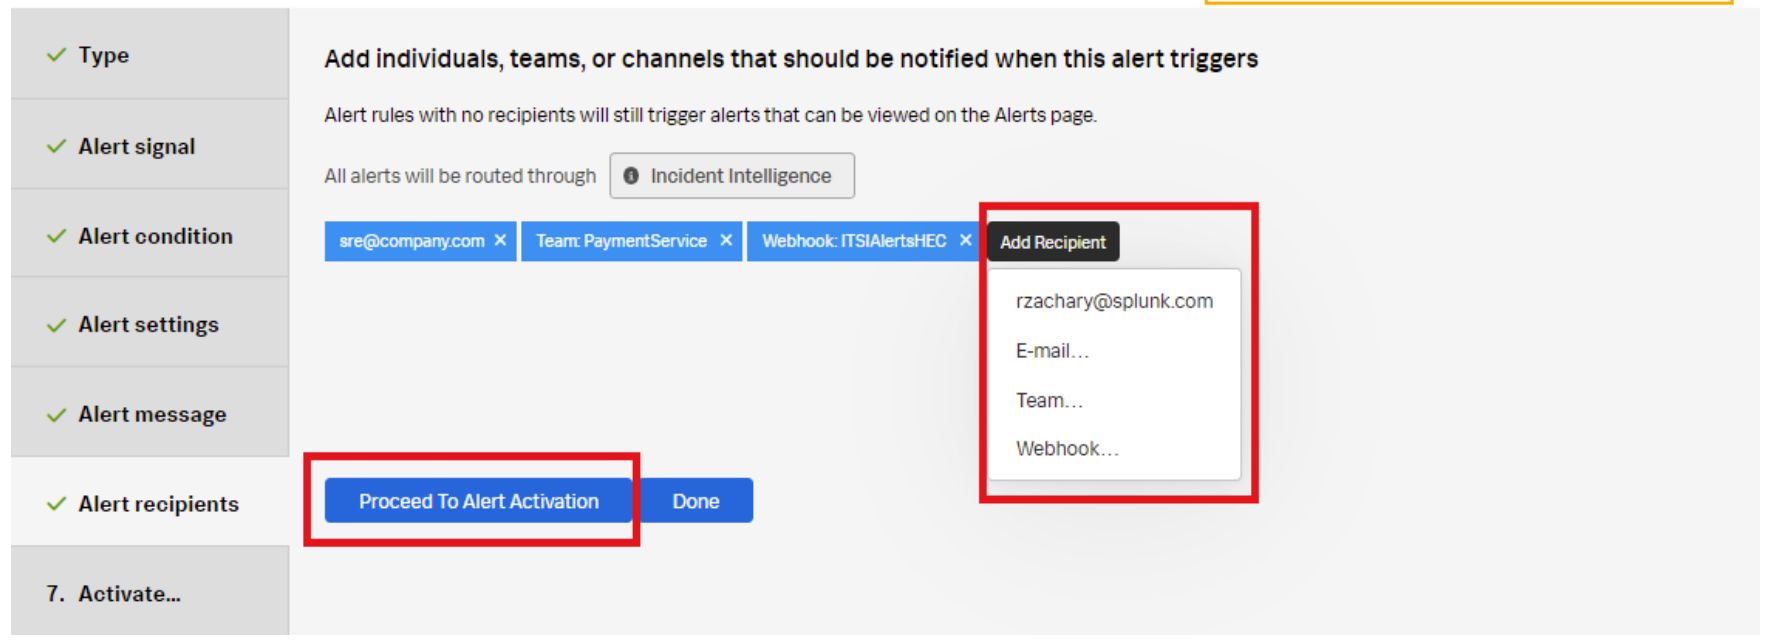
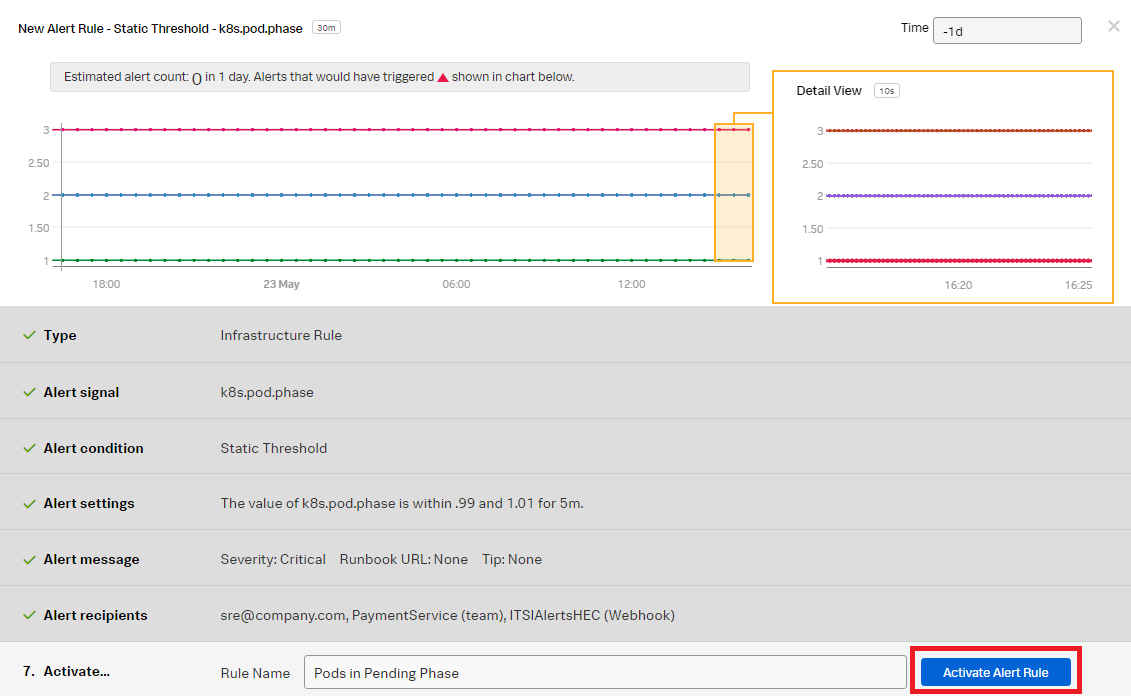
- Click Proceed to Alert Activation.
- Click Activate Alert Rule.
The appropriate recipients will now be notified when the alert rule conditions have been met.
Additional resources
These additional Splunk resources might help you understand and implement these recommendations:
- Splunk Education: Visualizing and alerting in Splunk IM
- Splunk Education: Kubernetes monitoring with Splunk Observability Cloud