Monitor CPU utilization for no-limit pod configuration situations
You work for a large organization that uses the Kubernetes container management platform. You don't have any pod limits set and are finding that more CPU usage can be consumed than intended, causing the resources of the node to run out.
How to use Splunk software for this use case
You can monitor node CPU usage within Splunk Infrastructure Monitoring to stay on top of this situation, reducing the impact to your customers.
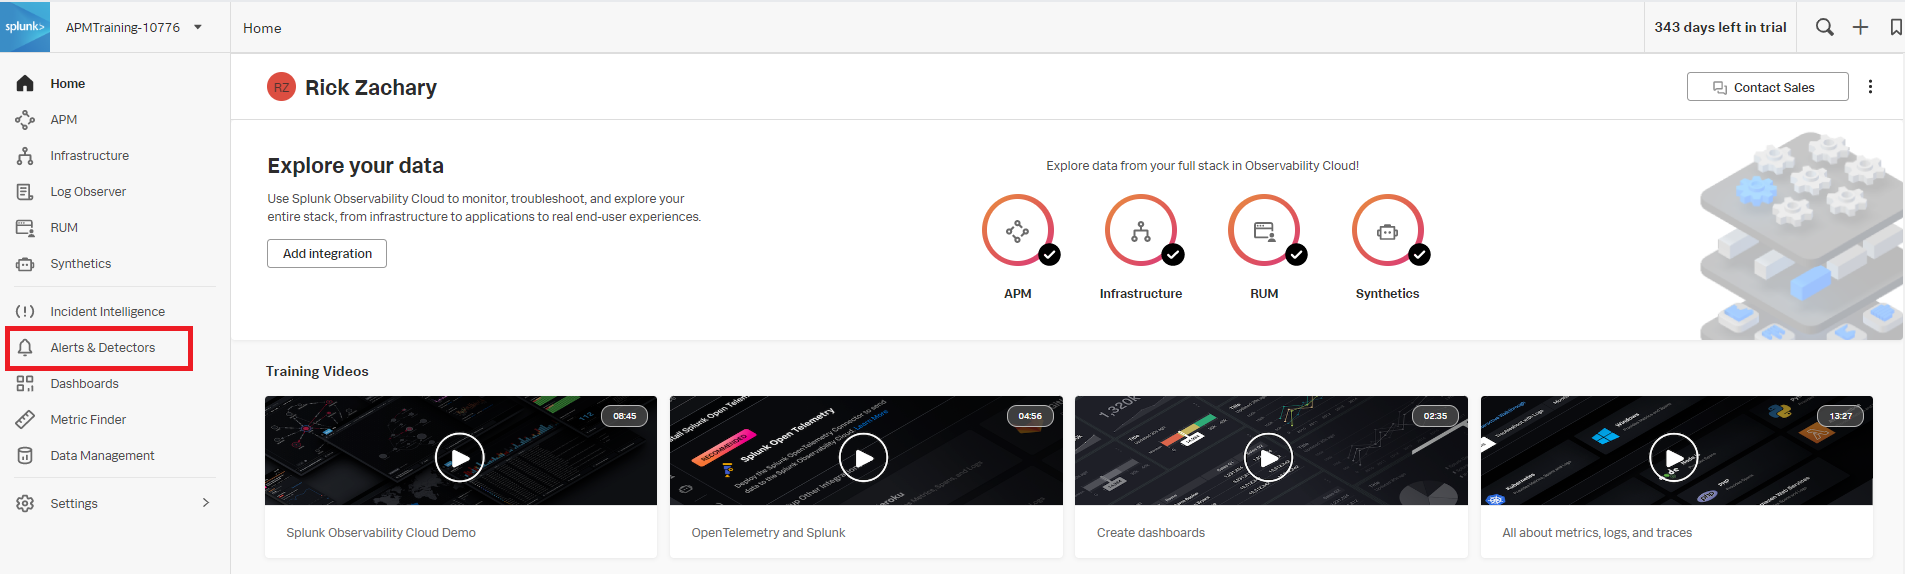
- In Splunk Observability Cloud, click Alerts & Detectors in the left navigation pane.
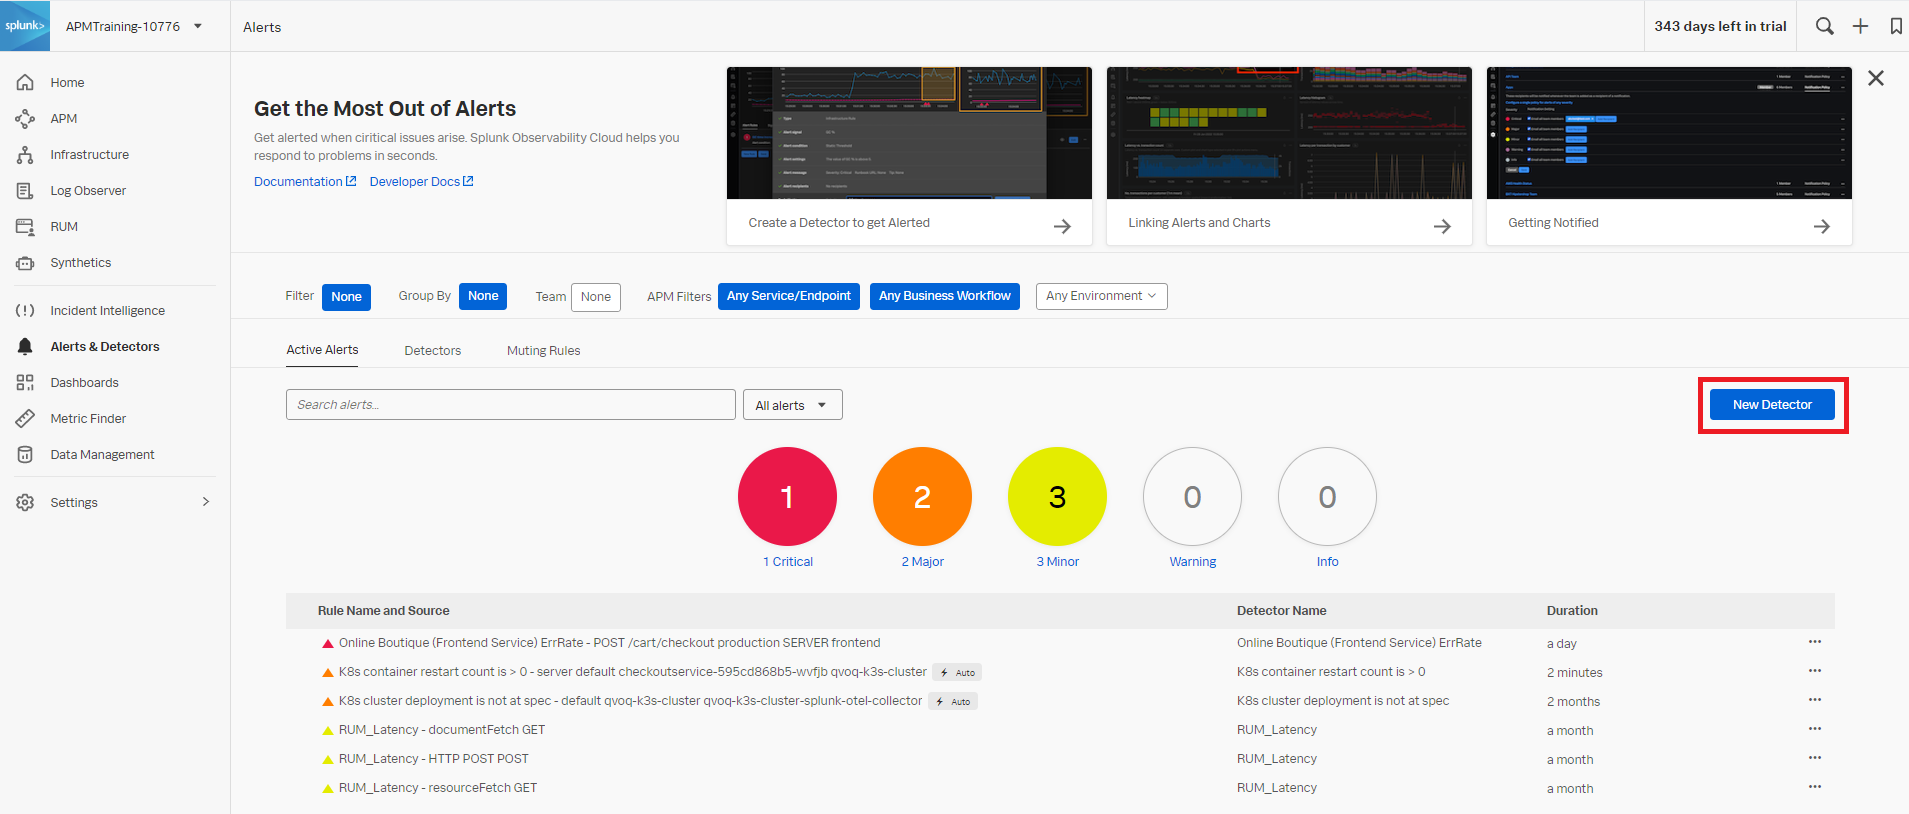
- Click New Detector.
- Enter an appropriate name for the detector. In this example,
K8s node - high cpu utilizationis used. Then click Create Alert Rule.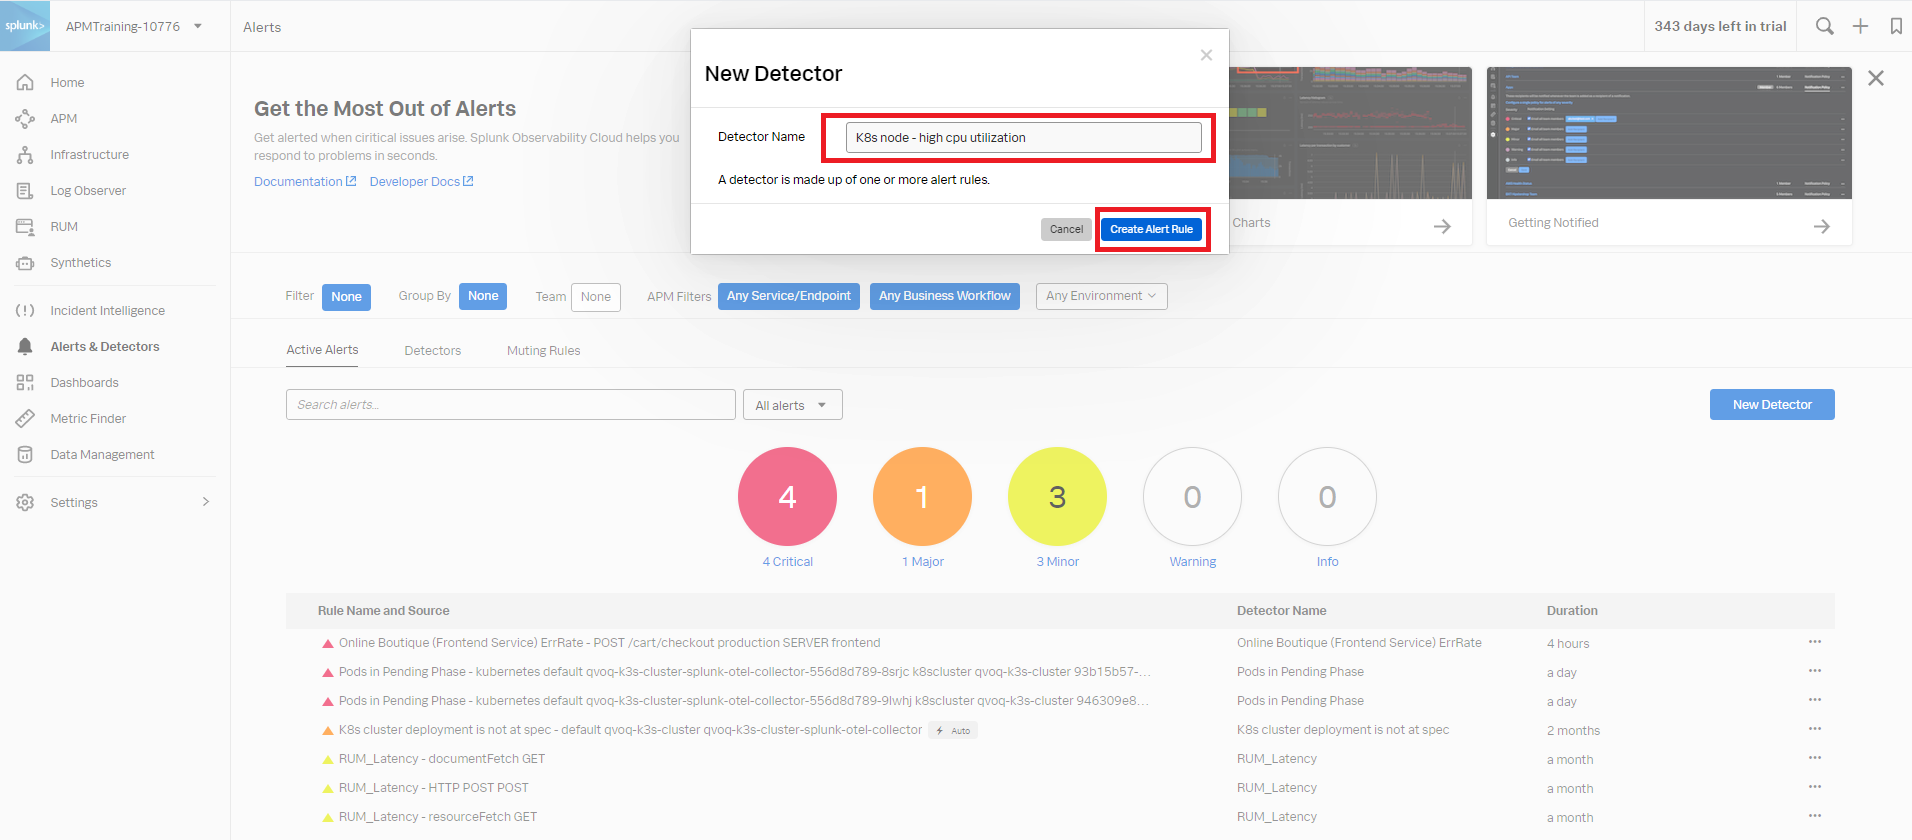
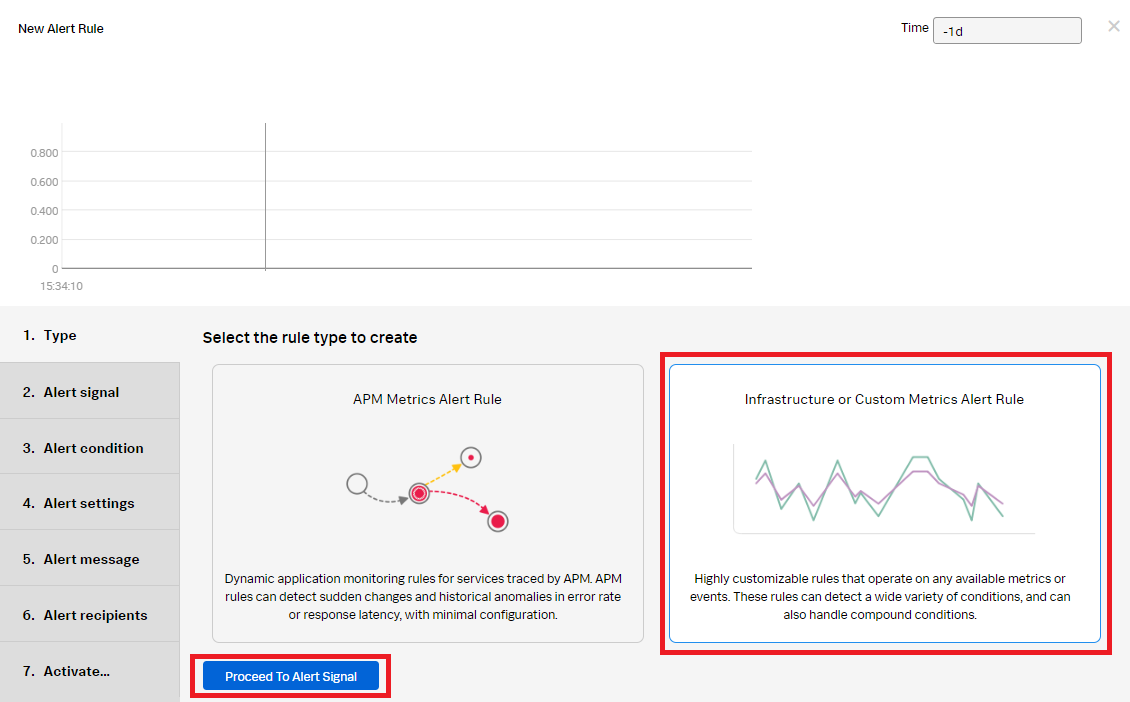
- In the New Alert Rule, select Infrastructure or Custom Metrics Alert Rule and click Proceed to Alert Signal.
- Enter the metric name. The example below shows the
metric cpu.utilization. Use the blue + icon to filter fork8s.node.name, then click Proceed to Alert Condition.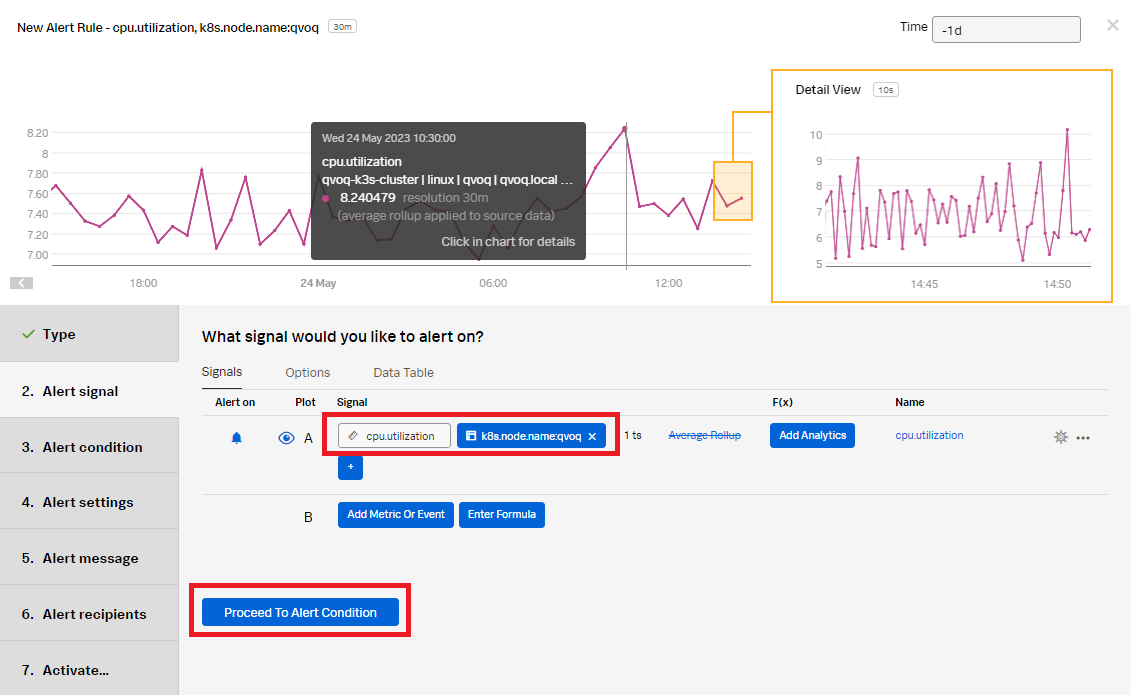
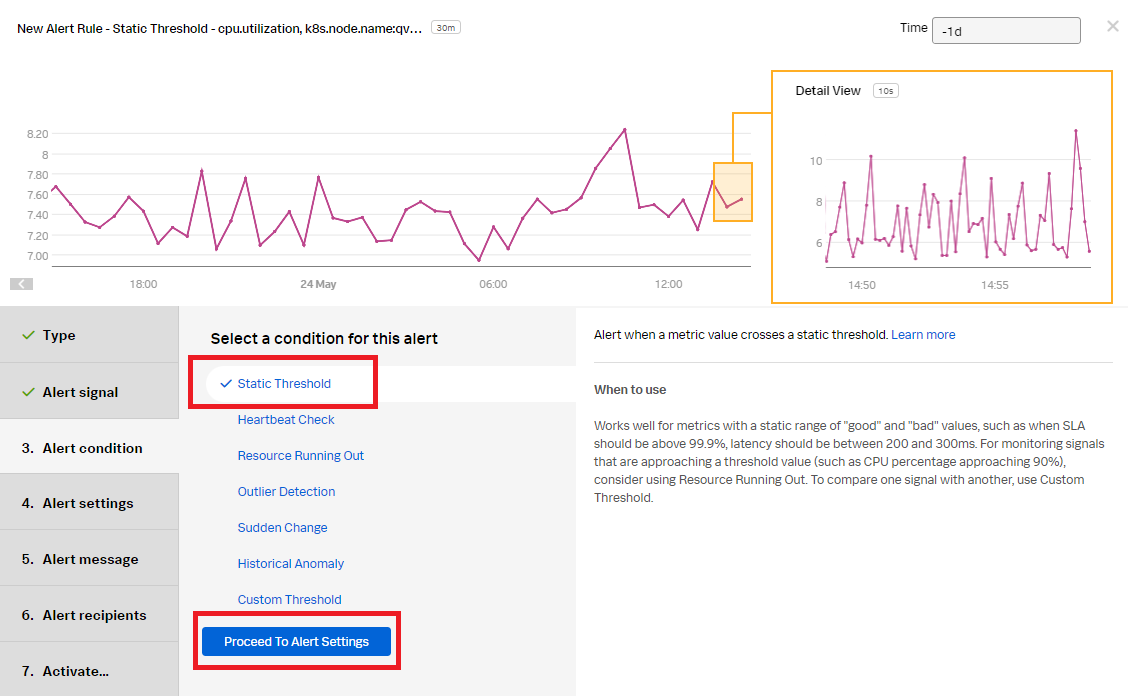
- Select Static Threshold to configure an alert when the node CPU has exceeded 90%. Click Proceed to Alert Settings.
- Enter the Alert settings for the conditions the alert will trigger on:
- Alert when: Select Above.
- Threshold: Set to 90.
- Trigger sensitivity: Select duration (to avoid any random spikes in CPU).
- Duration: Set to 5m.
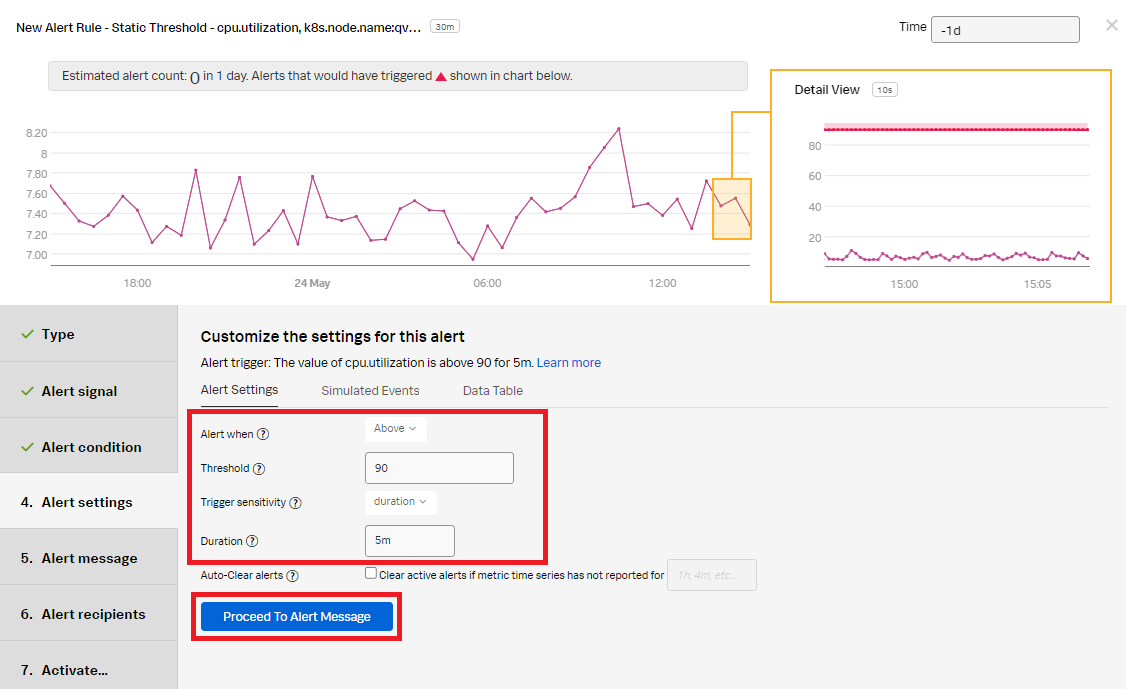
- Click Proceed to Alert Message.
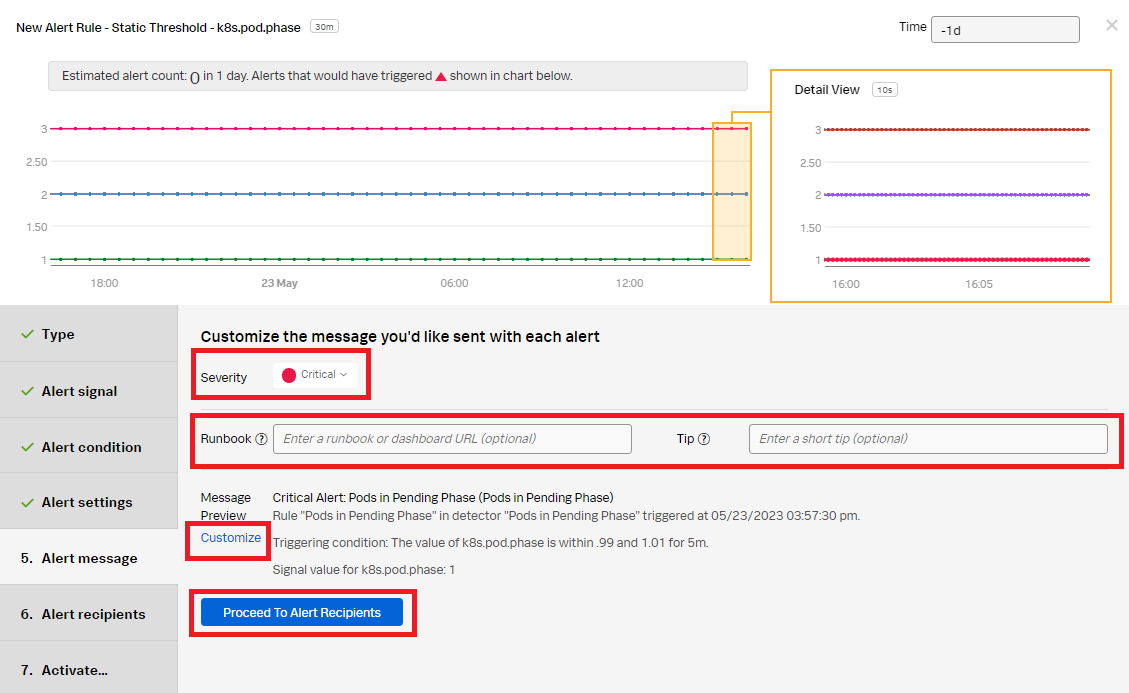
- In the Alert message:
- Set the alert Severity. You can choose from Critical, Major, Minor, Warning, or Info, depending on how you perceive the alert severity.
- (Optional) Enter a Runbook or dashboard URL, and enter a short tip for end users who might be troubleshooting the alert.
- (Optional) Customize the alert message further by clicking Customize.
- Click Proceed to Alert Recipients.
- Click Add Recipient to customize the recipients to send the alert message to. You can choose to add your own email address, any email, team, or webhook.

- Click Proceed to Alert Activation.
- Click Activate Alert Rule.
The appropriate recipients will now be notified when the alert rule conditions have been met.
Next steps
These additional Splunk resources might help you understand and implement these recommendations:
- Splunk Education: Visualizing and alerting in Splunk IM
- Splunk Education: Kubernetes monitoring with Splunk Observability Cloud