Monitoring Adobe Experience Manager as a Cloud Service
You are an Adobe Experience Manager (AEM) Cloud administrator, developer, or DevOps engineer who wants to gain end-to-end visibility into your AEM Cloud environment to improve application performance and user experience.
This article explains how using the Splunk platform and Splunk Observability Cloud with AEM Cloud as a Service can streamline performance monitoring, troubleshooting, and optimization. By enabling full observability for AEM, you can gain end-to-end visibility across the entire system, from front end to back end.
By following this guide, you’ll learn how to:
- Set up integration with AEM
- Monitor application performance across AEM instances
- Troubleshoot user flows and application logic
- Get insights into real-world user experiences with Splunk Real User Monitoring
- Identify problems before they impact real users with Splunk Synthetic Monitoring
As well as the outcomes above, you can also use Splunk Observability Cloud with AEM data to monitor and debug microservices, develop distributed applications using OpenTelemetry, or configure alerts to notify you if your AEM systems or hosted applications are not responding according to your set thresholds.
With these tools in place, you’ll be equipped to detect, analyze, and resolve issues swiftly, optimizing both user experience and operational efficiency across your AEM Cloud instances.
Data required
The AEM Cloud ecosystem
The AEM ecosystem includes critical components to manage and deliver content:
- Author instance: Where creators manage content.
- Publish instance: Delivers content to end-users.
- Dispatcher: Provides caching and load balancing for performance optimization.
- Repos: Stores the assets and configurations for the AEM instance.
- Akamai CDN: Ensures efficient content delivery to end-users.
Splunk integrates with AEM Cloud for advanced observability through:
- Splunk Real User Monitoring: Tracks real-time user interactions with the AEM interface, monitors front-end performance, including page load times and user journey metrics, and helps identify performance bottlenecks affecting the user experience.
- Splunk Synthetic Monitoring: Simulates user traffic to test the availability and performance of the AEM Publish instance, Ensures proactive monitoring of AEM services, even during low traffic periods, and alerts on anomalies like slow response times or service outages.
- Dashboards: Provide centralized views of logs, metrics, and traces to monitor performance and errors, and gain business insights.

How to use Splunk software for this use case
Setup
Follow the Adobe Cloud Builder documentation for Splunk Enterprise or Splunk Cloud Platform to forward application logs from AEM Cloud to your Splunk platform instance. You can also review the documentation to identify when to use log forwarding.
Ensure that logs are being forwarded by viewing indexed data in your Splunk platform instance. You should see the index in the following format:

Logs should appear in the designated AEM Cloud index with specific source types:
aemerror: AEM error logs from all instancesaemrequest: AEM request logs from authors and publishersaemaccess: AEM access logs from authors and publishershttpdaccess: Apache Dispatcher access logsaemqueryrecorder: AEM query debug logsaemdispatcher: AEM Dispatcher logshttpderror: Apache error logs

Monitoring application performance across AEM instances
You can use SPL to create a variety of valuable dashboards to monitor the end-to-end performance of your AEM system and applications. Some key metrics you can build dashboards around include:
- Average response time across AEM Publish → Dispatcher and Content Delivery Network (CDN)
- Requests by content type
- Requests by GET vs. POST
- Requests by status
- AEM replication statistics
- Dispatcher caching statistics
- Active authors over time
- AEM workflow performance
- Top errors across the AEM application
- Content delivery network (CDN) performance
Each of the following SPL snippets can have different visualizations created from them which can be turned into the dashboards shown. For more information on how to create AEM dashboards using SPL, see this blog.
AEM dashboard
You can create a dashboard to provide valuable insights into AEM publish instances, including the average response time over the last 24 hours, cache performance, and requests categorized by status to help identify problematic pages. Additionally, it could display overall error rates across all AEM publish instances.

Run the following searches. You can optimize them by adjusting the time range.
Generate AEM publish dashboards
 index="aemcloud-*" aem_tier=publish sourcetype=aemaccess
 | spath method
 | search method=GET
 | spath path
 | search path!="/metrics"
Errors (PUB) / Top errors across the AEM application
index=aemcloud level=ERROR aem_tier=publish  sourcetype=aemerror  aem_env_id=$environment$
|  rex field=msg "status: (?<status>\d+).*?response: (?<response>{.*})"
Requests by status (AEM PUB)
index=aemcloud sourcetype=aemrequest  aem_tier=publish  aem_tier=$instance_type$ aem_env_id=$environment$
| stats count BY code
Requests by content type (PUB)
index=aemcloud  aem_tier=publish  sourcetype=aemrequest  aem_tier=$instance_type$ aem_env_id=$environment$
| stats count BY content_type
PROD publish POST requests
index=aemcloud aem_tier=publish  aem_env_id=$environment$ sourcetype=aemaccess "POST"
| stats count BY method
PROD publish GET requests
index=aemcloud aem_tier=publish  aem_env_id=$environment$ sourcetype=aemaccess "GET"
| stats count BY method
Top requests
index=aemcloud aem_tier=publish  aem_env_id=$environment$ sourcetype=aemaccess
| spath path
| search path!="/systemready /lib /adobe"
| spath path
| stats  count BY path
Content delivery network (CDN) traffic dashboard
This CDN traffic dashboard highlights the CDN performance of the AEM site by showcasing overall traffic and total requests served by CDN versus origin over the last 24 hours. It also categorizes requests by status to help identify problematic pages.

For additional guidance on sending Akamai CDN logs to the Splunk platform, see this page.
Run the following searches. You can optimize them by adjusting the time range.
Hourly incoming requests by status
index="akamai-cdn" sourcetype=httpevent  NOT "libs/granite/csrf/token.json" OR "/akamai/sureroute-test-object" OR "ELB-HealthChecker"
| timechart span=1h count BY status
CDN traffic by HTTP method
index="akamai-cdn" sourcetype=httpevent  NOT "libs/granite/csrf/token.json" OR "/akamai/sureroute-test-object" OR "ELB-HealthChecker" OR  "/static/testobject.html" "POST"
| timechart span=5m count BY http_method
Site traffic by status
index="akamai-cdn" sourcetype=httpevent  NOT "libs/granite/csrf/token.json" OR "/akamai/sureroute-test-object" OR "ELB-HealthChecker" OR  "/static/testobject.html"
| timechart span=1h count BY status
Max age
index="akamai-cdn" sourcetype=httpevent  NOT "libs/granite/csrf/token.json" OR "/akamai/sureroute-test-object" OR "ELB-HealthChecker" OR  "/static/testobject.html"
| top limit=20 max_age
Cached % - Cache data (1 ) from the edge, or (0)
index="akamai-cdn" sourcetype=httpevent  NOT "libs/granite/csrf/token.json" OR "/akamai/sureroute-test-object" OR "ELB-HealthChecker" OR  "/static/testobject.html"
| top limit=20 cached_field
Requests by host
index="akamai-cdn" sourcetype=httpevent  NOT "libs/granite/csrf/token.json" OR "/akamai/sureroute-test-object" OR "ELB-HealthChecker" OR  "/static/testobject.html"
| timechart span=5m count BY request_host
DNS lookup time
index="akamai-cdn" sourcetype=httpevent  NOT "libs/granite/csrf/token.json" OR "/akamai/sureroute-test-object" OR "ELB-HealthChecker" OR  "/static/testobject.html"
| top limit=20 dns_lookup_time
AEM author dashboard
You could also create an AEM author dashboard to provide insights into the AEM author instance, such as the number of active authors over the past 24 hours, GET vs. POST requests, and additional metrics to help monitor the performance of the author instance.
To get active author counts for a given period, run the following search. You can optimize it by adjusting the time range.
index="aemcloud-*" aem_tier=author sourcetype=aemaccess
| spath method
| search method=GET
| spath path
| search path!="/metrics"
AEM application dashboard
An AEM application dashboard can provide details about your OSGi services, and could be useful for monitoring the overall performance of services running within the AEM container.
Run the following search to get all 400 errors across the PurgeService OSGi. You can optimize the search by adjusting the time range.
 index="aemcloud-*" aem_tier=publish sourcetype=aemerror "*.CDNPurgeServiceImpl" AND  "400 Bad Request"
 |stats count
 |rename count AS ERROR_COUNT
AEM code deployment dashboard
An AEM code deployment dashboard can function as a release management tool for agile teams, ensuring that the correct code is running on AEM instances (Author/Publish).
Run the following search to track AEM code deployments, focusing on custom OSGi bundles to ensure correct versions are deployed and running on AEM instances. You can optimize it by adjusting the time range.
 index="aemcloud-*" aem_tier=* state=* "entity=bundle:*custom*" host!="*-previewstg.*"
| eval Date = strftime(_time, "%Y-%m-%d")
| eval Time = strftime(_time, "%H:%M:%S")
| table Date, Time, Bundle_Version, host, state, Bundle_SymbolicName
| rename Bundle_Version AS "Bundle Version", host AS "Host", state AS "State", Bundle_SymbolicName AS "OSGI Bundle"
Troubleshooting user flows and application logic
You can monitor your user-flows or application logic in AEM by monitoring metrics such as:
- Average response time of the endpoint or Open Service Gateway Initiative (OSGi) service
- Error stats by service
- Total downloads, signups, etc.
The screenshot below shows an example service map in Splunk Application Performance Monitoring of AEM-centric applications containing AEM author and publish instances, along with the custom microservices that manage the business logic.

Get insights into real-world user experience
Splunk Real User Monitoring (RUM) offers comprehensive insights into the frontend performance of your AEM application. By tracking real user data, you can optimize web performance and deliver exceptional user experiences. It allows you to correlate synthetic tests, backend metrics, traces, and logs in one platform, enabling swift identification and resolution of performance issues across your AEM application stack.
Additionally, Splunk Real User Monitoring can record navigation with session replay, allowing you to reconstruct user sessions and expedite troubleshooting with full context.
When looking to configure backend metrics, be aware that Adobe Cloud out-of-the-box capabilities do not natively support OpenTelemetry (OTel) integration, and Splunk Observability Cloud features are limited when using out-of-the-box solutions. You might need to talk to Adobe support to enable OTel.
To set up Splunk Real User Monitoring and instrument it with AEM:
- Generate your RUM access token via this link.
- Add the following code in your AEM template in the head.html area. For more information on this process, see Instrument browser-based web applications for Splunk RUM.
<sly>
<script>src="https://cdn.O11Y.com/o11y-gdi-rum/<version>/splunk-otel-web.js" crossorigin="anonymous"></script>
<script>
    SplunkRum.init({
       realm: "realm",
       rumAccessToken: "$yourToken",
       applicationName: "MyApp",
       deploymentEnvironment: "PROD"
    });
</script>
<script src="https://cdn.O11Y.com/o11y-gdi-rum/<version>/splunk-otel-web-session-recorder.js" crossorigin="anonymous"></script>
<script>
SplunkSessionRecorder.init({
  app: "MyApp",
  realm: "realm",
  rumAccessToken: "$yourToken"
});
</script>
</sly>
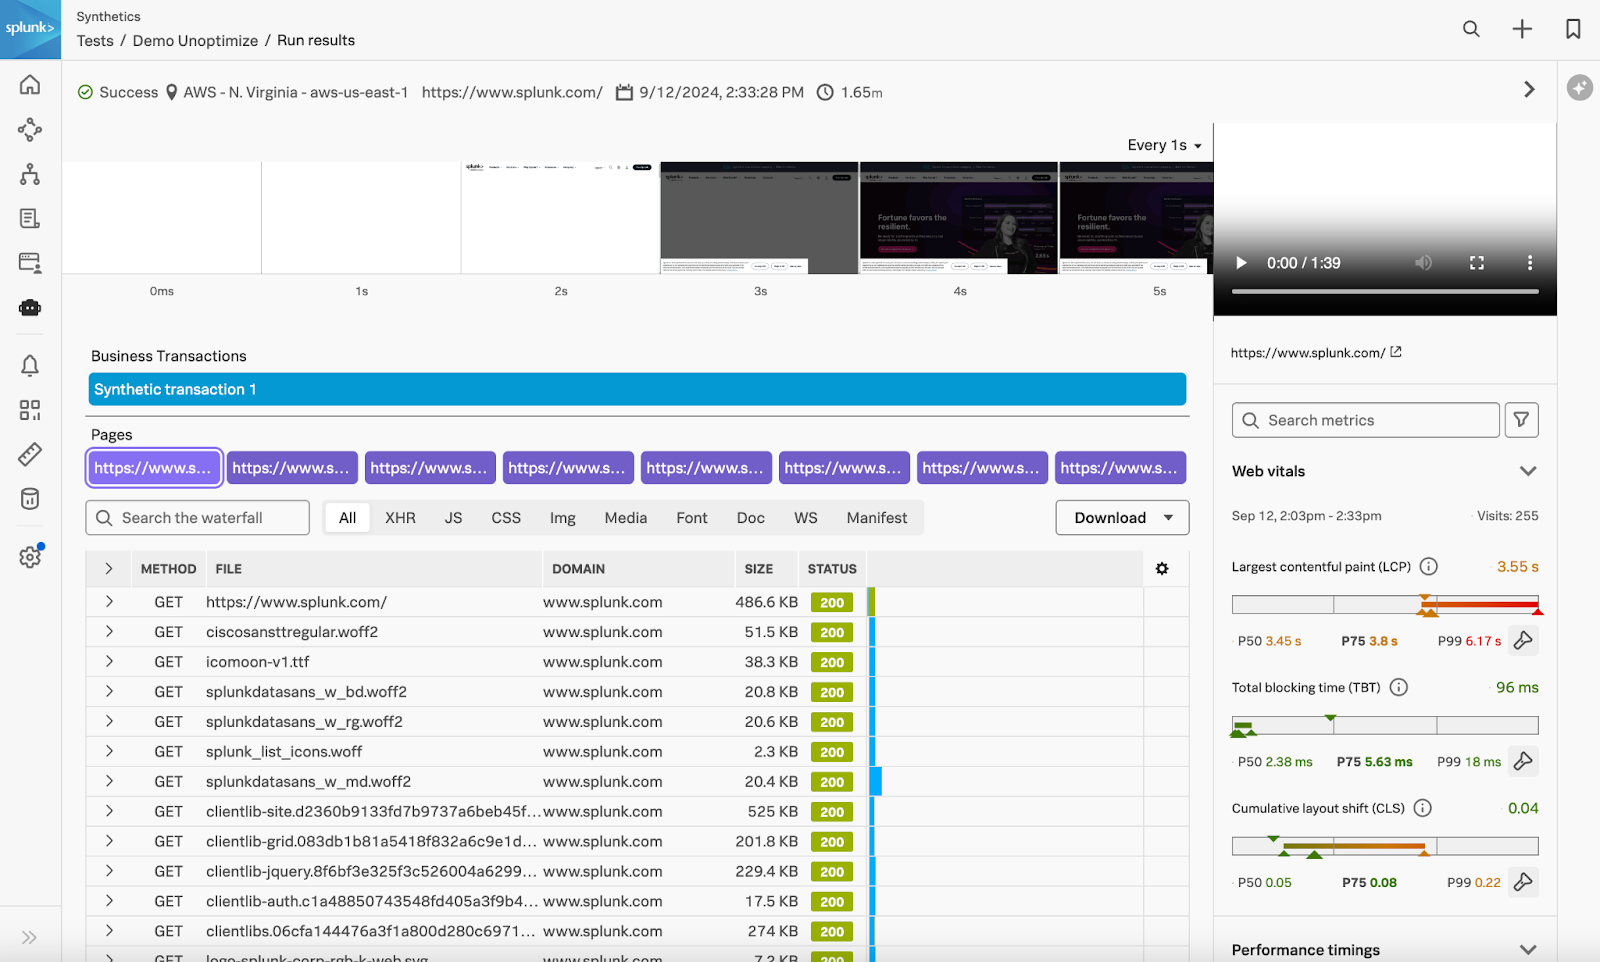
Your AEM-based website will now be equipped to capture RUM data in Splunk Observability Cloud, giving you valuable insights into the performance and health of your website, including support for single-page applications and mobile web views. The following screenshot shows an example RUM dashboard containing page views, page load times, and key core web vitals metrics such as largest contentful paint (LCP) and cumulative layout shift (CLS), allowing developers to take action based on a comprehensive analysis of user experience.

You can also use session replay in Splunk Real User Monitoring to get a complete view of a user’s interaction on a form page. This tool is invaluable for identifying user bottlenecks in your production environment. The screenshot below shows an example user session that shows the interactions of real users, not bots. Looking at this, you can follow the user's interaction flow to immediately spot issues like delayed page loads. You can then review the network trace to check if third-party scripts are responsible. With this level of detail, you can focus on specific load events or scripts causing the slowdown, while disregarding unrelated events like form fills and validations.

Identify problems before they impact real users
Splunk Synthetic Monitoring allows you to proactively monitor end-user experiences by testing application availability and performance across both production and development environments. This enables you to detect and resolve issues early, ensuring an optimized digital experience before users are impacted. Using Splunk Synthetic Monitoring allows you to easily gather feedback on new features before they go live, giving your engineering team immediate insights.
Your team can also set up alerts to receive immediate notifications of potential problems.
Setup
Follow the instructions in the Splunk Observability Cloud documentation to set up Splunk Synthetic Monitoring. The installation is straightforward with no complex configuration required, and you can start by creating your first test directly in the user interface.
Add monitoring scripts
Follow the steps in this article to add a test script to monitor your AEM-based web application. There are three types of tests you can run: Browser, Uptime, and API.
You can use Google Chrome Recorder to create a baseline browser test script for your multi-step user journey test. For more information, see Create a Google Chrome Recorder JSON file.
After you've set up your tests, the Synthetics Tests dashboard shows all of the tests set up for AEM application features, along with their pass or fail status, as shown below.
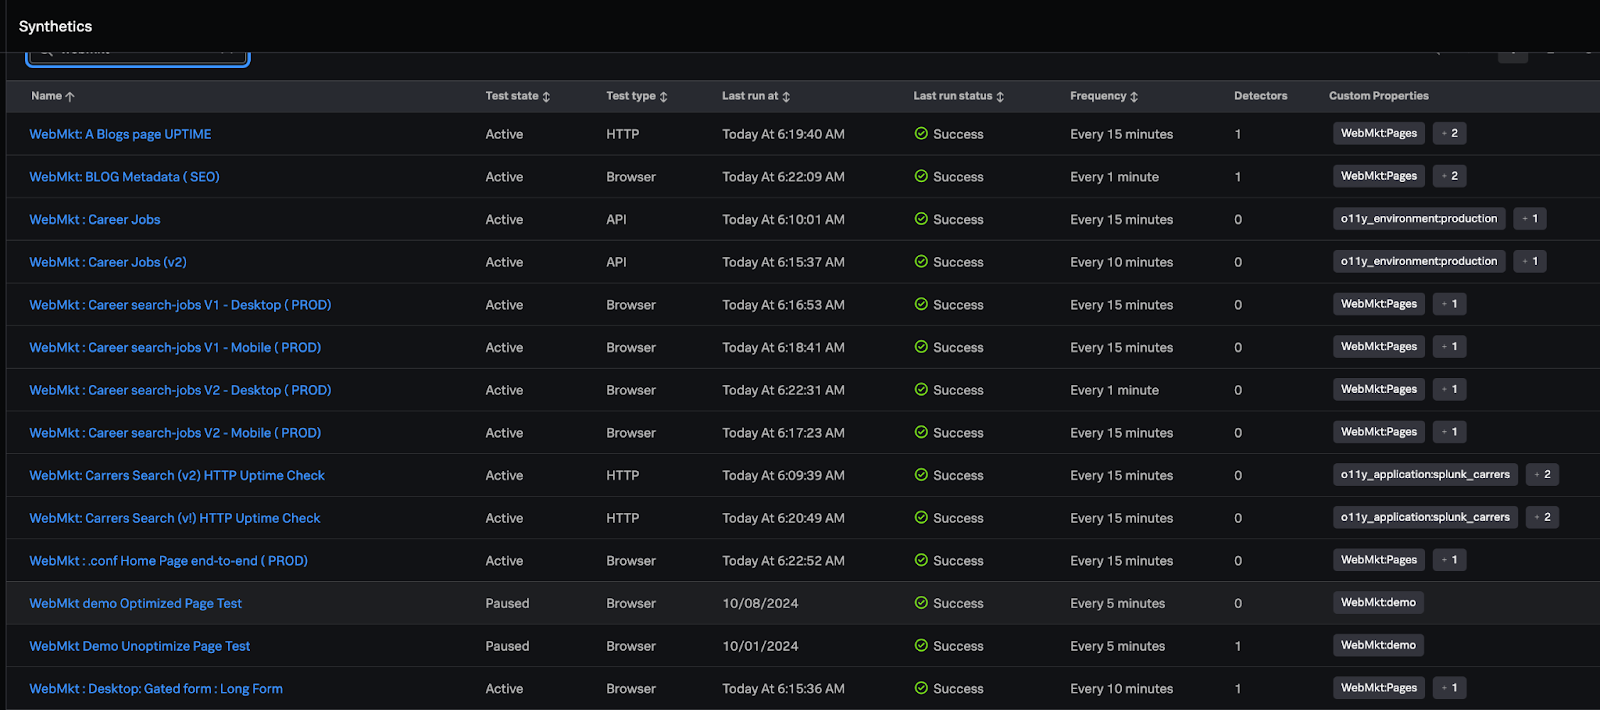
You can also look into the detail of individual tests to learn more about potential issues.
You can also set up dashboards to get an overall view of the health of your entire AEM application. The screenshot below shows an example of a dashboard configured to display the results of API and Uptime tests.
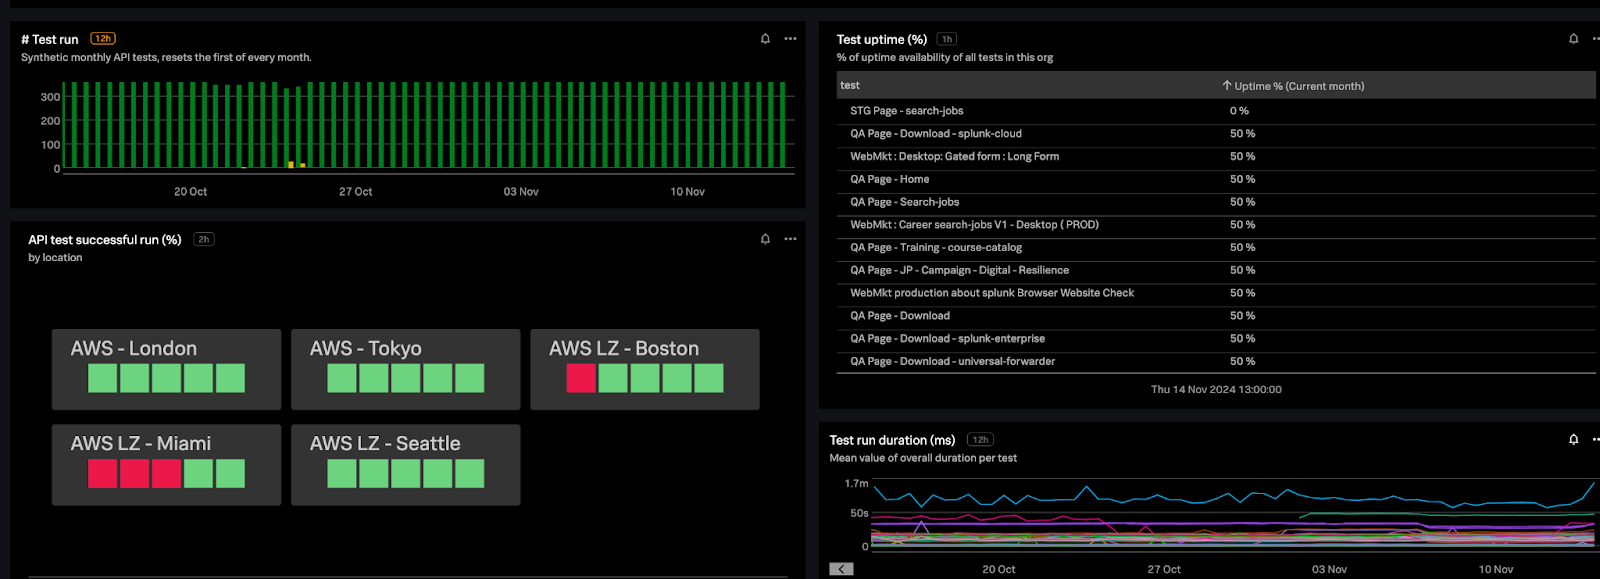
Splunk Synthetic Monitoring has built-in performance KPI charts, like the ones shown above, that allow you to track key metrics over time. The charts are fully customizable, so you can tailor them to monitor the KPIs most relevant to your business.
Learn more about how to create and customize dashboards in the Splunk Observability Cloud documentation.
Monitoring, updating, and optimizing AEM instances
After your AEM Cloud is integrated with Splunk Observability Cloud, it's important to continuously monitor, update, and optimize your AEM instances as part of your agile development process.
- Regular reviews. Continuously review performance data in Splunk Observability Cloud, review the error matrix, and adjust thresholds and monitoring configuration as needed.
- Performance tuning. Leverage insights from Splunk Observability Cloud to optimize code, improve server configurations, and enhance website or application performance.
- Team collaboration. Share insights with development, DevOps, and QA teams to drive ongoing performance improvements.
Next steps
After completing the use cases above, you can also use Splunk Observability Cloud with AEM data to monitor and debug microservices, develop distributed applications using OpenTelemetry, or configure alerts.
- Microservices. In many AEM environments it’s common to have microservices running to support non-CMS-centric tasks (for example, shopping carts or product catalogs). Splunk tools can be useful for monitoring the performance of these microservices and for debugging application-related issues. Visit the following pages to learn how to debug microservices with distributed tracing and real-time log analytics, or integrate Spring Boot logs with Splunk for enhanced microservices monitoring. Developers can also extend microservices and AEM OSGi services using OpenTelemetry, enabling logging to enhance observability. Visit the following page to learn how to develop distributed applications using OTel.
- Alerting. You can configure alerts to notify you if your AEM systems or hosted applications are not responding according to your set thresholds. For more details on setting up alerts, see the alerts documentation, or Managing the lifecycle of an alert: from detection to remediation.