Monitoring user experience with web page performance
As a service owner responsible for your company's online storefront, you need to identify and respond to service degradations that adversely affect your customers' digital experience. You want to identify performance issues before end users (customers) are impacted. You also want to drive operational optimization and excellence within your organization to improve mean-time-to-detect (MTTD) and mean-time-to-respond (MTTR).
Data required
Scenario
Competing and maintaining a competitive edge requires frequent code updates to your application’s underlying microservices. Service degradation from new releases could cause customers to become frustrated, leading them to explore competitors' web sites for a better experience leading to a loss of revenue.
In the long term, the team needs solutions to the following questions:
- How do we ensure service degradation issues introduced from code changes are discovered before it affects our customers?
- How do we emulate what a customer experiences while going through the end-to-end process of selecting and ordering one of our products?
More immediately, a new release to the Payment Service (‘paymentservice’) microservice will be deployed. The team knows that the ‘paymentservice’ code release could cause application degradation when the customer attempts to buy goods available on your company’s storefront.
How to use Splunk software for this use case
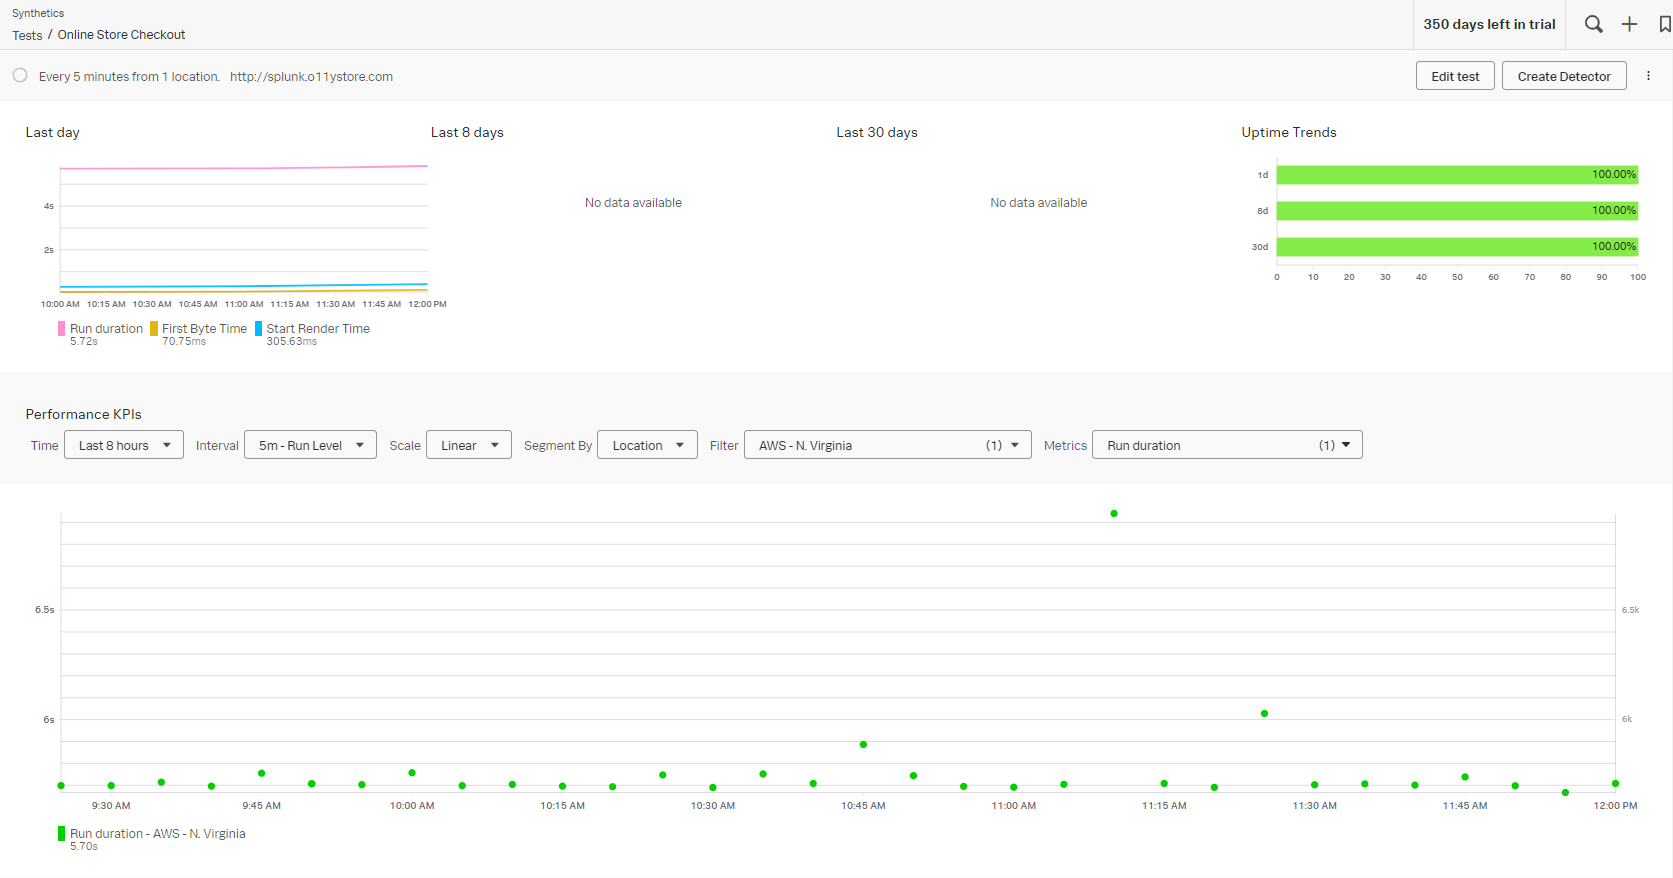
During a browser test, Splunk Synthetic Monitoring continuously collects performance data including metrics, network data, and custom user timings. All requests and responses that occur in the test are captured in a HAR file, which is represented visually in a waterfall chart that illustrates the latency of specific resources on the page.
During a test, Splunk Synthetic Monitoring also creates a filmstrip and video of all actions executed in the test so that teams can see first-hand what the page looks like to a user.
Your team decides to record and test a Real Browser Check at scheduled intervals from strategic locations to identify (MTTD) and resolve (MTTR) potential issues before customers are impacted.
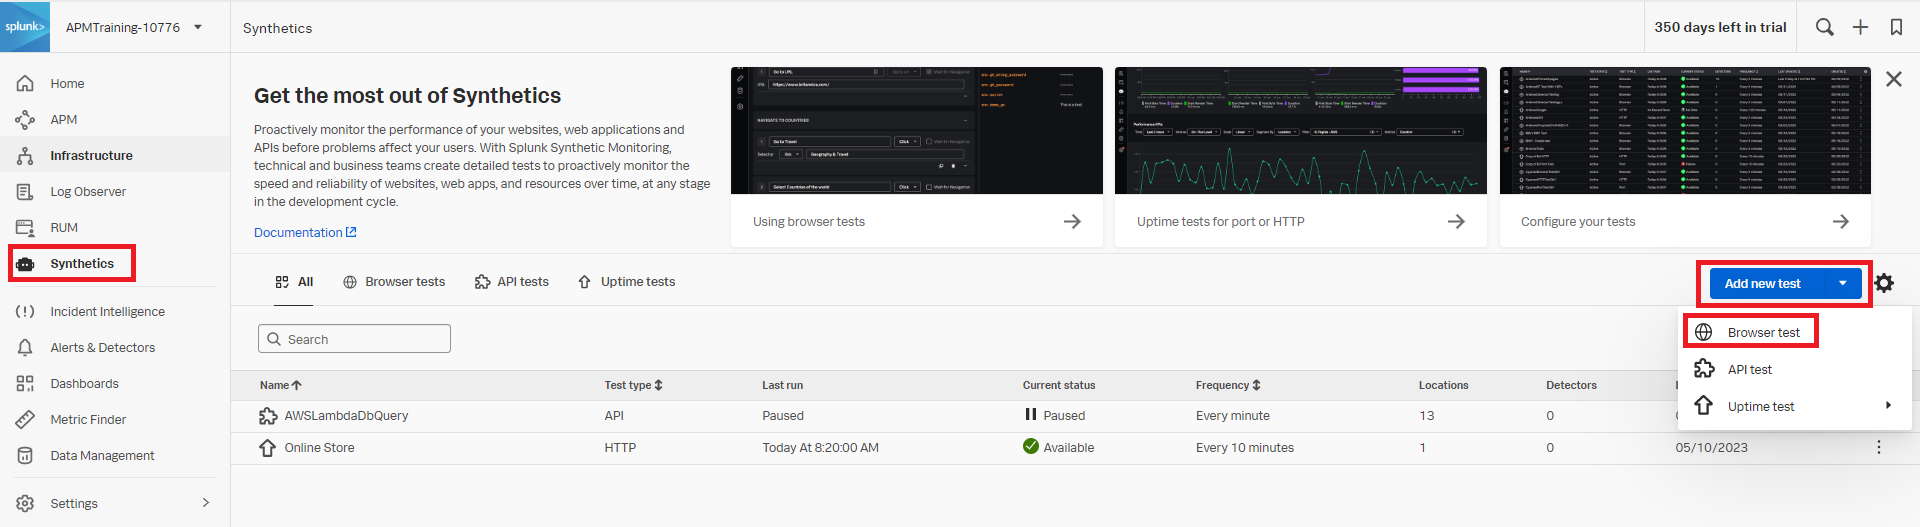
- In Splunk Observability Cloud, click the Synthetics application in the left navigation page, then click Add new test > Browser test.
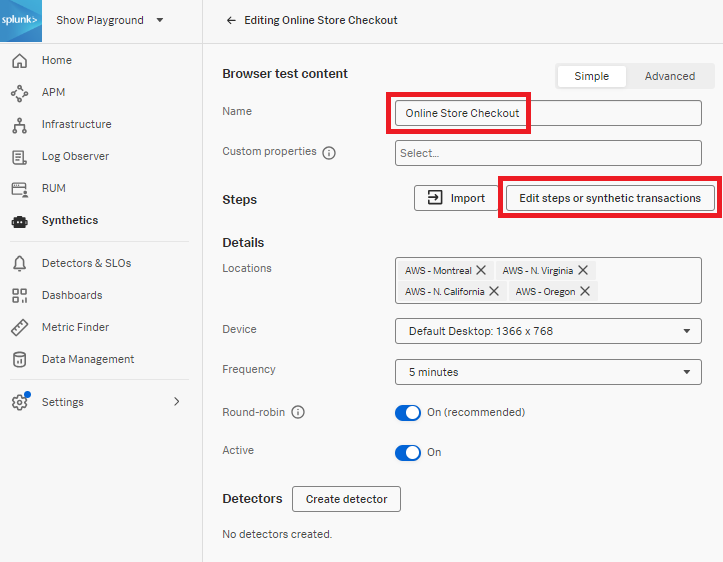
- Create a Simple test.
- Enter the test Name. You should use a naming convention to easily identify the service ‘checkout’ being tested.
- Click + Edit steps or synthetic transactions.
- The first step is auto created as a Go to URL action. Enter the URL (in this example, we're using splunk.o11ystore.com) and click + Step to add additional steps.

- Create the steps that are used by the checkout service. The next three steps in this example are Click T-Shirt, Add to Cart, and Place Order. For each of these, select Click from the drop-down menu, then add the Selectors appropriate to each step. In this example, CSS selectors are used for each step.

- For the final step of the order confirmation in the checkout service, click Assert text present from the drop-down menu and enter the value Your order is complete!.

- As you build your test, you can use Try now to check that the configuration of your test is valid. Start by clicking Try now.
- Wait for "Test validation: succeeded".
- After the test validates successfully, click < Return to test to finalize the configuration.

- Now, you'll need to create your detectors. Start by clicking Create detector.

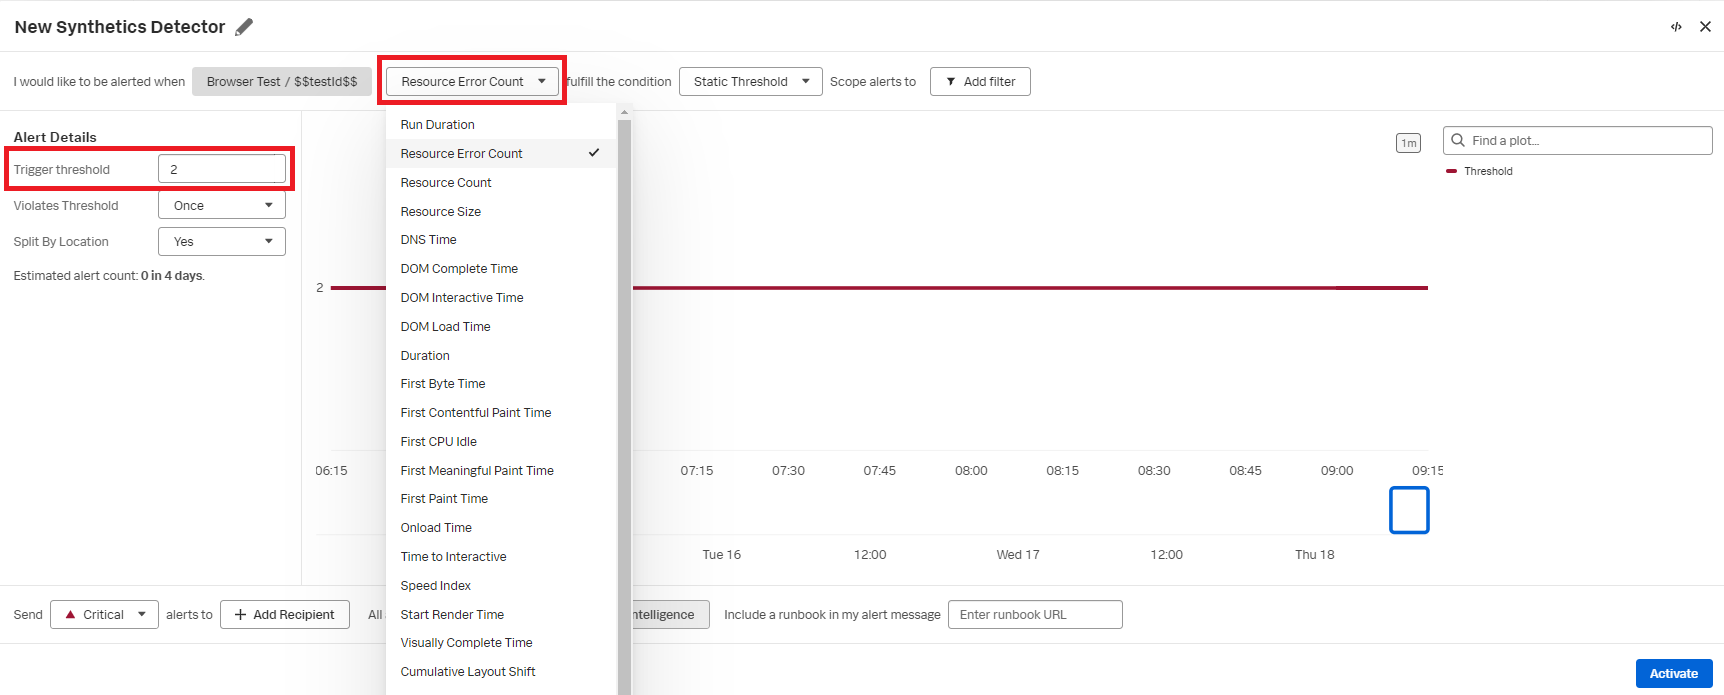
- Select Resource Error Count from the drop-down menu, and enter a Trigger threshold of 2.
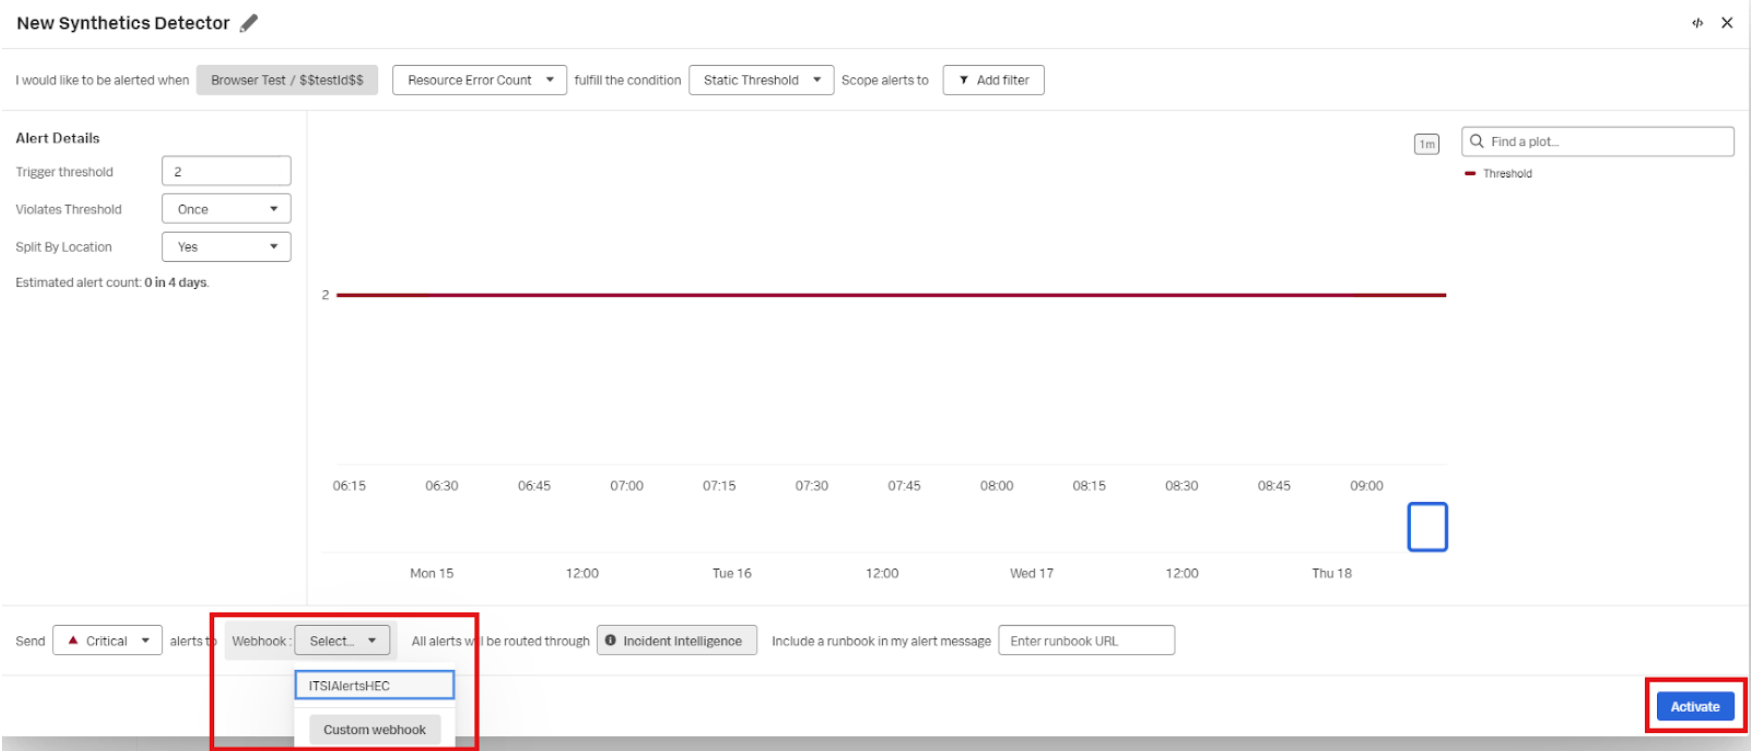
- Select ITSIAlertsHEC from the Webhook drop-down menu and click Activate.
- Click to Submit the test.
Now when an alert threshold has been breached, you will be notified that the application is unavailable, so you can take appropriate action to resolve the problem.
Next steps
Now you know how to create a basic browser test, you can move on to create more complex tests. If you have tests with multiple steps that would take some time to write up manually, you can use the Chrome Script Importer to simplify and expedite the browser test creation process. This reduces manual effort and helps you broaden the scope of your monitoring to these more complex browser tests.
These resources might also help you understand and implement this guidance:
- Splunk Observability Docs: Interpret browser test results - Waterfall chart
- Splunk Observability Docs: Browser test metrics
- Splunk Observability Training Courses: Comprehensive Splunk training to fully unlock the power of Splunk Observability Cloud.