Moving to observability with ITSI
Your organization is undergoing a lot of change. You're moving to Observability, modernizing IT Operations or moving from monolith to microservices. In light of this, different areas of your organization are developing new requirements for insights and information, for example:
- IT Operations need to have visibility into the performance and availability of applications and infrastructure to quickly repair or report issues to be remediated and to ensure services are delivered to all customers without interruption.
- CIOs / CTOs need to ensure full visibility and awareness of key systems and applications to ensure that business leaders are able to operate the business without interruption or incident.
- Business leaders need to understand the end user experience, application performance, and infrastructure performance so they can operate the business effectively and serve customers with speed and efficiency.
- Support Analysts need immediate insights into the status of all key services across the business to best serve stakeholders quickly and with accurate information.
- DevOps / SREs need to ensure services are delivered to all customers without interruption and provide stakeholders with visibility into the performance and availability of applications and infrastructure, which will allow for them to be best informed and aware.
- DevSecOps need to provide insights into the lower and production environments, to increase accountability for security, and deliver secure services faster with reduced business and customer risk.
Solution
The Content Pack for Splunk Observability Cloud can help you meet these needs. It brings together Splunk Synthetic Monitoring, Splunk Infrastructure Monitoring, Splunk Application Performance Monitoring and Splunk Real User Monitoring into a single view within Splunk IT Essentials Work and Splunk ITSI, giving you the ability to drill into results with a few clicks, and a deep link into Splunk Observability Cloud in context.
The Content Pack provides:
- 2 Technology add-ons (TAs)
- 5 Glass tables
- 1 Service Analyzer
- 35+ Services
- 70+ Key Performance Indicators (KPIs)
- 17+ Entity types
- 20+ Vital metrics
- 15+ Dashboards
These features help to provide views into your observability data that IT Operations, DevOps, Business, and IT Executives can understand and act on.
If you are a customer using IT Essentials Work, some of the features in the Content Pack for Splunk Observability Cloud will be more limited than the features available for customers using Splunk ITSI.
Install and configure the Content Pack for Splunk Observability Cloud
The Content Pack for Splunk Observability Cloud is bundled within the Splunk App for Content Packs v1.6.0 and up.
Features of the Content Pack for Splunk Observability Cloud
Glass tables
You can use the preconfigured glass tables within the Content Pack for Splunk Observability Cloud to visualize and monitor the relationships and dependencies across your IT and business services. They also allow you to create dynamic contextual views of your IT topology or business processes and monitor them in real time. You can add metrics like KPIs, ad hoc searches, and service health scores that update in real time against a background that you design, with real-time data generated by KPIs and services displayed.
Within the Content Pack for Splunk Observability Cloud there are 5 pre-configured glass tables:
- Executive Glass Table
- Overview Glass Table (Columns)
- Overview Glass Table (Layered with radio gauges)
- NOC Glass Table
- DevOps SRE Detailed View Glass Table
If these glass tables don't exactly fit your needs, is simple to clone them and make these examples your own.
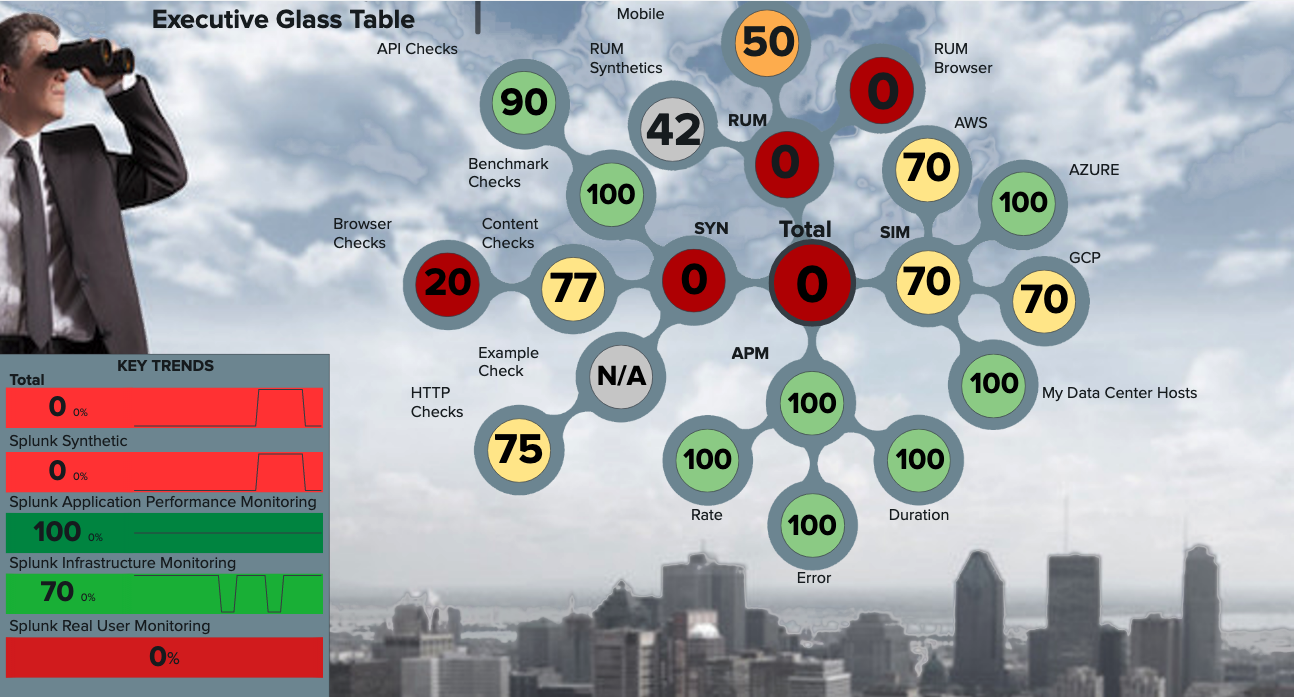
Executive Glass Table
The Executive Glass Table delivers rolled-up insights across four major observability areas: Synthetic Monitoring, Infrastructure Monitoring, Splunk Real User Monitoring, and Application Performance Monitoring. In a single view, you get a quick and real-time update as to what is going on across all of your landscape and single-click access to additional details. This answers the question of what is going on and why it’s happening, and provides a contextual deep-link to the source system in Splunk Observability Cloud. This dramatically improves MTTI, MTTD, and MTTR, by simplifying the process of finding and resolving the root cause issue quickly.
In the bottom left corner, you will also find key trends: Total, Splunk Synthetic Monitoring, Splunk Application Performance Monitoring, Splunk Infrastructure Monitoring and Splunk Real User Monitoring. This makes it easy to understand the history across your applications, infrastructure and customer experiences with a simple glance.
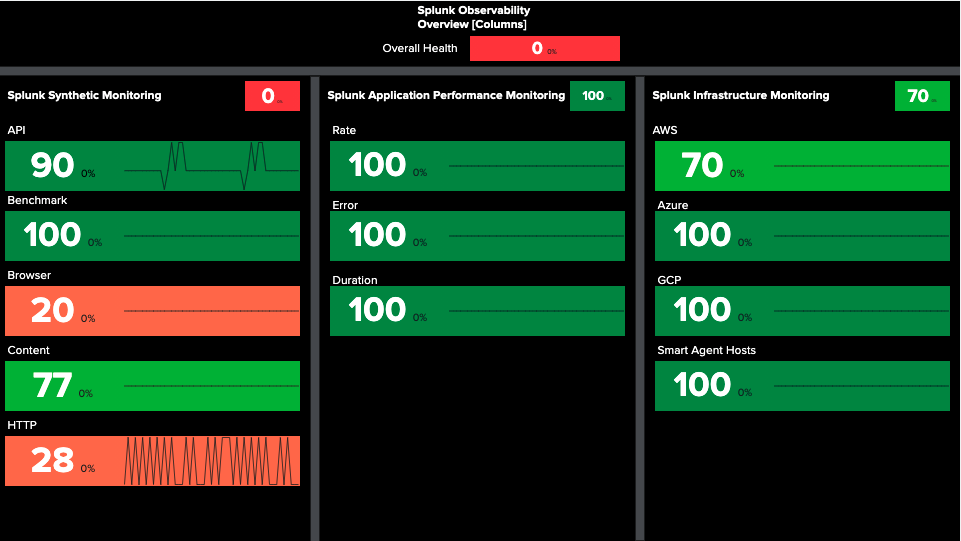
Overview Glass Table (Columns)
This glass table provides a quick overview of the Splunk Synthetic Monitoring, Splunk Infrastructure Monitoring, and Splunk Application Performance Monitoring .
After you click into the details, with another click you move into the Splunk Observability Cloud with an embedded deep link, providing you with the native results fully in context.
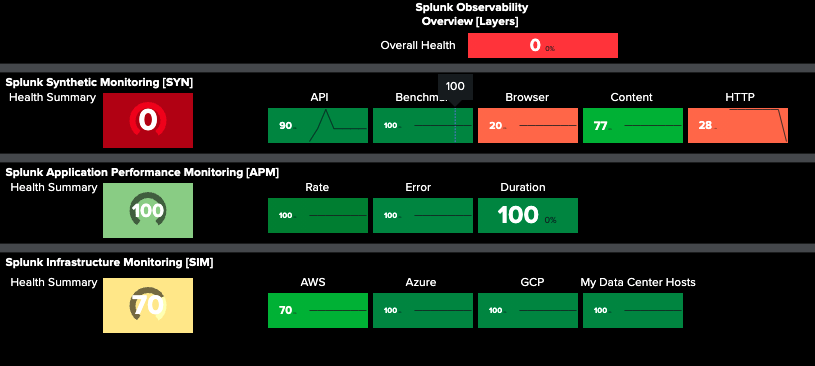
Overview Glass Table (Layered with radio gauges)
This glass table provides immediate insight and results, with the radio gauges on the left side making it simple to know where Splunk Synthetic Monitoring, Splunk Infrastructure Monitoring, and Splunk Application Performance Monitoring results are for your entire environment.
These types of insights deliver immediate value to a variety of teams and stakeholders. You can click on any of these KPIs, and get to the details, and click again to get to the Splunk Observability Cloud native results fully in context.
In the example glass table shown below, you might first click into Splunk Synthetic Monitoring to see what is going on, but you can also see there is a problem with AWS in the Infrastructure Monitoring Health Summary. That could be a root cause of the Splunk Synthetic Monitoring problem and perhaps a first place to investigate.
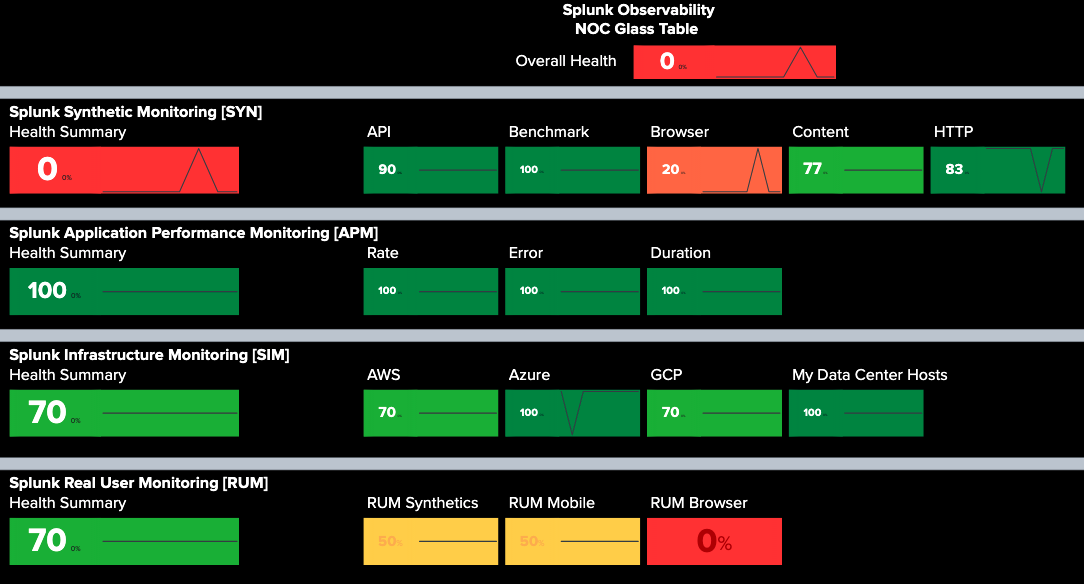
NOC Glass Table
The modern NOC (Network Operations Center) is evolving to more observability and increased awareness of what is going on across all stacks within their users, infrastructure, critical business flows, and applications.
An interactive glass table gives results in real-time, helping the NOC team to proactively manage situations or episodes as they occur, and quickly find and resolve issues.
This simplified view is designed for a wall or hallway monitor. It shows the trend and history along with current state for all your critical KPIs, rolled up for visibility and awareness.
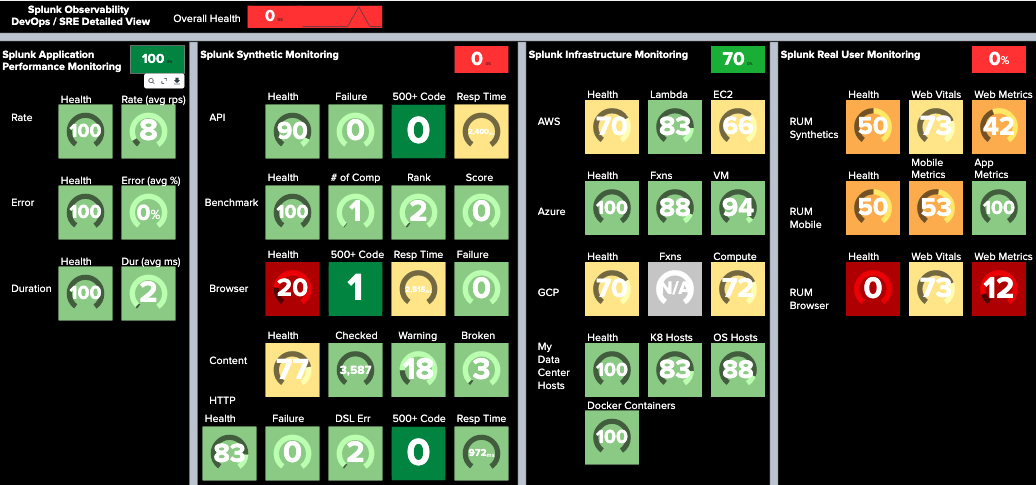
DevOps SRE Detailed View Glass Table
Here you gain insights across Splunk Synthetic Monitoring, Splunk Infrastructure Monitoring, Splunk Application Performance Monitoring, and Splunk Real User Monitoring. Insights are available not only at a summary level, but also two levels down, with single-click access to additional details for each.
Service Analyzer
The Service Analyzer is your starting point for monitoring your IT operations, enabling you to see the live health of your IT environment at a glance.
The Service Analyzer provides an overview of ITSI service health scores and KPI search results that are currently trending at the highest severity levels. You can use the Service Analyzer to quickly view the status of IT operations and to identify services and KPIs running outside expected norms. Click any tile in the Service Analyzer to drill down for further analysis and comparison of search results over time.
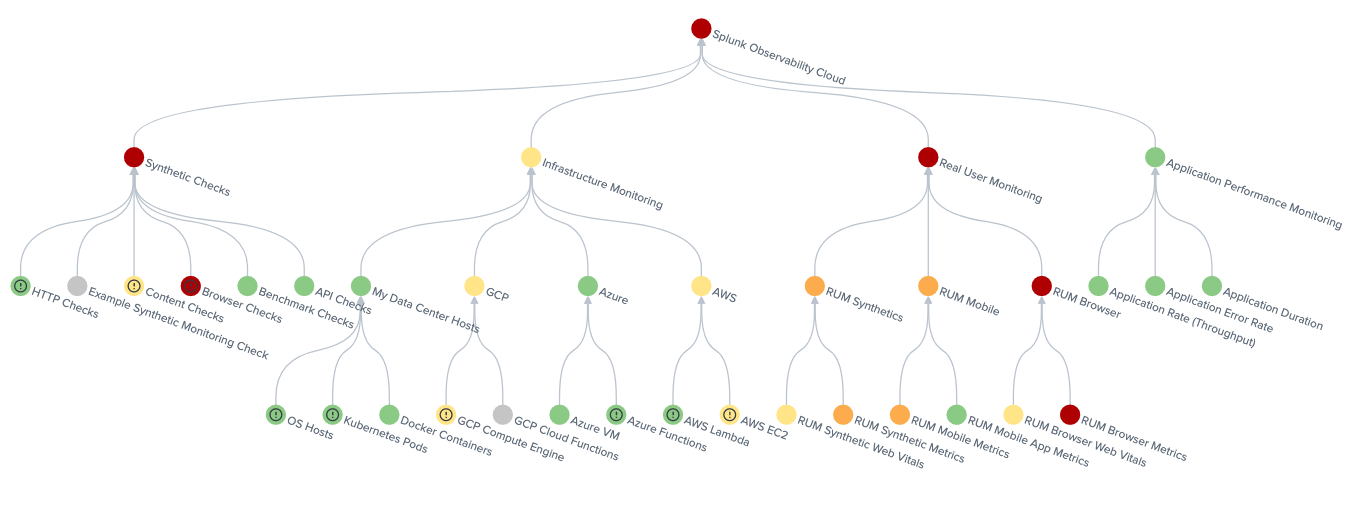
There are two Service Analyzer views: the tile view and the tree view. You can drill down to more detailed information from each view to investigate services with poor health scores.
Within this Service Analyzer you are viewing in tree view, and you can clearly see each of the four services and the status of how the underlying KPIs are reporting.
Services
A service is a logical mapping of IT objects that applies to your business goals. The definition of a service is fairly broad. You can create business and technical services that model those within your environment, with some services that might have dependencies on other services. Services contain KPIs which make it possible to monitor service health, perform root cause analysis, receive alerts, and ensure that your IT operations are in compliance with business service-level agreements (SLAs).
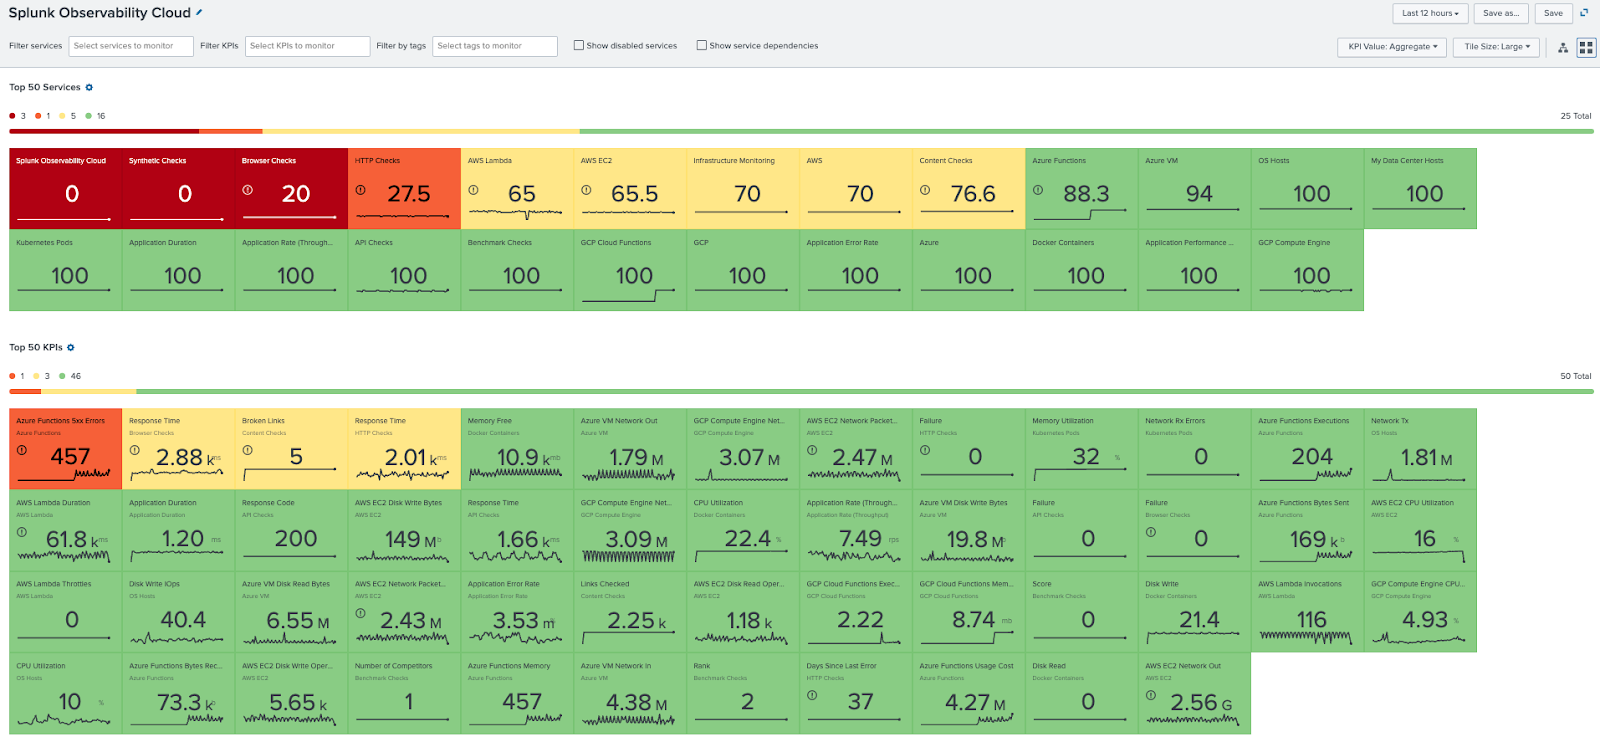
In the example below, you can see the tile view of the Service Analyzer. This provides you with insights across all 25+ services and their status for the time range selected, along with the ability to click into more results for any of these services to see the KPIs, entities, and more.
KPIs
A key performance indicator (KPI) is a recurring saved search that returns the value of an IT performance metric, for example CPU load percentage, memory used percentage, or response time. A KPI is used to monitor the health of a service.
You create KPIs within a specific service. The KPI allows you to generate searches to help you understand the underlying data, including how to access, aggregate, and qualify with thresholds. You can use the search results to monitor service health, check the status of IT components, and troubleshoot trends that might indicate an issue with your IT systems.
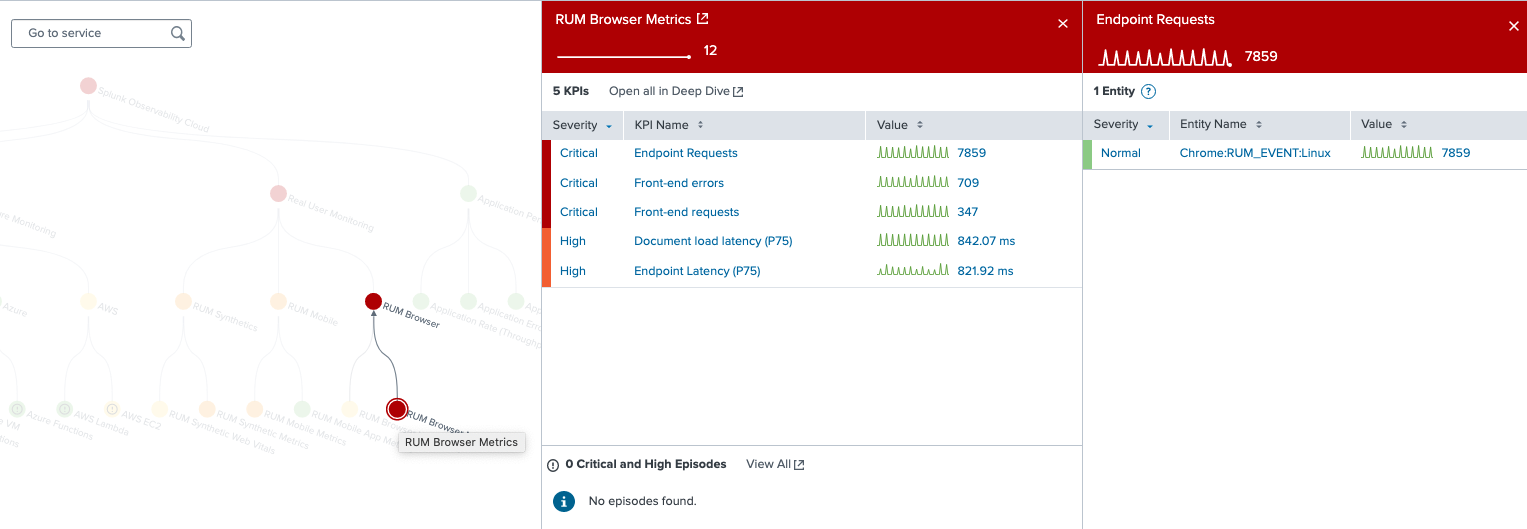
The Content Pack for Splunk Observability Cloud provides over 80+ KPIs, giving you deep insights across your observability results. The example below shows how access to the results are a single click away. You can also quickly see the underlying entities and how each is reporting.
Entity types
The Content Pack for Splunk Observability Cloud includes custom entity types. You can use associations to visualize and troubleshoot various entities. For example, the Content Pack comes with an entity type of “AWS EC2” to import your AWS EC2 services as entities. You can group entities by entity type in the Infrastructure Overview, enabling visualization of key metrics relating to the health of AWS EC2 entities (or services).
The content pack includes 15 custom entity types, one for each of the metrics from the Splunk Infrastructure Monitoring Add-on, one for Splunk APM, and one for each of the metrics from the Splunk Synthetic Monitoring Add-on.
- AWS EC2
- AWS Lambda
- Azure Functions
- Azure VM
- GCP Cloud Functions
- GCP Compute Engine
- Kubernetes Pods
- OS Hosts
- Splunk Infrastructure Monitoring
- Splunk APM
- Synthetic API
- Synthetic Benchmark
- Synthetic Content
- Synthetic HTTP
- Synthetic Real Browser

Vital metrics
Within the Content Pack for Splunk Observability Cloud, you will receive 34 vital metrics out of the box. These show a critical summary within the entity type via a set of vital metrics which describe the overall health of entities of that type, including things like: CPU Utilization, Network In, Network Out, Disk Read Ops, Disk Write Ops, and more. You can view these metrics on the Entity Health page and drill down further into individual exchange entities.

You can optionally add, modify, or delete the preconfigured entity types. For instructions to create and edit entity types, see Create custom entity types in ITSI.
Dashboards
Dashboards are used to display tables or charts in panels which hold the summarized data in a visually appealing manner. You can add multiple panels and multiple reports and charts to the same dashboard, providing easy access to valuable information in a quick and easy manner.
Within the Content Pack there are 13 different dashboards:
- SIM - Infrastructure Metrics and Logging
- Splunk APM Overview
- Splunk Infrastructure Monitoring Command Health Check
- Splunk Infrastructure Monitoring Modular Input Health Check
- Synthetic API Check Detail
- Synthetic Benchmark Check Detail
- Synthetic Content Check Detail
- Synthetic HTTP Check Detail
- Synthetic Monitoring KPI Browser
- Synthetic Monitoring KPI Comparison
- Synthetic Real Browser Check Detail
- Welcome to Splunk Synthetic Monitoring Add-on
- SIM Navigation
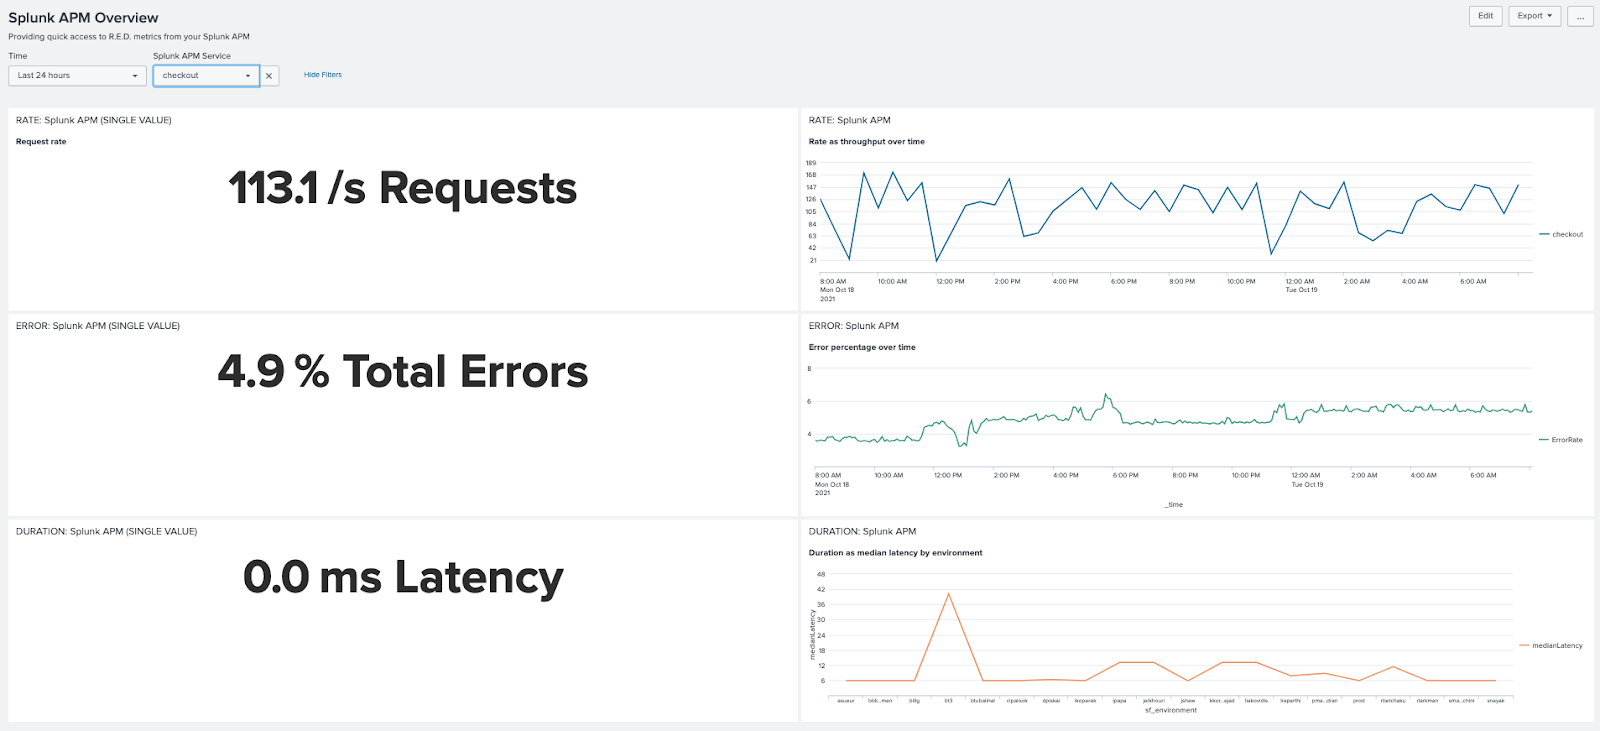
The example below shows the Splunk APM Overview dashboard, providing a RED Metrics (Rate, Error, Duration) summary. In this example, you are looking at the “checkout” service.
How to deep link into Splunk Observability Cloud from Splunk ITSI
One of the benefits of the Content Pack for Splunk Observability Cloud is the ability to deep link into Splunk Observability Cloud from Splunk ITSI. With two clicks from the Service Analyzer, here's how you can get to the specific entity you are interested in:
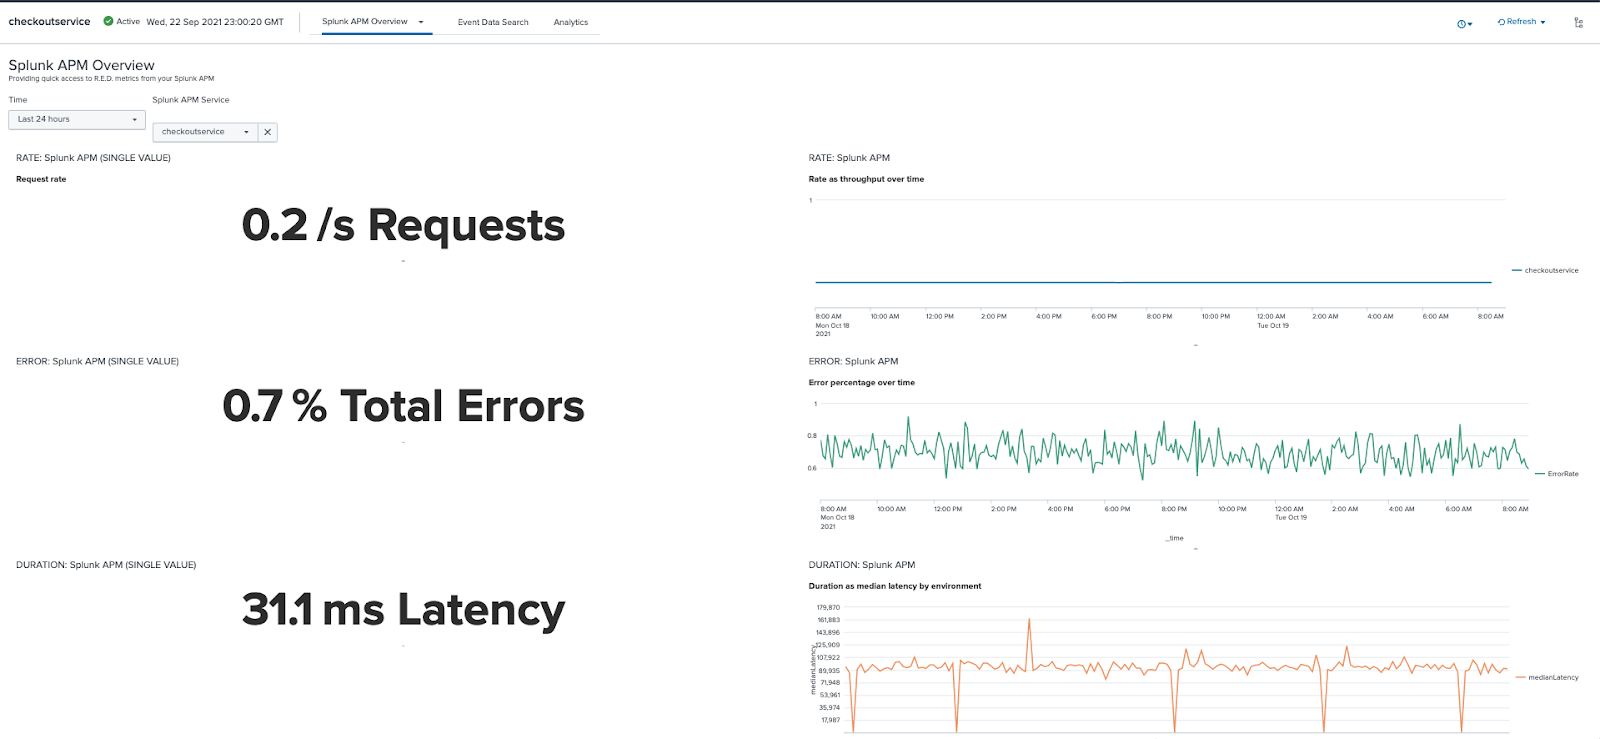
- Open the Service Analyzer. Click into the service you are interested in and examine its metrics. In the example below, we are drilling down into "checkoutservice" within Splunk Application Performance Monitoring and looking at the duration metrics.
- Click on the desired Entity to open the Entity Detail view, which shows the results for that Entity in the Splunk APM Overview.
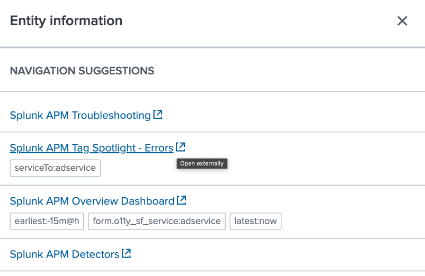
- Click the Open entity information panel icon. The additional detail appears on the right, providing context and the deep links.
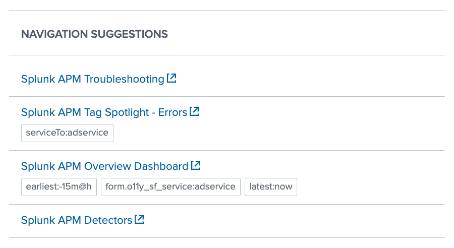
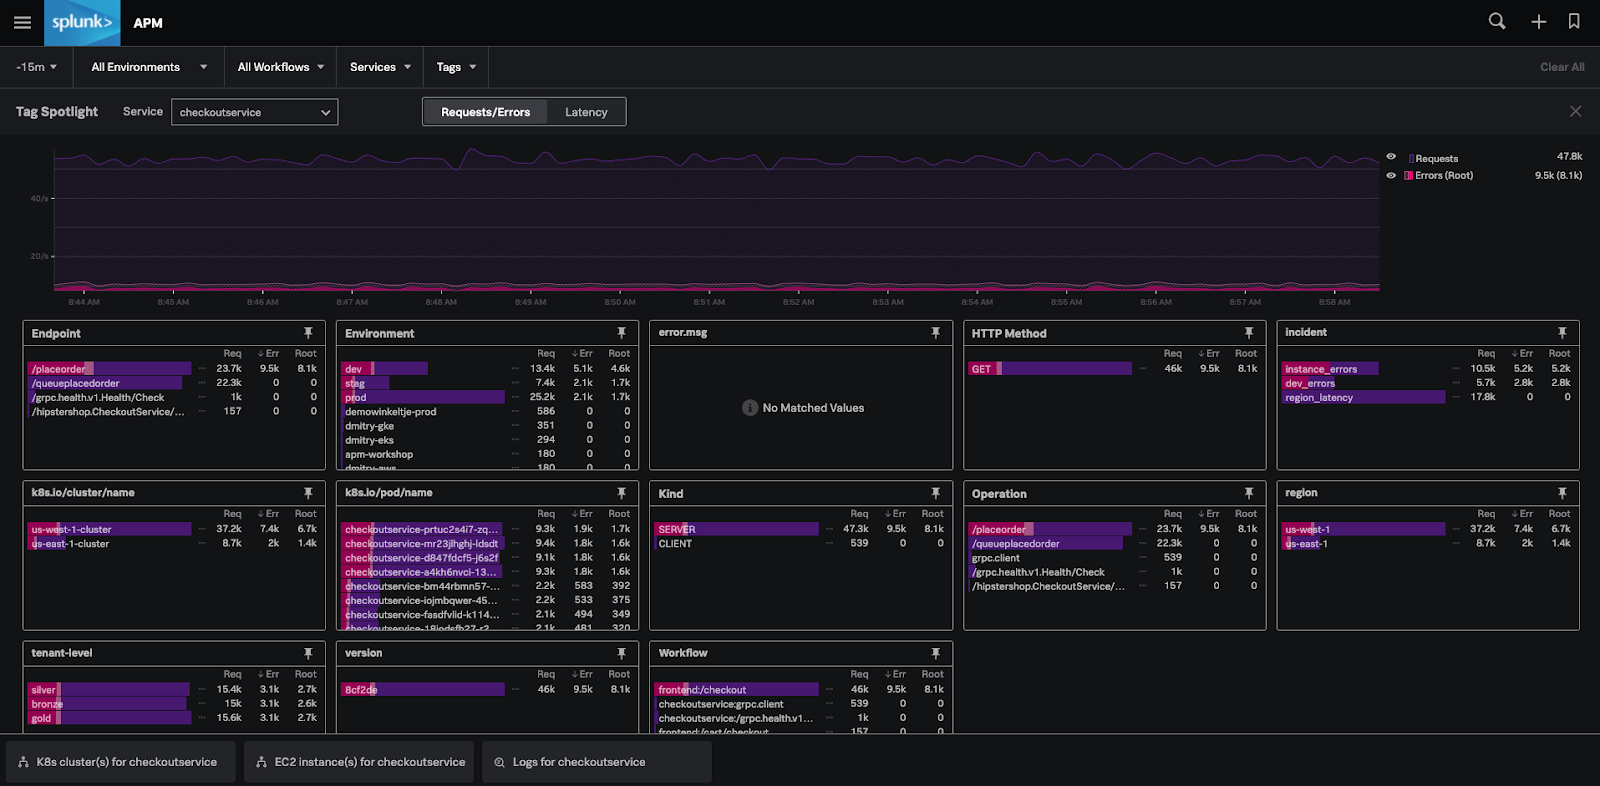
- Click the Splunk APM Tag Spotlight - Errors link under Entity Information.
- This takes you into the context in Splunk Observability Cloud, where you can view “Splunk APM Tag Spotlight - Errors” showing “checkoutservice” details.


Additional resources
These additional Splunk resources might help you understand and implement these recommendations: