Monitoring AWS Lambda functions
You are exploring opportunities to incorporate serverless architecture, specifically AWS Lambda, to drive efficiency and cost reductions. You plan to continue with your microservice Kubernetes-hosted architecture for your large-scale, customer-facing applications, but you have internal application requirements that would be a good fit to develop in the cloud using serverless AWS Lambda functions.
As part of this serverless IT modernization strategy, you have a number of questions, such as:
- How can we make sure that the Lambda functions developed and deployed are available and performing appropriately?
- How can we instrument the Lambda functions to provide APM visualizations (service maps), tagging, custom business metrics, and detector notifications similar to what we see in Splunk Application Performance Monitoring for microservice-based architectures?
Data required
How to use Splunk software for this use case
In this example, your company has started development of a library of AWS Lambda functions for human resources to share across their internal departments. The serverless AWS Lambda architecture parallels their microservices architecture, whereas the functions are decoupled and participate in cross-service-to-service application workflows.
As part of this new serverless strategy and to ensure resiliency against business disruption, your leadership team wants to make sure the AWS Lambda functions are monitored, observed, and integrated into Splunk Observability Cloud, including Splunk Application Performance Monitoring service maps and Splunk Infrastructure Monitoring dashboards for Lambda.
The diagram below shows a high-level overview of the scenario:

Reference the documentation on how to instrument AWS Lambda functions for Splunk Observability Cloud. This use case follows the documentation in the context of an example Lambda function called "CSCorp" that calls another Lambda function called "CSCorp_HR".
- Select the AWS Lambda (OpenTelemetry) integration from the Splunk Observability Cloud Data Management UI, then click Next.
- Enter the Function name, Splunk access token name, and the Environment. In this example, we're starting with "CS Corp".
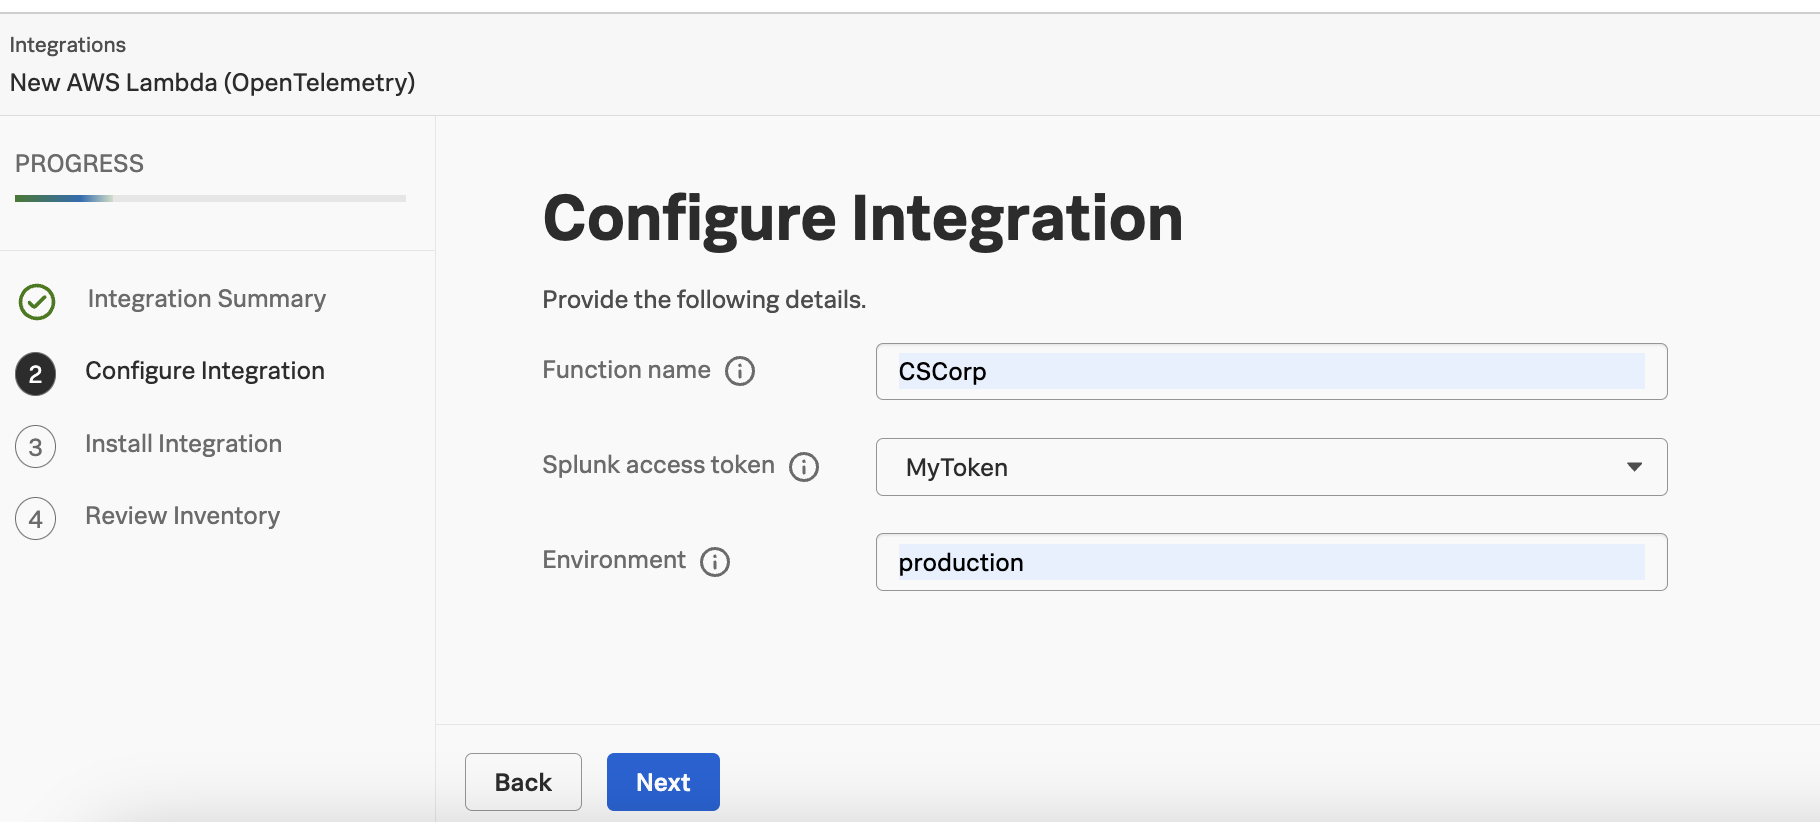
An OpenTelemetry agent deployment is not required. Instrumentation is done via assigning the function to an AWS Lambda layer specific to an AWS region.
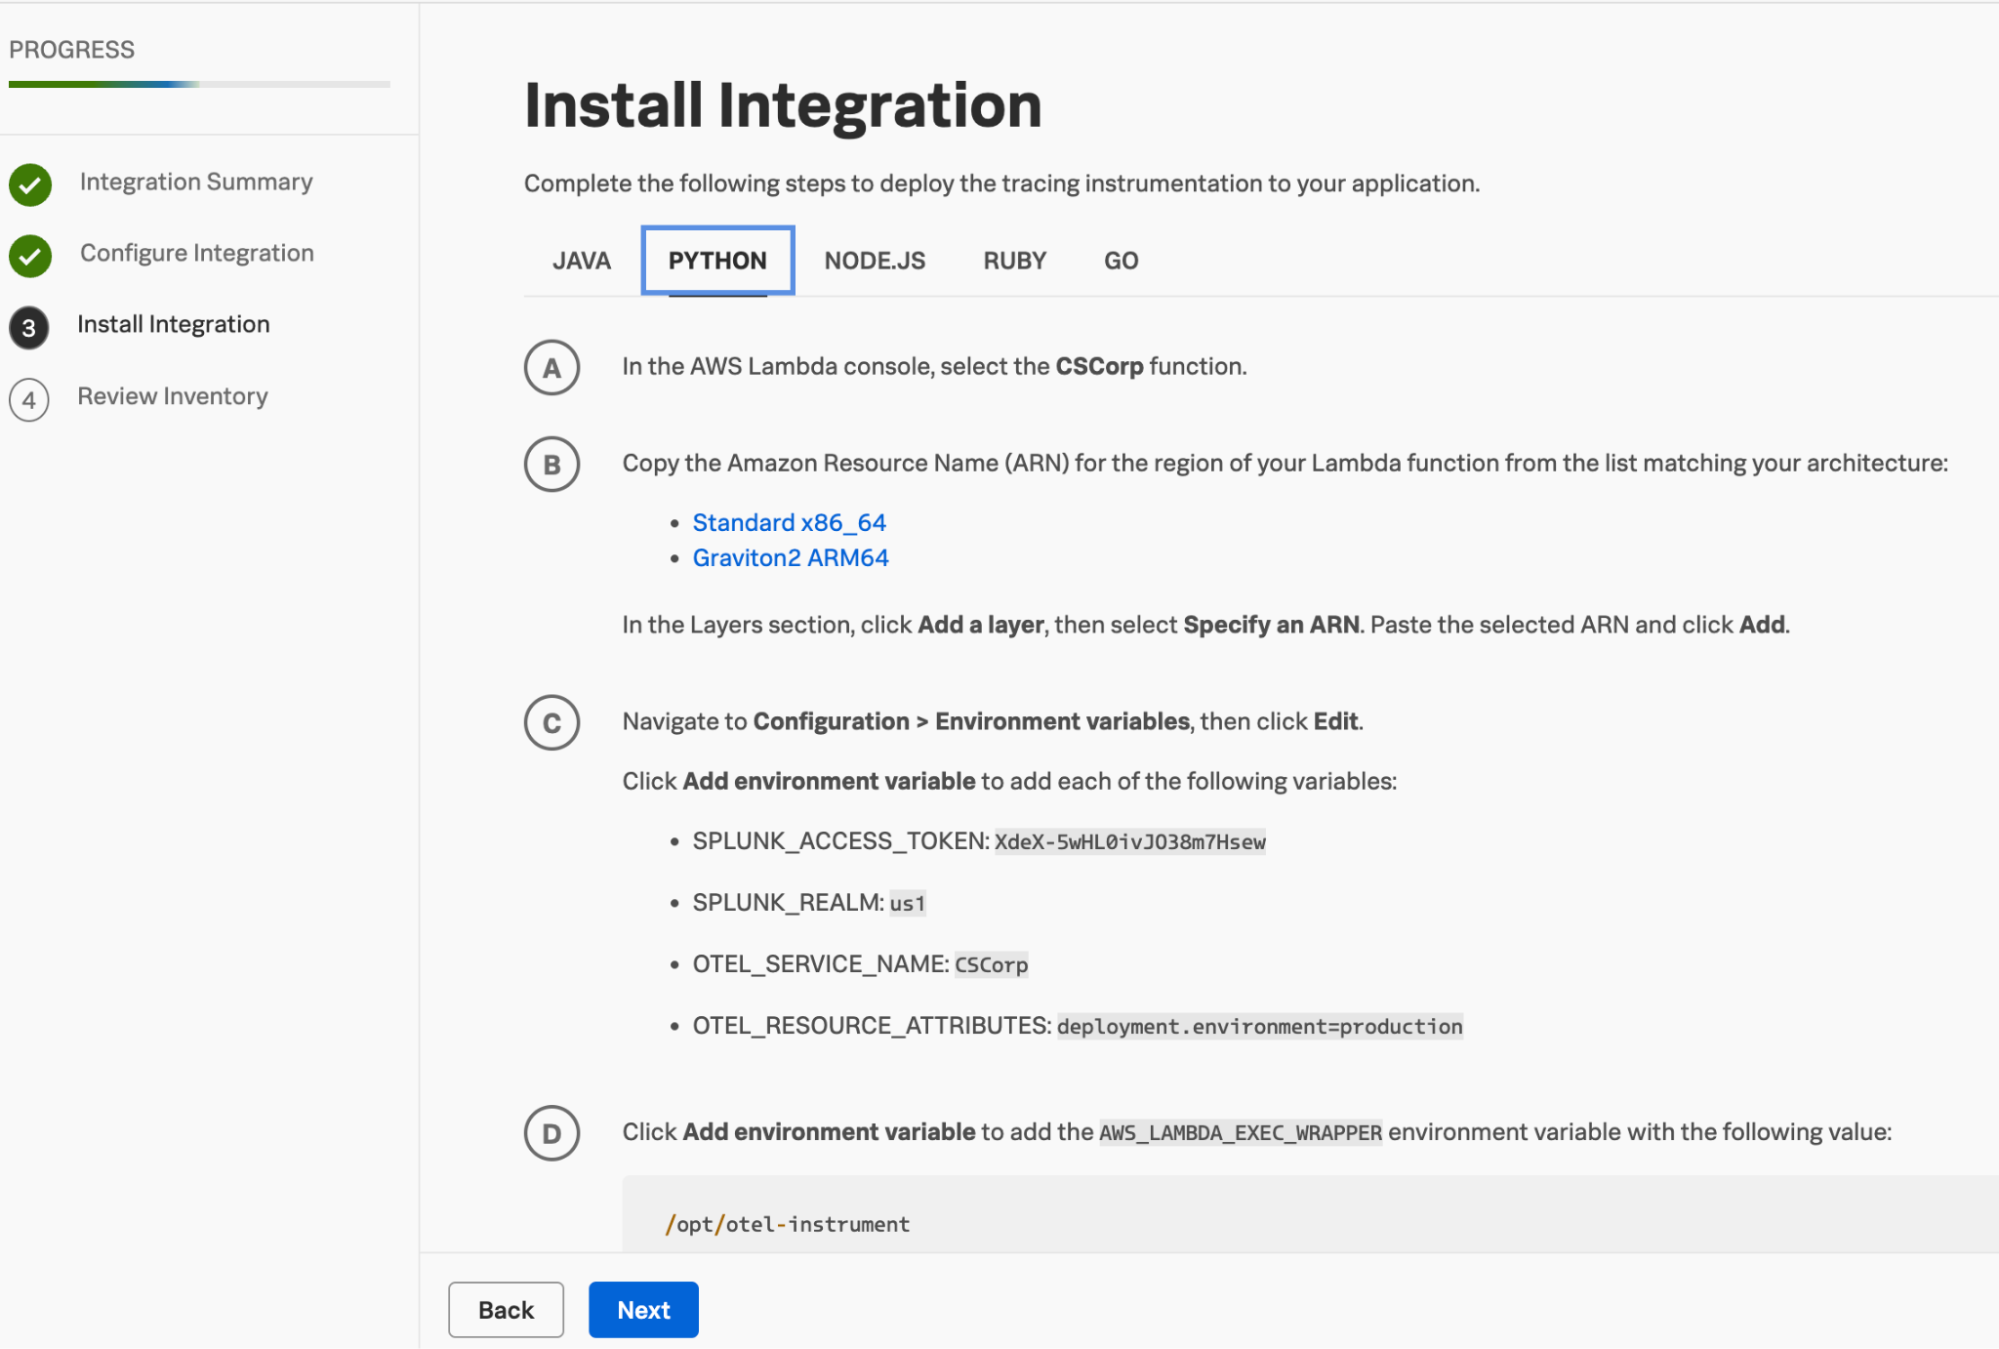
- Install the integration.
- Select an appropriate language to instrument. In this example PYTHON is used.
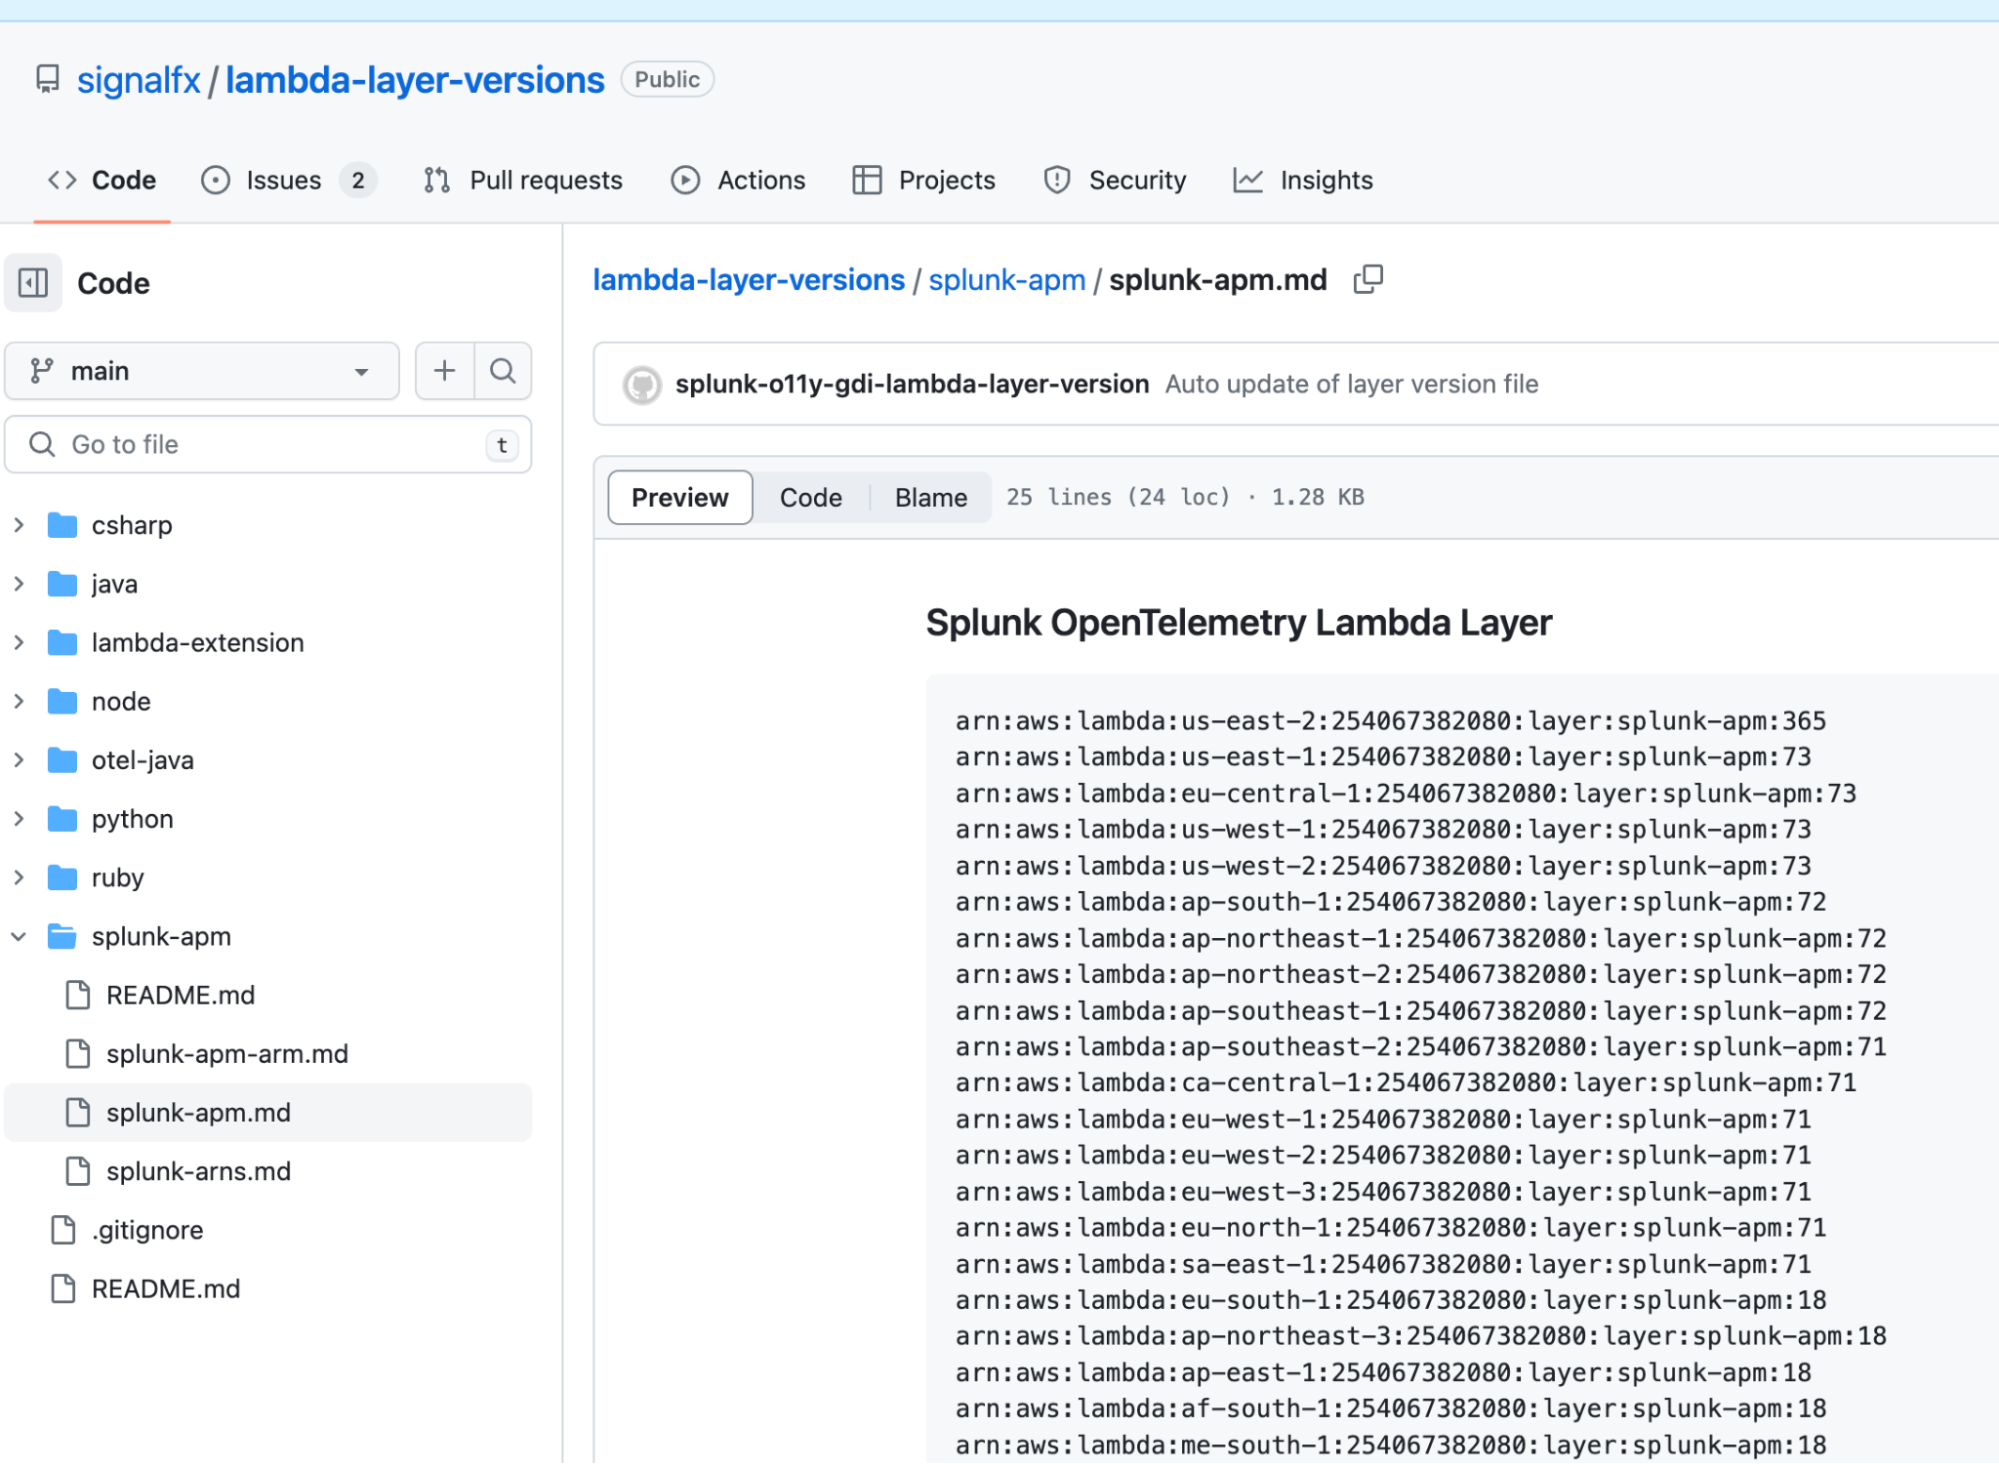
- Click the appropriate architecture link. In this example, Standard x86_64 is used. Whichever option you pick will open a new page with the ARNs listed.
- Copy the ARN based on the AWS region where the Lambda function is deployed. In this example, "us-east-2" is used.
- Open the AWS Management console, click Lambda, then Functions, then select the first function. In this example, CSCorp is selected.
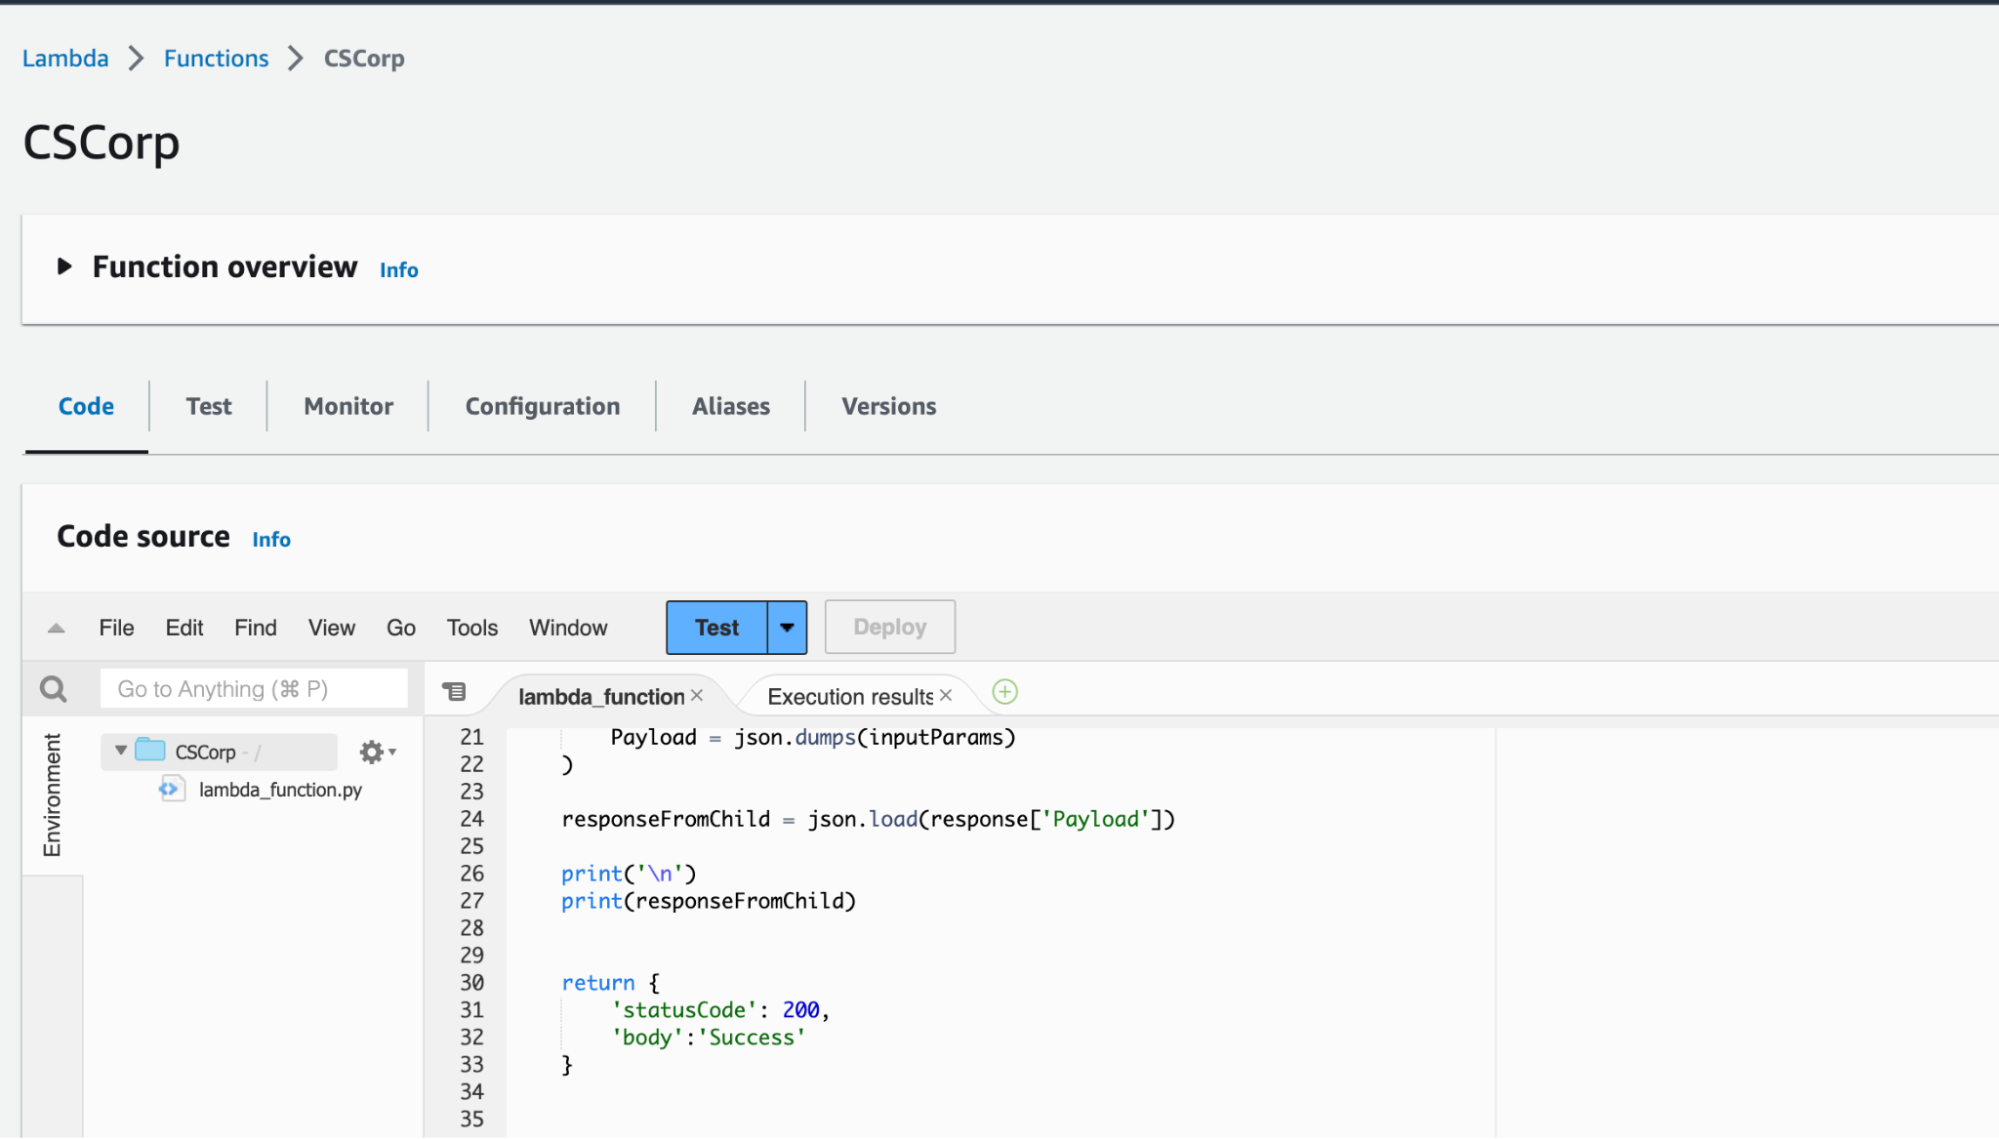
- Scroll down to the layers area and click Add a layer.
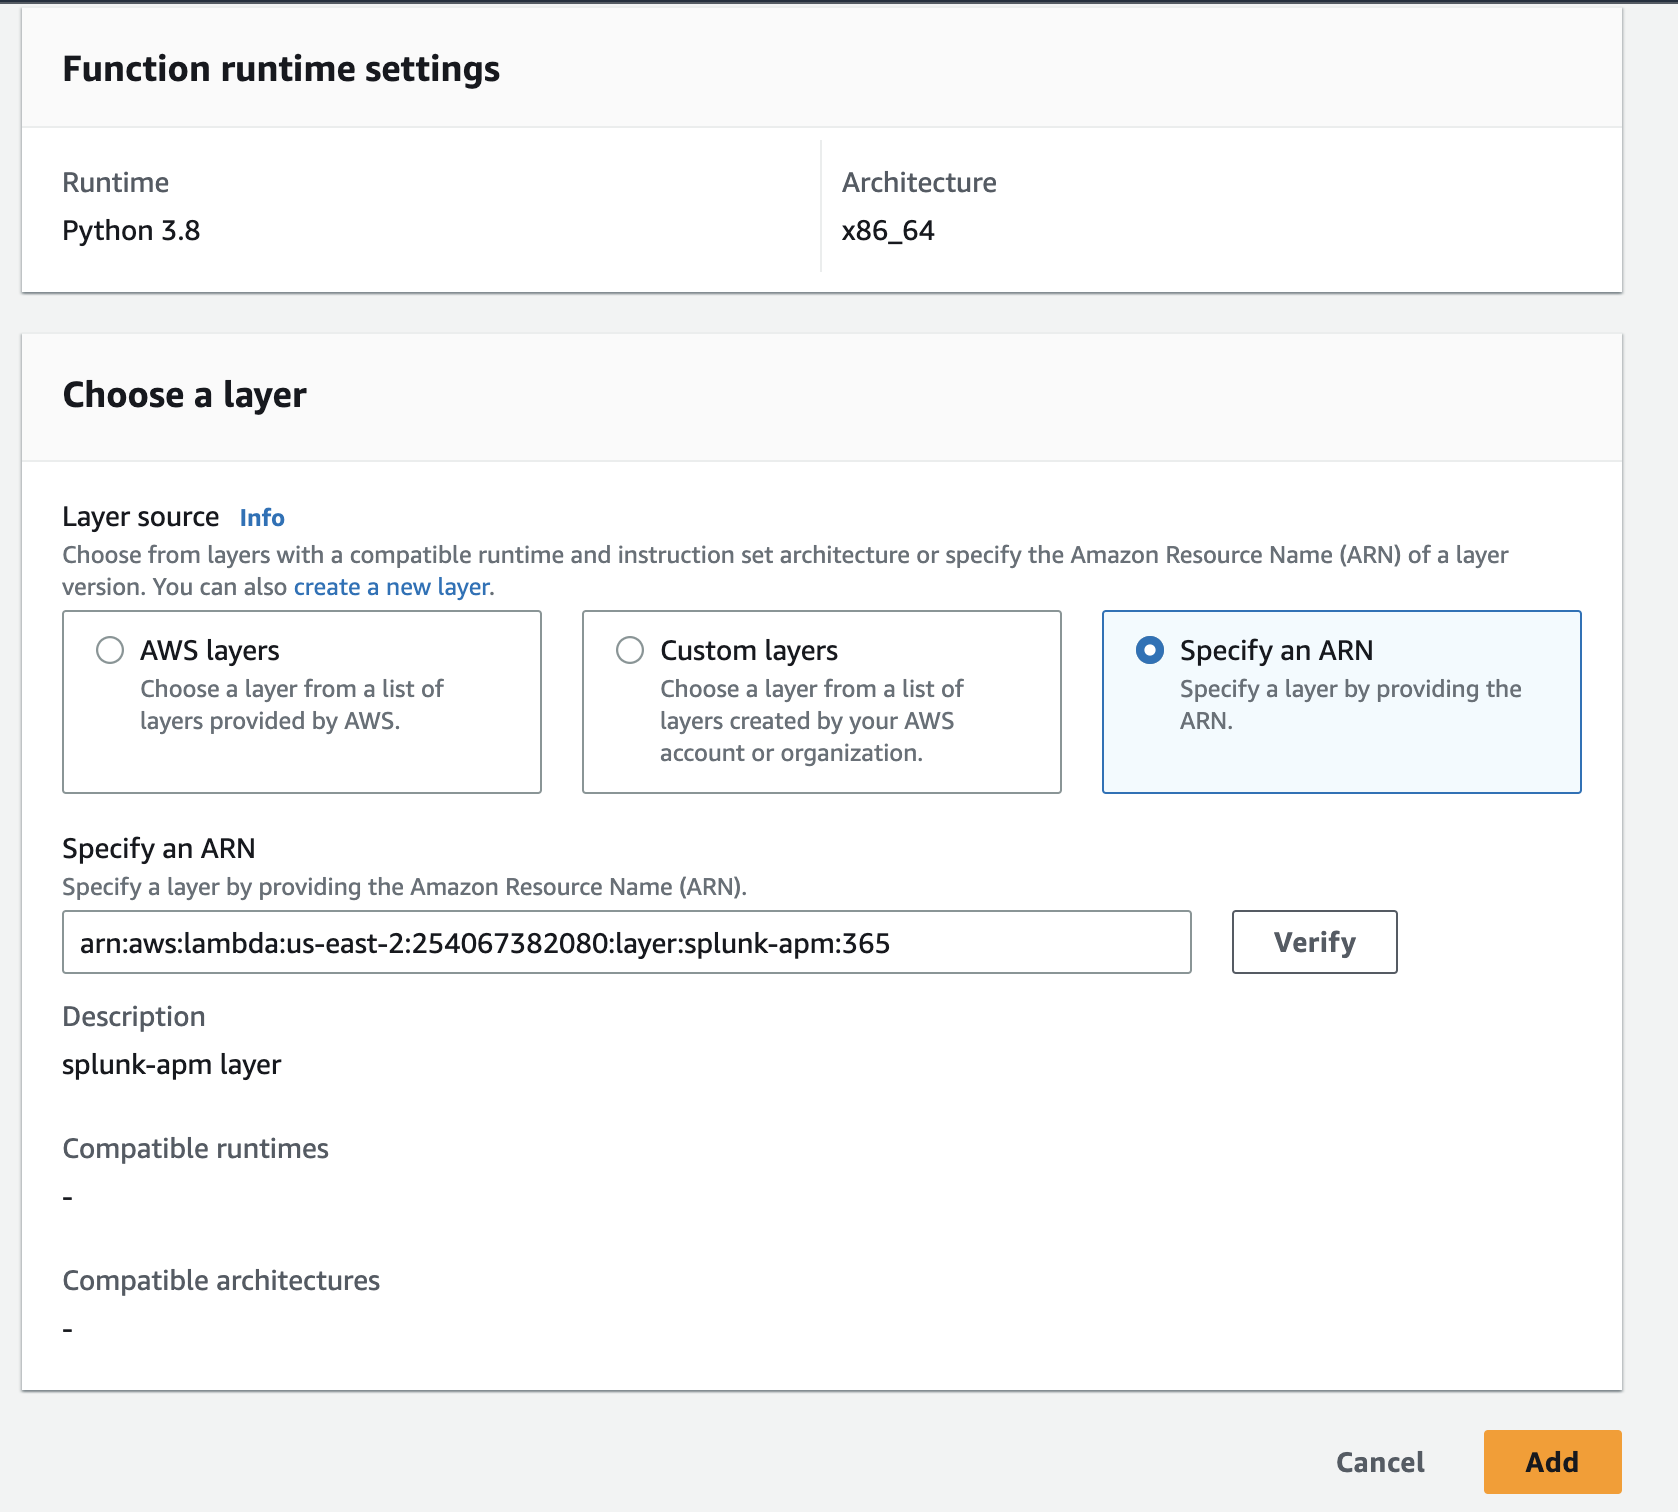
- In the Choose a layer options, click Specify an ARN. Paste the ARN for the region in the "Specify an ARN" field and click Verify. Then click Add to complete adding the layer to the function.
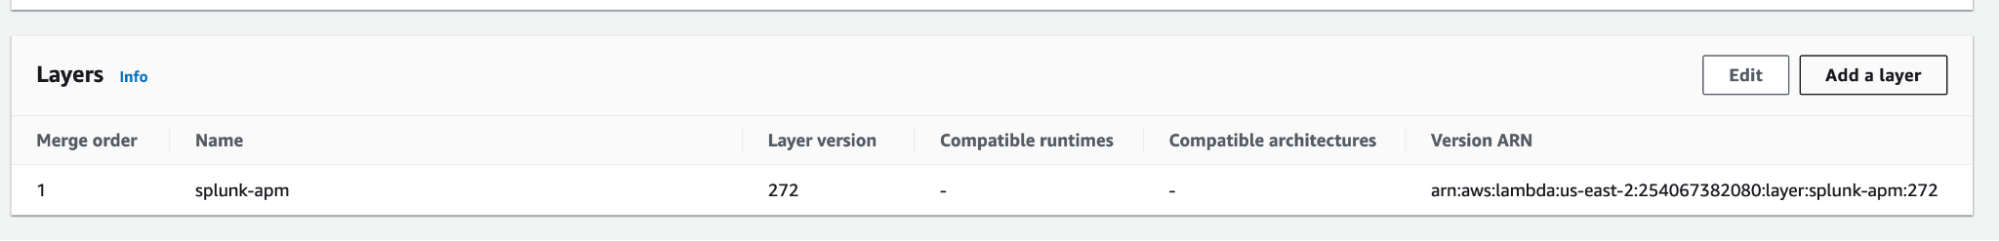
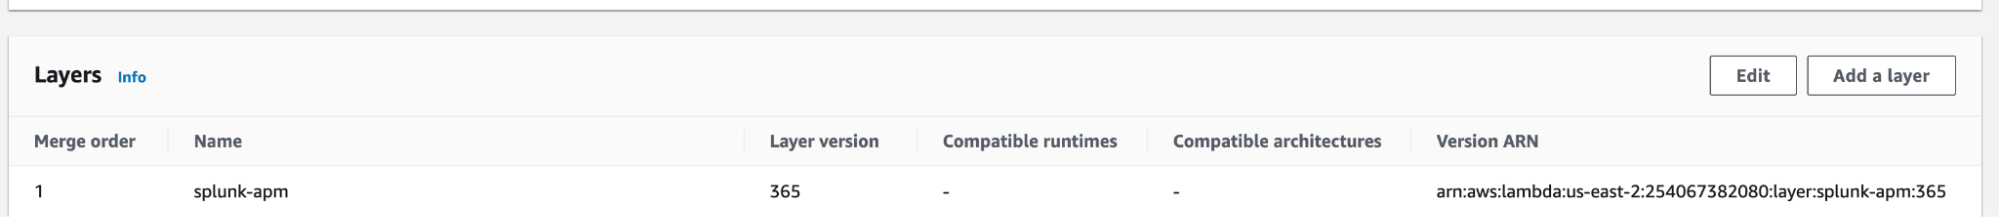
- Confirm that the layer has been applied to the function by checking that the ARN is visible under the Version ARN field.
- In the AWS Management console, configure the environment variables:
- Select the Configuration tab.
- Select Environment variables.
- Click Edit.
- Enter the values as shown in the integration wizard. Add each key and value presented.
- Add the environment variable AWS_LAMBDA_EXEC_WRAPPER as indicated in the wizard UI with a value of /opt/otel-instrument. This changes based on the language selected. Your final environment variables configuration should look like this:

- Now you'll need to exercise the Lambda function so that any new activity will be presented in the Splunk Application Performance Monitoring service map.
-
Under Lambda > Functions > CSCorp, click the Test tab to open the Test event menu.

-
Click Create New Event. Enter the function name, in this example, CSCorp_Test. Click Save, then Test. The test confirms that the function runs correctly.

-
- Go back to step 1 to instrument and configure the second Lambda function, in this example, the one called CSCorp_HR.
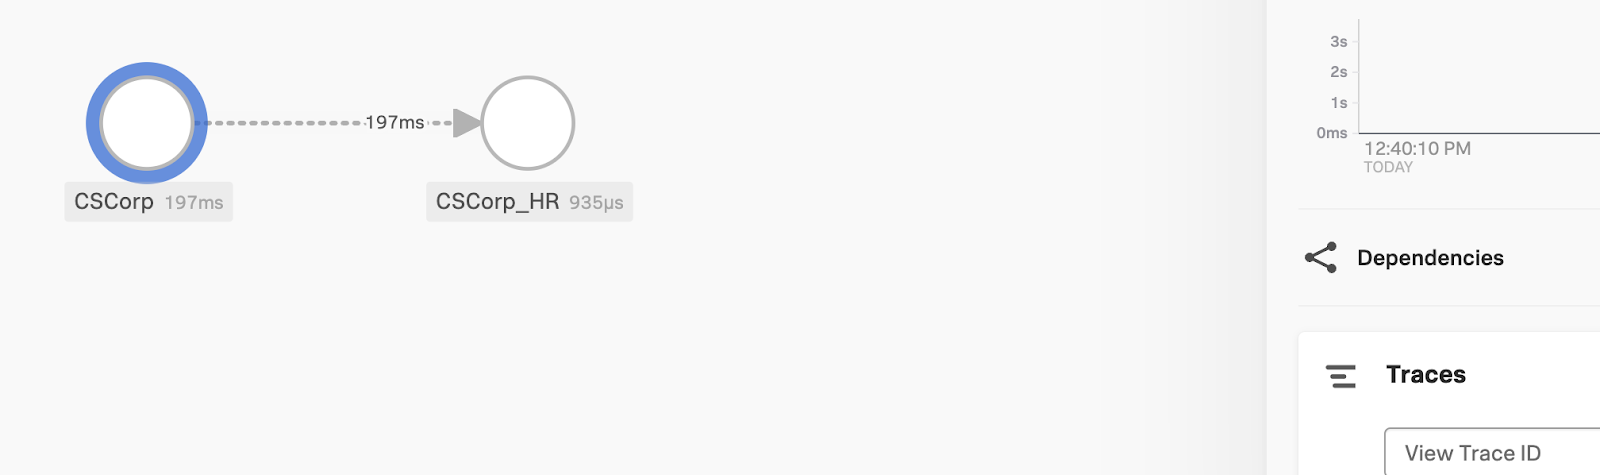
- Now you've got both functions configured, you'll need to validate the AWS Lambda (OpenTelemetry) integration and instrumentation. Start by validating that the service map in Splunk Application Performance Monitoring contains the service map representation of one function calling the other. In this example, the CSCorp function is calling the CSCorp_HR function.
.png?revision=1)
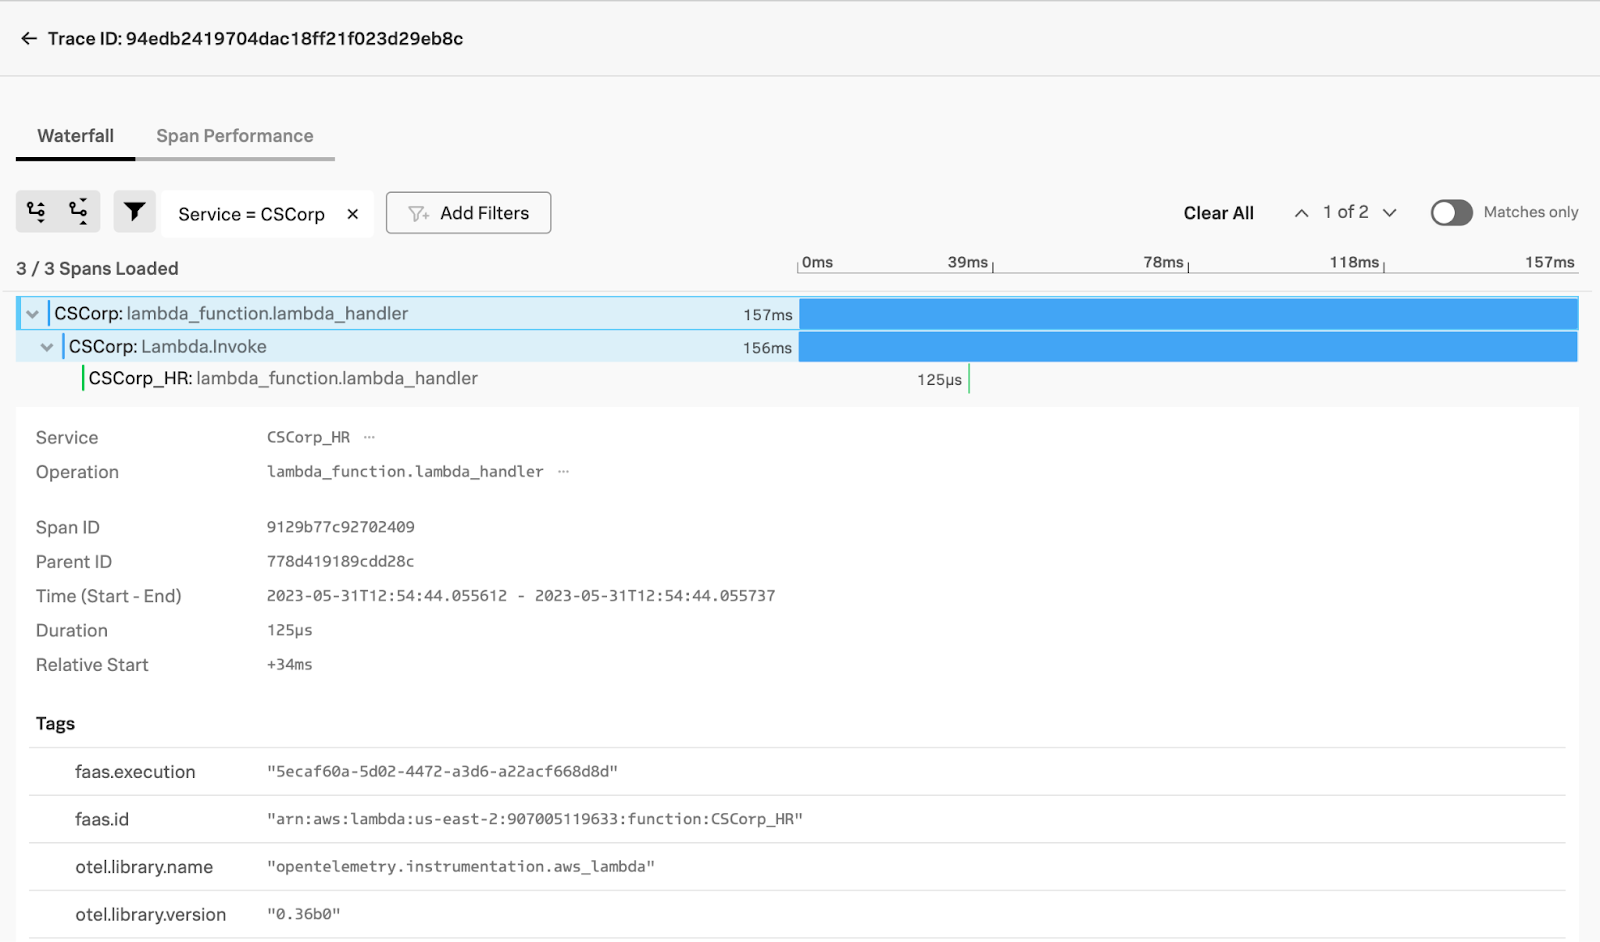
- Review the traces associated with the Lambda function calls.
- Select the CSCorp function from the service map.
- Click Traces in the right panel.
- Review the traces. This shows the spans generated making up the total trace.
You've now finished instrumenting your AWS Lambda functions so that the Splunk Application Performance Monitoring service map shows visualization and monitoring of one Lambda function being called by another Lambda function, with distinct spans making up a trace. These Lambda functions can now be visualized being called from a microservices-based application instrumented with the Splunk distribution of the OpenTelemetry Collector.
Next steps
Still having trouble? Splunk has many resources available to help get you back on track. We recommend the following:
- Splunk OnDemand Services: Credit-based services that allow direct access to Splunk technical consultants for a variety of technical services from a pre-defined catalog. Many Splunk customers already have OnDemand credits included as part of their software license. To request OnDemand Services, file a ticket through the Support Portal.
- Splunk Community: Ask your question to the Splunk Community, which has provided over 50,000 user solutions to date.
- Splunk Customer Support: Contact Splunk to discuss your environment and receive customer support.
To fully unlock the power of Splunk, we strongly recommend our comprehensive Splunk training. At this stage in your journey, we recommend you explore Splunk Observability training courses.