Troubleshooting website latency problems
You work for an ecommerce business and are responsible for your organization's website performance. You have been asked to investigate your website load times, as your exec team have noticed some delays and they suspect that high load times may be responsible for higher-than-usual cart abandonment rates.
Your organization has been moving to a cloud-based microservices environment, away from the legacy monolithic system you had previously. Any of your microservices could be loading slowly, and since you now use a combination of data centers, public clouds, and serverless functions on Azure and GCP, this web of dependencies makes pinpointing problems very complicated.
As a preliminary check, you've run a search to identify web pages that are loading slowly that has confirmed that there is some slowness occurring. Now you need to investigate more widely across all of your platforms and microservices, helping you pinpoint the cause of slow load times as they impact on the customer experience as a whole.
In this case you are concerned with load times as they impact the checkout experience, so that's what you'll focus on throughout this use case. However, if you need to investigate load times across other scenarios or if your checkout occurs across multiple API calls, you'll need some custom instrumentation to achieve this use case.
Data required
How to use Splunk software for this use case
Splunk Real User Monitoring works through a small section of JavaScript which gets added to the head of a webpage or set of pages, collecting information on performance, errors, and custom events and workflows. After the JavaScript is installed, you can go to Splunk Real User Monitoring measure end-user experience and web app performance.
The Splunk Real User Monitoring homepage breaks down a number of metrics, such as page load times, event metrics, and errors. Where unusual latency is being experienced you can see those areas highlighted in red, and hovering over each of them allows you to see a chart showing the change in the metric over time.
In this example, you can see some high load times in the first area of information on the top-left of the screen, and your checkout page is within this list with a 15-second page load time. The PlaceOrder operation, a custom event you have instrumented, has a delay of 6 seconds. You can also see a number of frontend errors and other problematic metrics that you'd like to investigate.
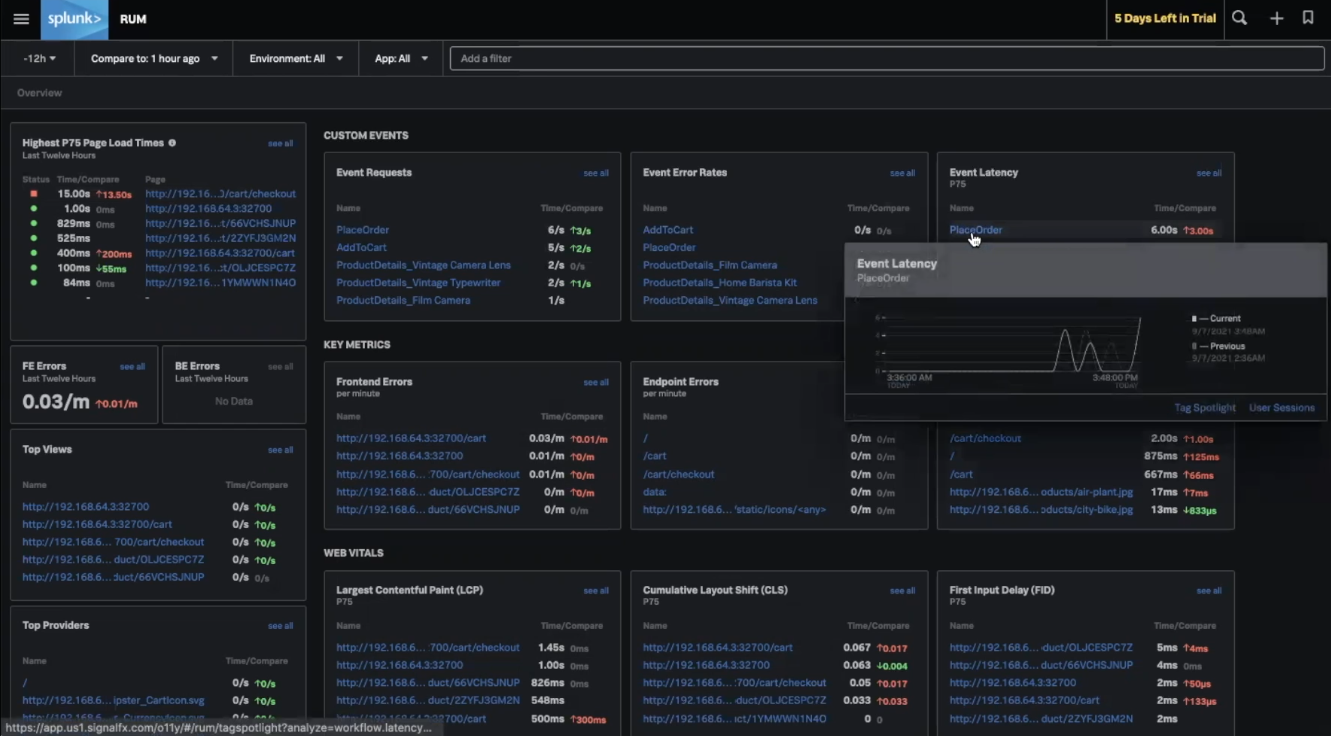
Clicking into the PlaceOrder operation, you can see a number of correlations in this event - in other words, what kinds of user are experiencing high latency. You're interested to know whether these users are all using a certain browser, device, geography, or operating system, for example, and you can see the breakdown of these correlations in this area.
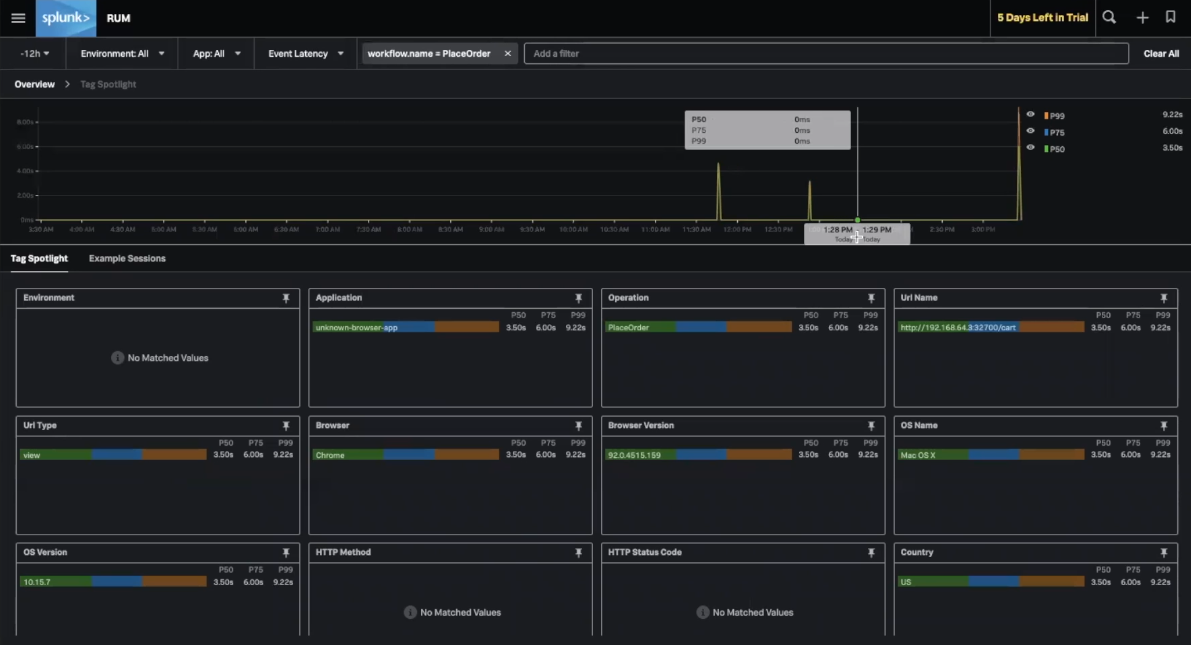
You can see a spike in events in the chart area shown at the top of the page. You can click to select this peak, click Example Sessions to view some session, and click into the detail of a session to access a waterfall view of these events. These steps take you to an end-to-end view into all events that are happening, from the browser through to the backend. You can see events such as document loads and resource fetches for any static resources, as well as events like console errors, any fetch requests and custom events you have instrumented.
.gif?revision=1)
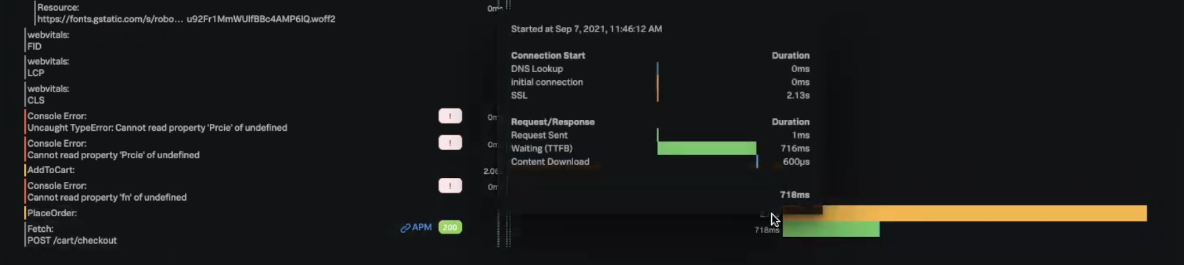
In this example, you can clearly see that the PlaceOrder event is experiencing latency and a large portion of this is the /cart/checkout event. This shows you straight away that checkout is running slowly as there is a problem with the fetch request on /cart/checkout.
You can also see that most of these events are tagged with an APM hyperlink, allowing you to go straight to Splunk Application Performance Monitoring to see more. Any event from the browser's perspective generates some activity on the back end. Because Splunk Real User Monitoring captures all the data, not just from the front end but also from the back end, at full fidelity any transaction can be tied together end-to-end so you can see the corresponding back end trace for any front end activity generated.
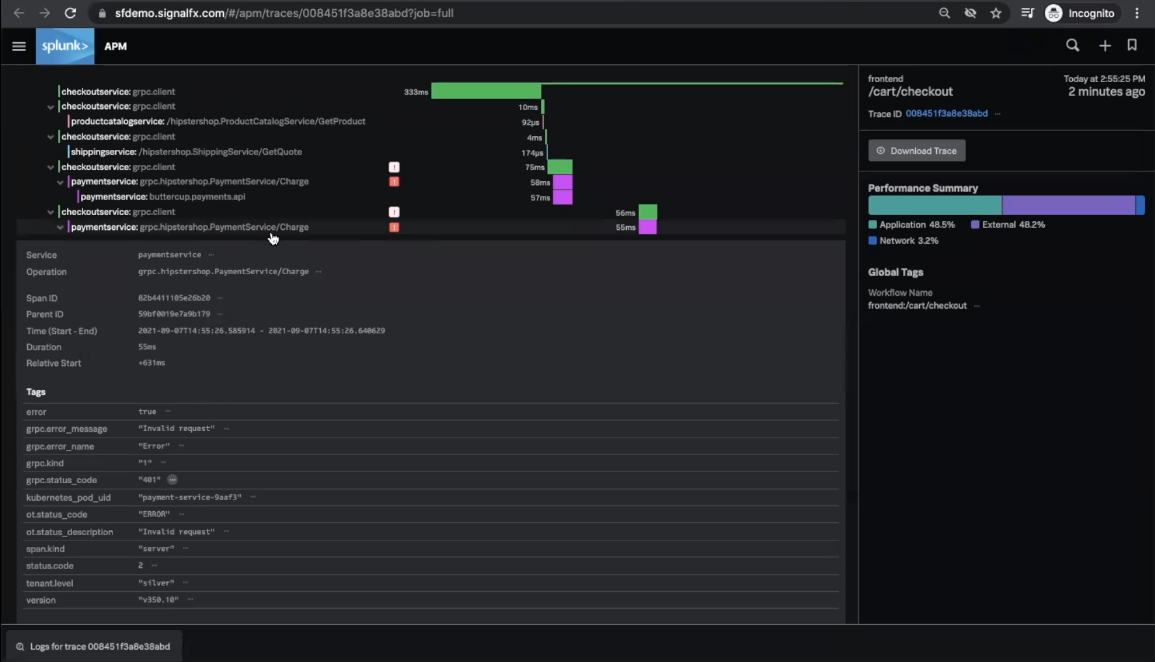
Clicking the APM link takes you to the service map. You can see that paymentservice is experiencing some latency.
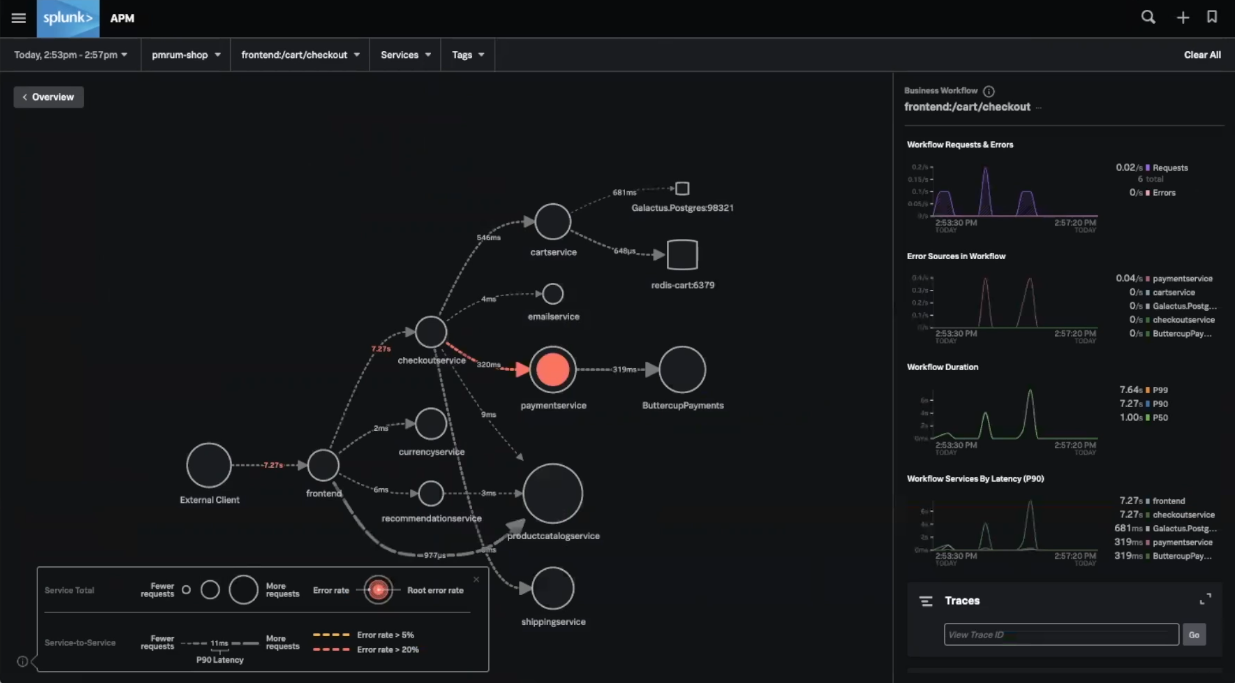
Using APM, you can also click the trace ID to view the exact back end trace generated. In this example, it looks like the paymentservice is calling a third party API, buttercup.payments.api, calling it twice then timing out. Clicking into the span, you can see a 401 error code listed here, which is likely the cause of the problem.
Next steps
The content in this guide comes from a .conf21 session, one of the thousands of Splunk resources available to help users succeed. In addition, these Splunk resources might help you understand and implement this use case:
- Splunk Docs: Introduction to Splunk RUM
- Blog: Introducing Splunk Real User Monitoring (RUM)
- Use Case: Identifying slowly loading web pages