Troubleshooting checkout latency issues
You are a site reliability engineer working in a cloud-native environment that runs several microservices to support an online store. Your customer support team has received a number of complaints from customers who are experiencing checkout delays, so you need to troubleshoot and fix the issue.
Data required
How to use Splunk software for this use case
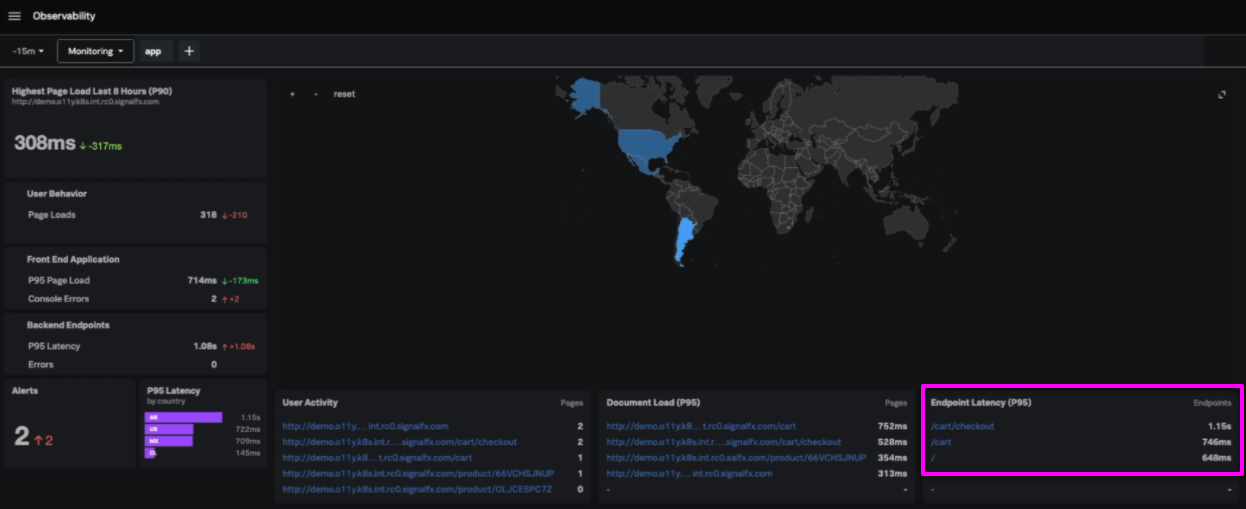
- Open Splunk Observability Cloud, navigate to the main menu, and click Splunk Real User Monitoring.
- The Splunk Real User Monitoring home screen shows you data covering load times, activity, and front end errors. Scan through this information and look for problems. In this example, you can see that the
/cart/checkoutnode latency is high. Click it to investigate further.
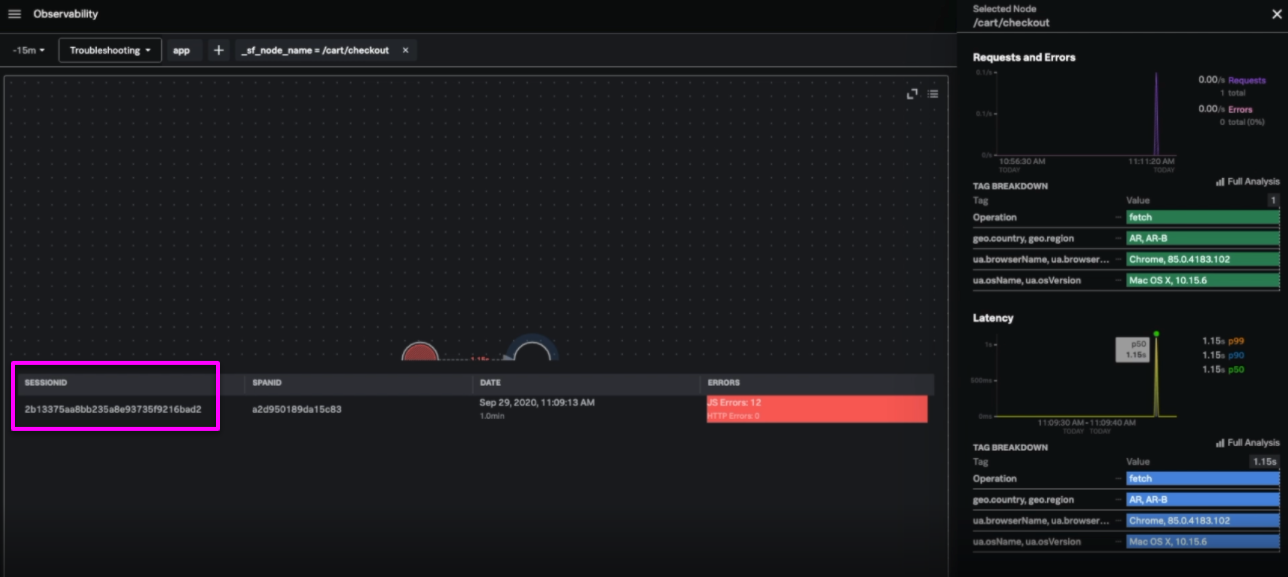
- Looking at the
/cart/checkoutnode, you can see there has been a latency jump. To look more closely, click SESSIONID.
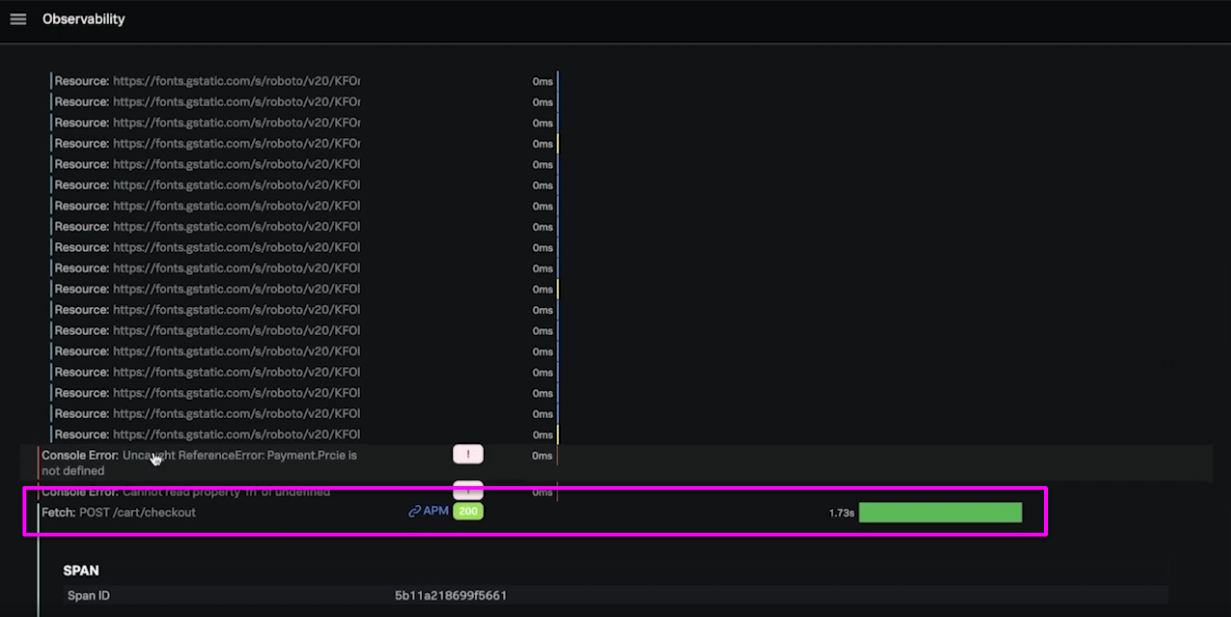
- From the trace view, you can identify requests with latency issues. In this instance, you can see a 1.73 second delay. To access more information in Splunk Application Performance Monitoring, click APM in the center row of this area.
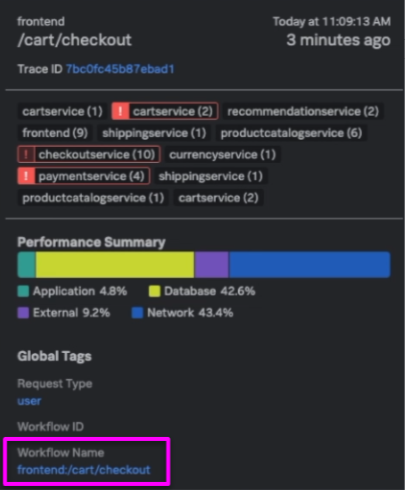
- Here, you can see the backend view of the trace. In this example you can see some errors in
cartservice,checkoutservice, andpaymentservice. At the bottom of this backend view, click thefrontend/cart/checkoutlink under Workflow Name to access the service map.
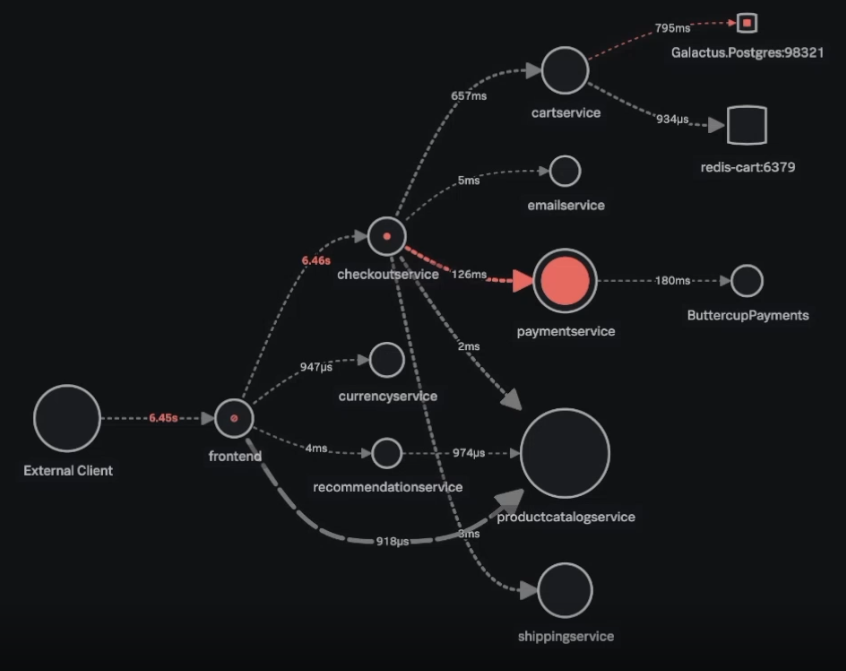
- Looking at the service map, check for long response times. In this example, you can see latency issues running from the external client, through the
frontendandcheckoutservice, flowing through to thepaymentservice. It's not immediately obvious that this problem is caused by errors stemming from thepaymentservice, so you'll need to investigate further.
- Click on
paymentserviceand click on one of the errors in the Request Rate area to get some example traces. Click the Trace ID for one of the traces to see more.
.gif?revision=1&size=bestfit&width=849&height=437)
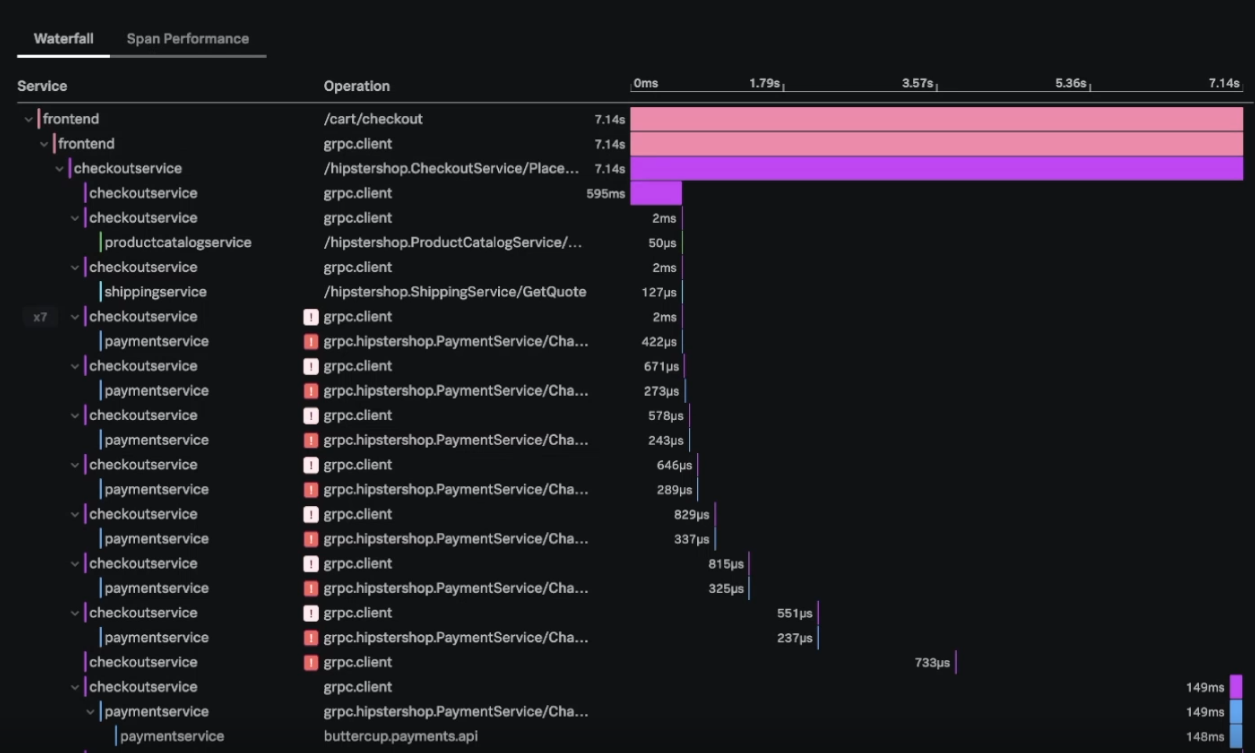
- The waterfall view of this trace shows several errors. In this example it looks like
checkoutserviceis doing an exponential backoff, which results in the high latency bars you can see at the top of this area.
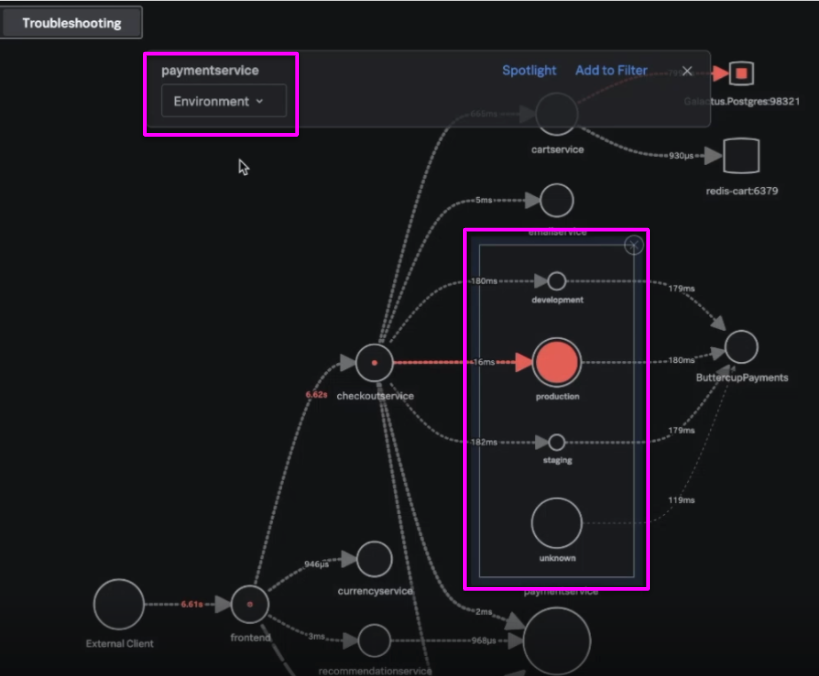
- At this stage, you might want to double-check what environment, or environments, the errors are originating in. In the drop-down box under
paymentservice, click Environment. This shows you the breakdown of errors in the environments you are running.
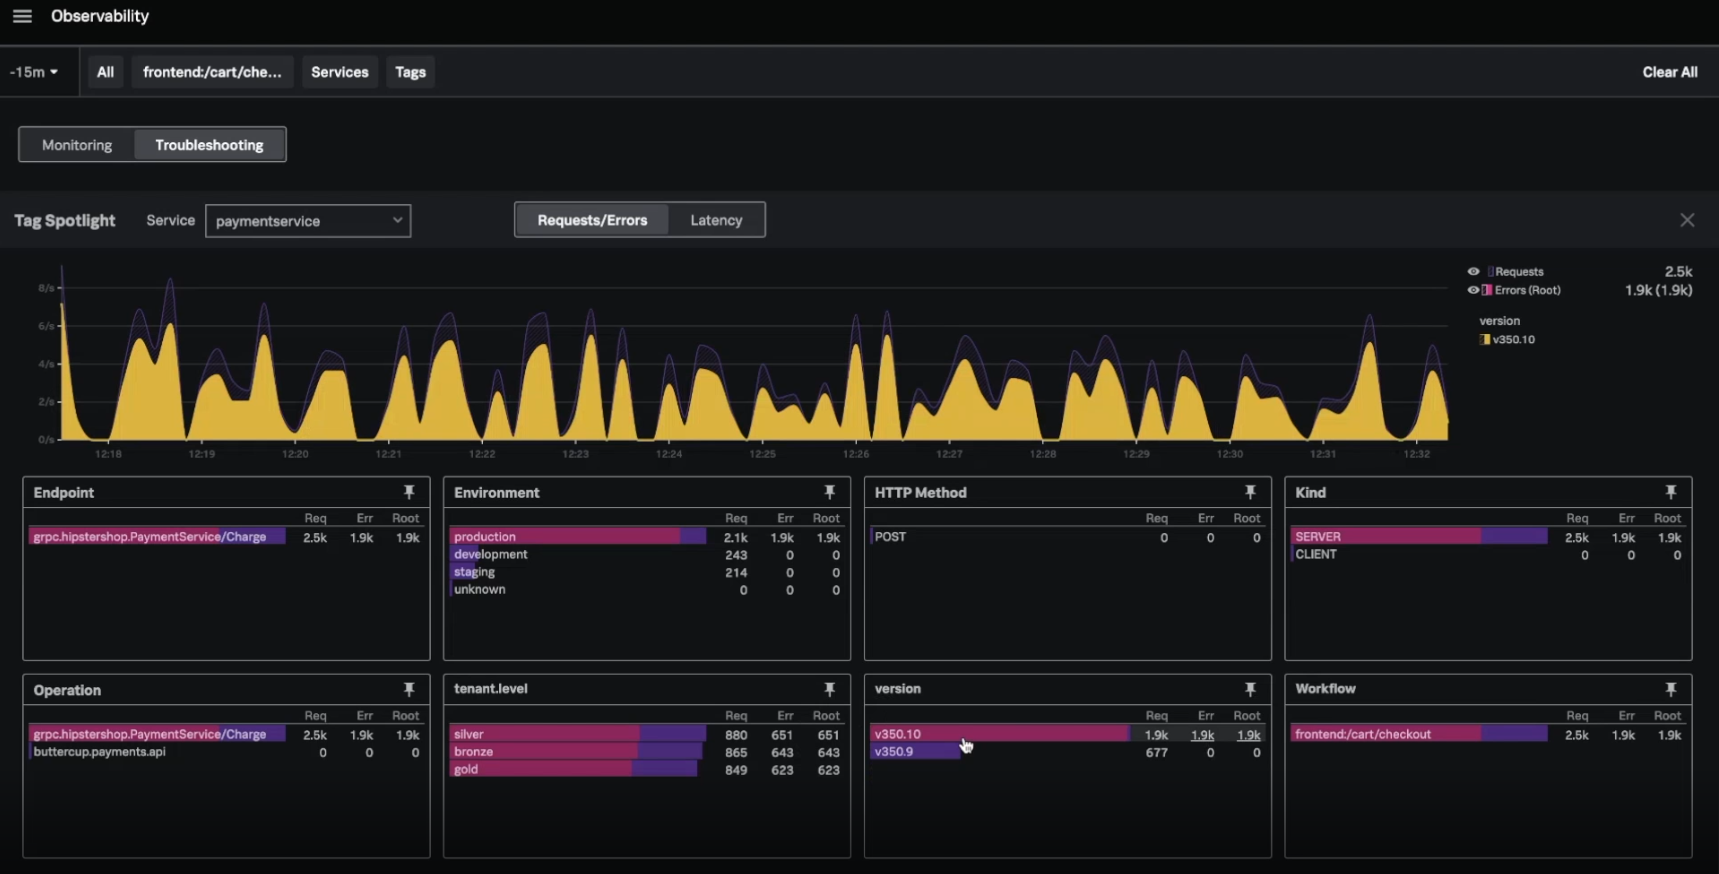
- Next to the drop-down field you just changed to access Tag Spotlight, click Spotlight. Tag Spotlight shows you all the tags coming in for these spans so you can look for problems within these tags. In this example, you can see that version 350.10 is correlated with all the errors that are happening, indicating that this deployment might need to be rolled back.
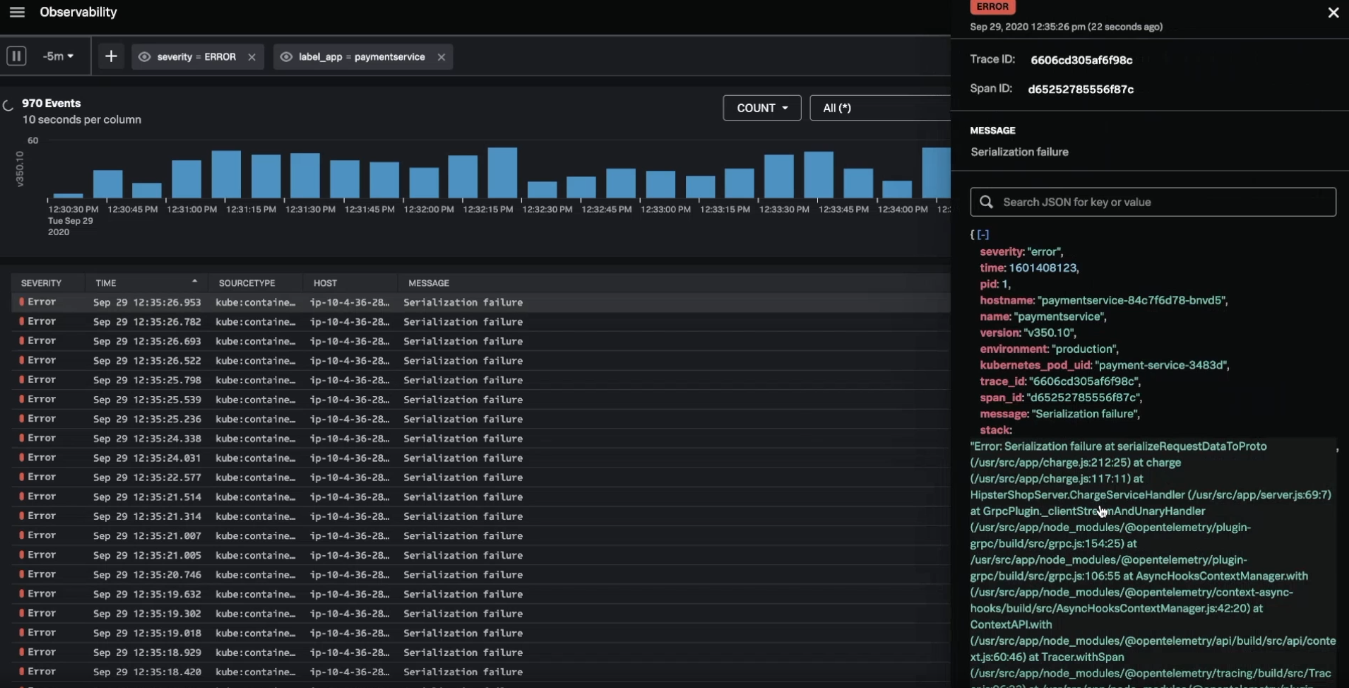
- Open Splunk Log Observer and click the + in the top toolbar. Click Fields, find
label_appin this area, and clickpaymentservice. Then, filter for error logs in the bar chart. In this example you can see multiple serialization failures occurring.
.gif?revision=1)
- To be completely sure that the new deployment is causing these errors, click Visual Analysis at the top of the screen and sort by version. Here you can see that version 350.10 is causing these serialization failures.
.gif?revision=1)
- (Optional) Click one of the serialization failure events to copy the stacktrace and send it to your team so you can later merge a fix for the issue.
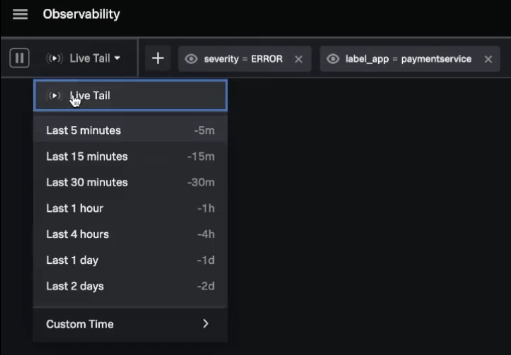
- After you've rolled back the deployment, you can use Splunk Observability Cloud to double-check that the errors have stopped. Using the time picker at the top-left of the screen, click Live Tail. This mode allows you to see any errors that arise in real-time. As the deployment rolls out, you should see these errors stop, meaning that the issue is mitigated.
Next steps
Latency and errors in eCommerce environments can result in customers abandoning their planned purchases, with financial impact to your organization. Quickly identifying and fixing these issues results in fewer dollars lost and fewer frustrated customers.
The content in this guide comes from a .conf2020 talk, Logging for Observability, one of the thousands of Splunk resources available to help users succeed. In addition, these Splunk resources might help you understand and implement this use case: