Review pod status in the Kubernetes navigator
You are a Kubernetes administrator for a large organization. You need to continuously monitor few different stats relating to your Kubernetes pods - the number of running pods versus the number you are expecting to be running, and pods in a pending status as well as pods that are failed. You need to be able to access these pod statuses in a single place so you can quickly and easily troubleshoot, reducing your mean-time-to-resolution (MTTR).
How to use Splunk software for this use case
- In Splunk Observability Cloud, click Infrastructure in the left navigation pane.
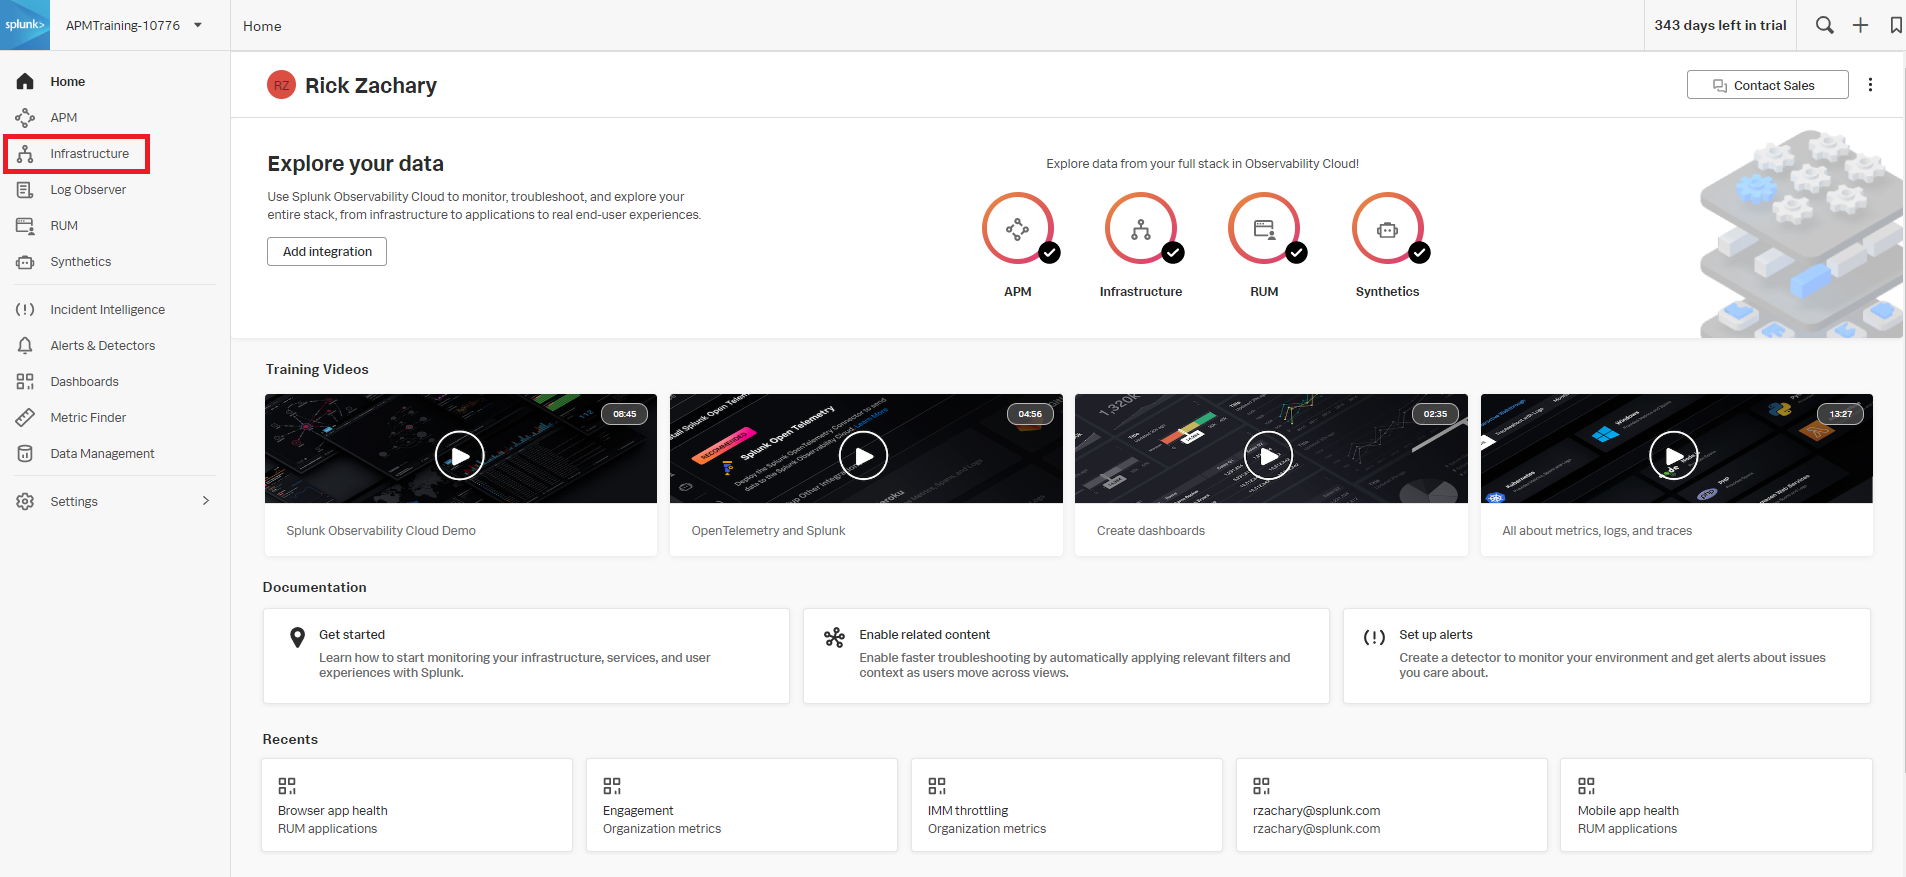
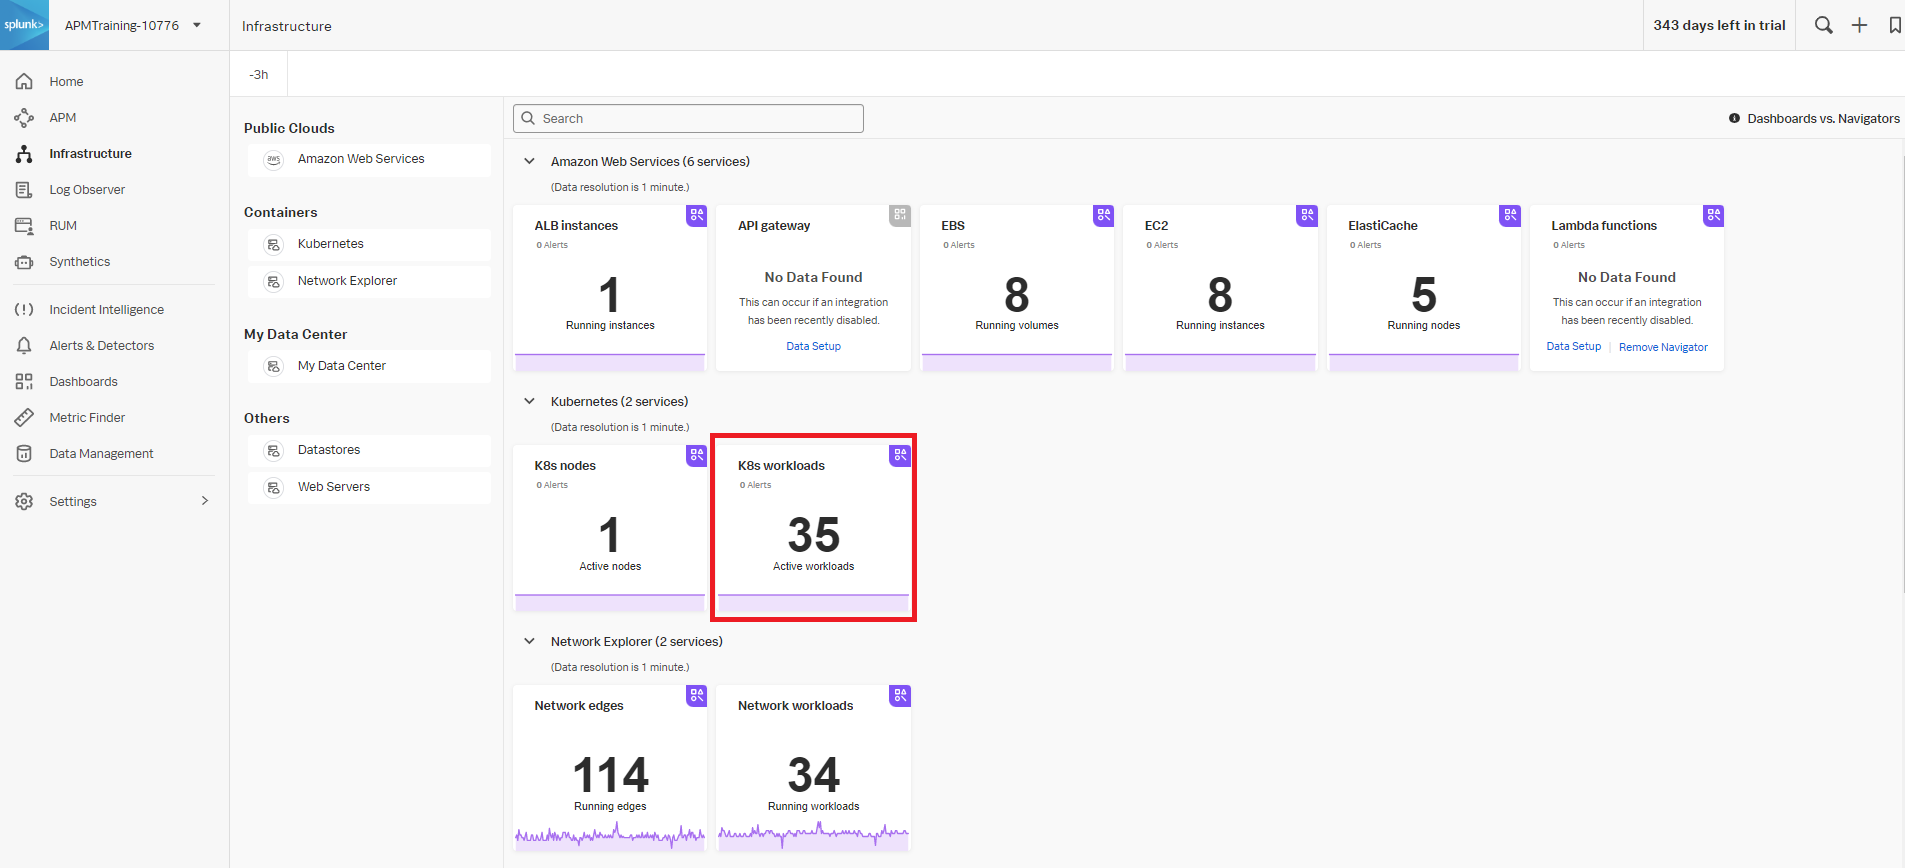
- In the Kubernetes section, click K8s workloads.
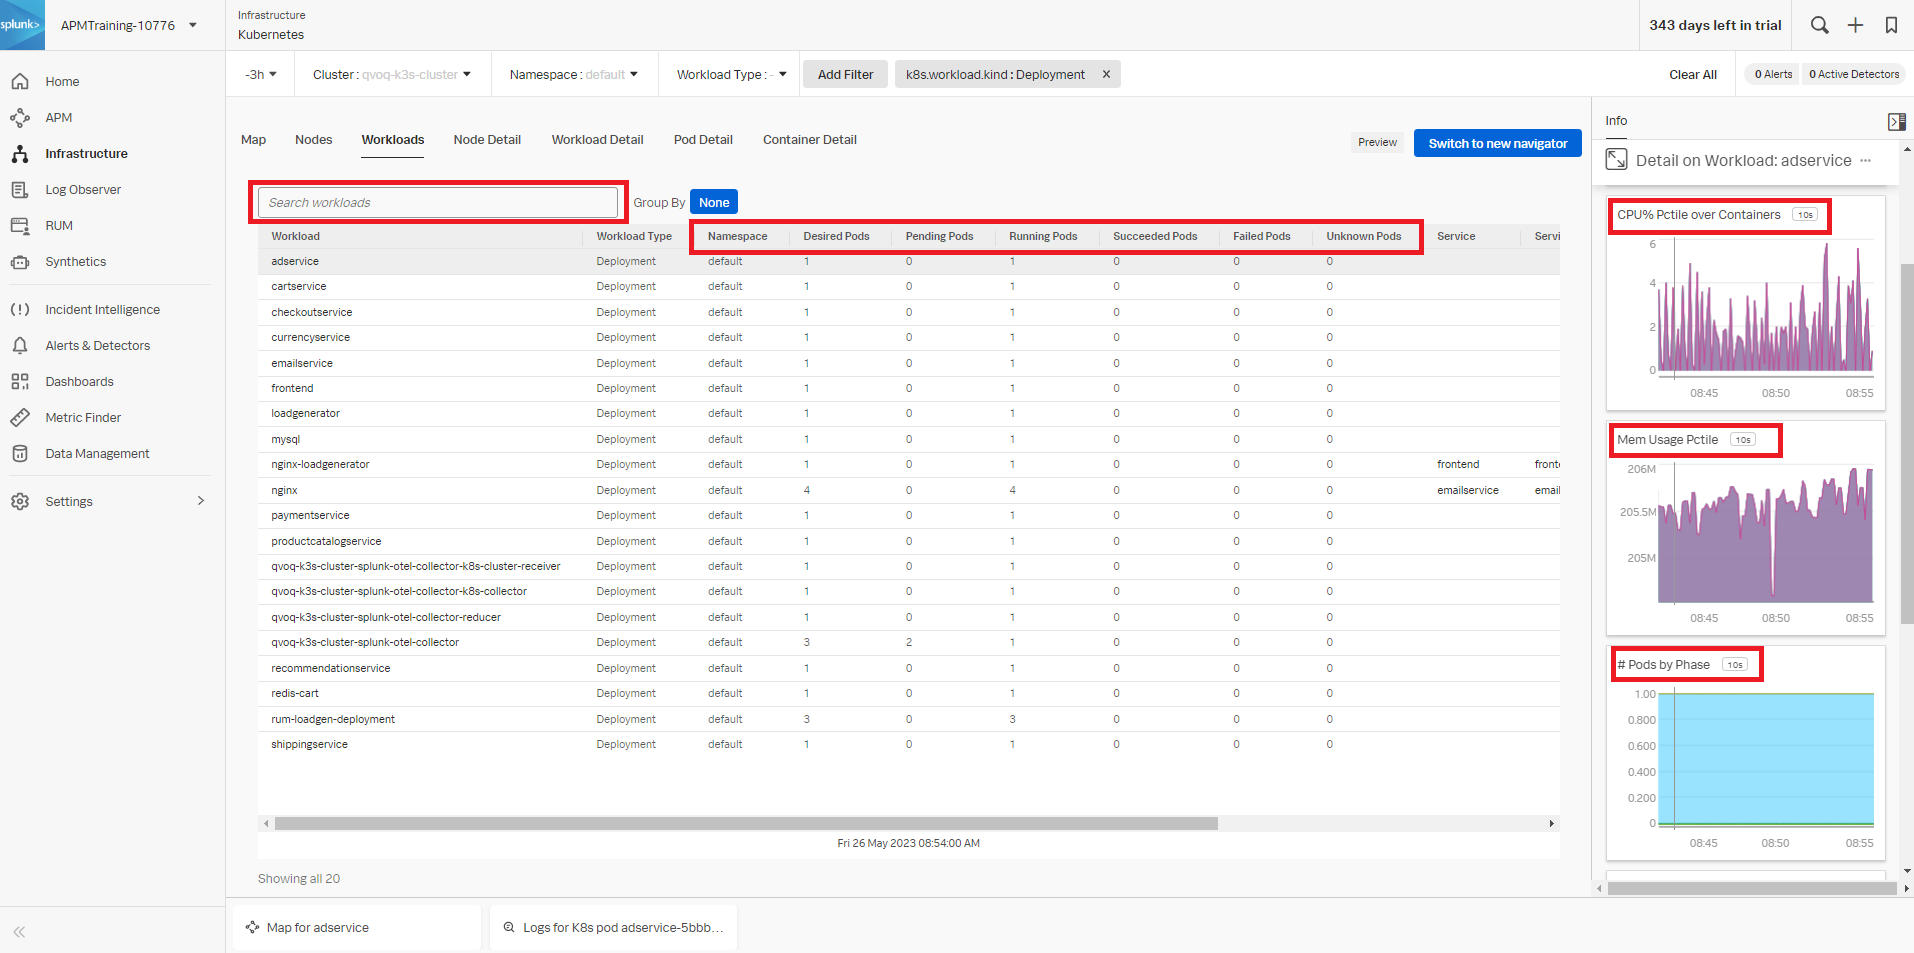
- In the Namespace drop-down menu, select default, and then click Add Filter.
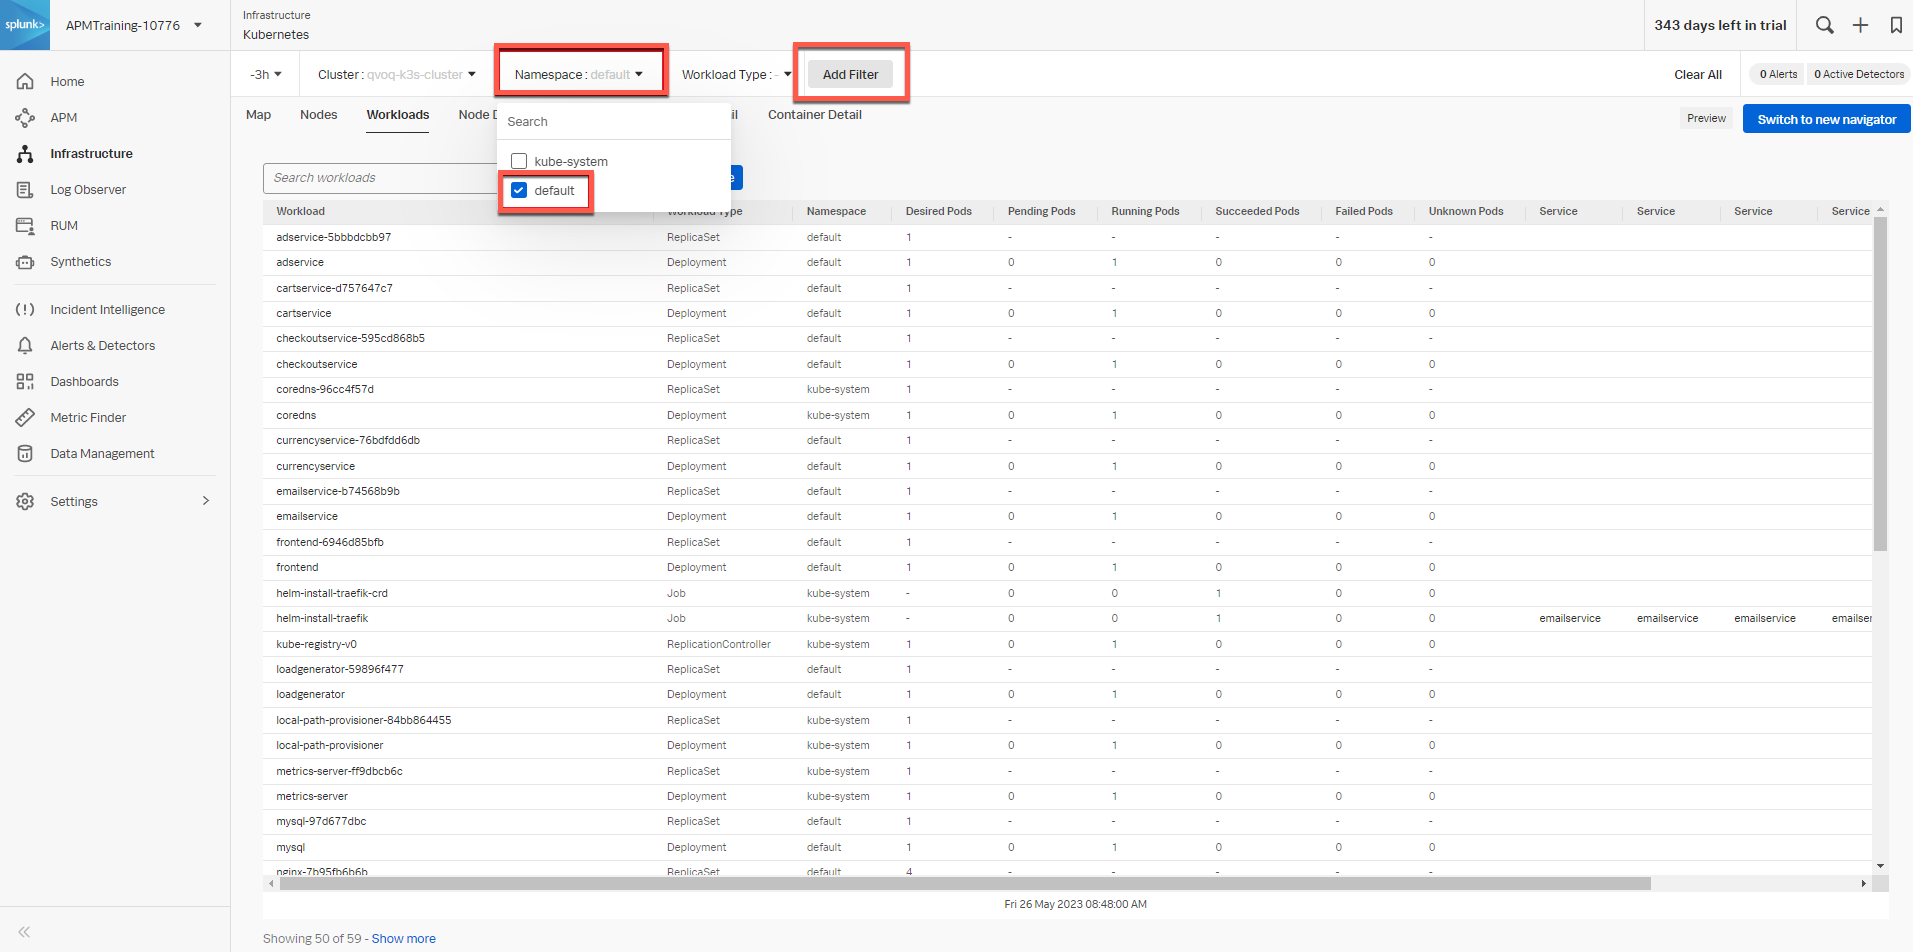
- Select
k8s.workload.kind, select Deployment, and then click Apply Filter.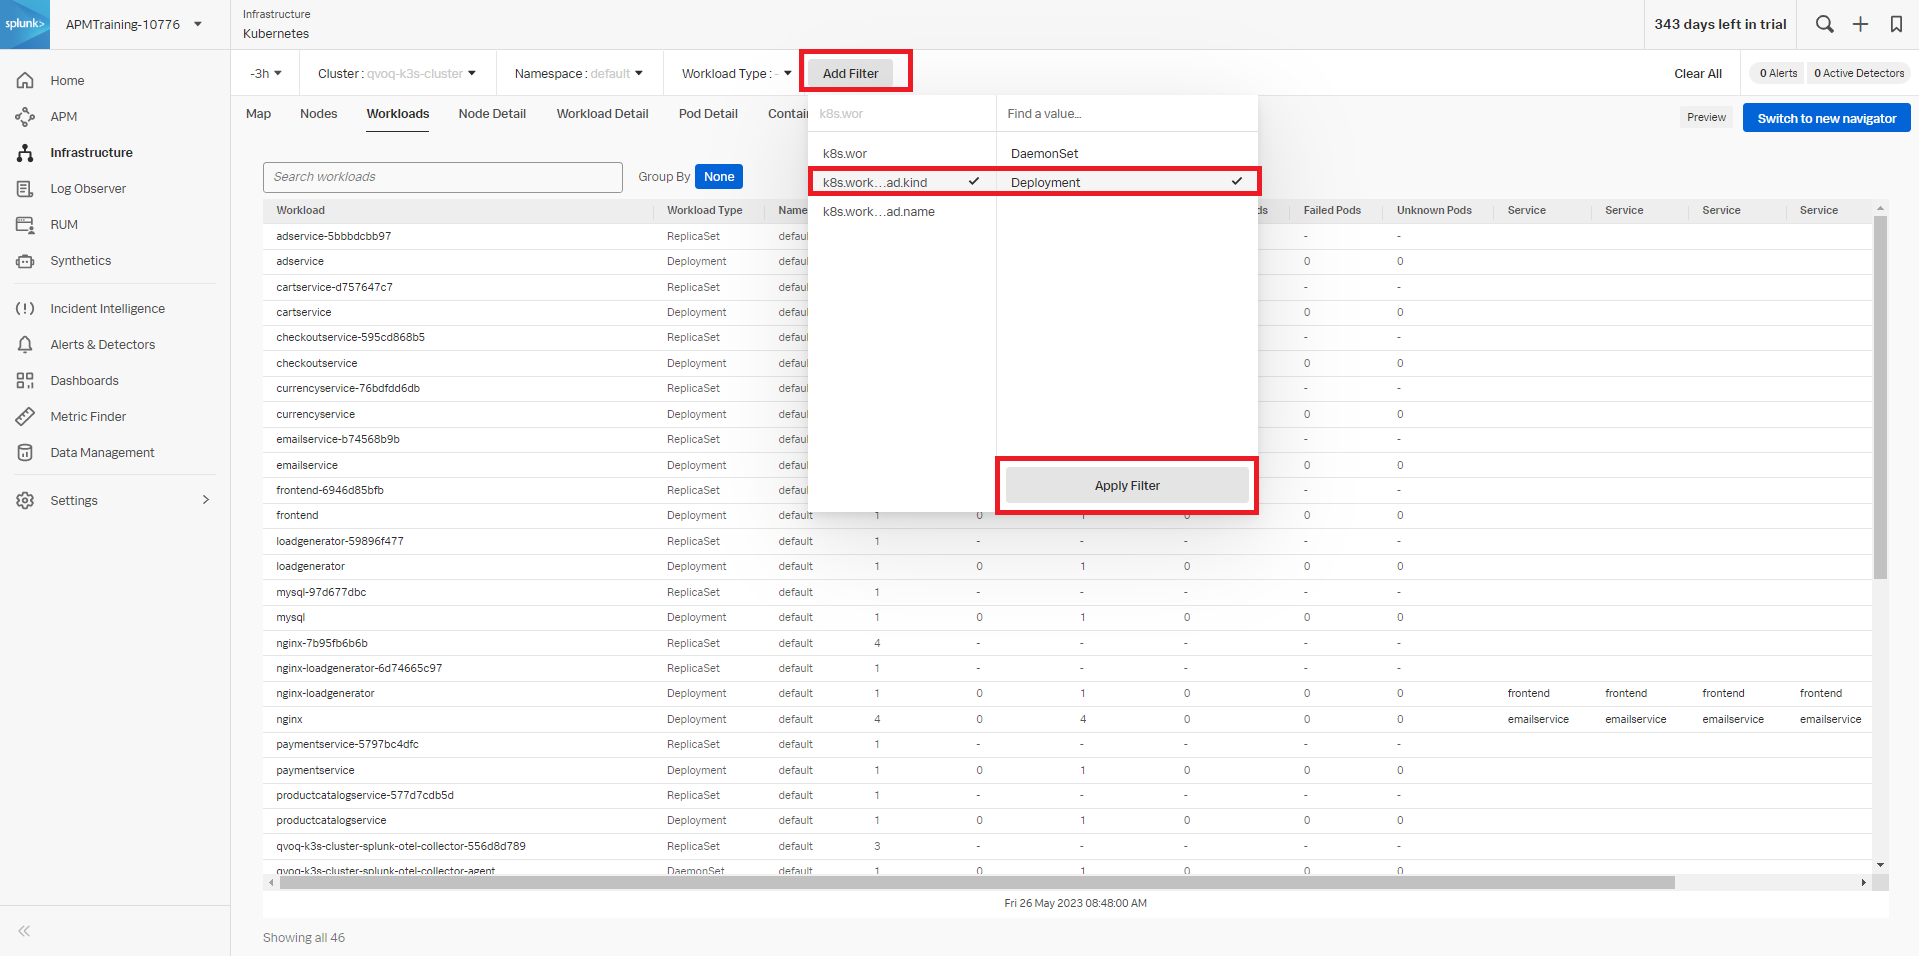
- You can now view the pods that are in a Pending, Running, Succeeded, Failed, and Unknown state. You can also select specific workloads to view the CPU%, Memory Usage, and # Pods by Phase in the right navigation pane.
Next steps
These additional Splunk resources might help you understand and implement these recommendations:
- Splunk Training: Visualizing and alerting in Splunk IM
- Splunk Training: Kubernetes monitoring with Splunk Observability Cloud