Working with service insights in ITSI
Service dashboards in Splunk ITSI
Service Insights enables you to create and use four kinds of dashboards: infrastructure overview, service analyzer, deep dives, and predictive analytics.
- Infrastructure Overview Dashboards provide a consolidated view of all your data integrations and investigation tools for operating systems, virtual infrastructures, containers, and cloud services.
- Service Analyzer Dashboards help you map dependencies based on a connection between devices and applications in a tile or topology view. You can visually correlate services to underlying infrastructure with a tile or tree view. You are also able to drill down to the code level and identify root causes directly from service monitoring dashboards.
- Deep Dives Dashboards are an investigative tool to help you identify and analyze issues in your IT environment. Deep dives display a side-by-side view of KPIs and service health scores over time to help you zoom in on metric and log data and visually correlate root cause. Use side-by-side displays of multiple KPIs and correlate metrics over time to identify root causes.
- Predictive Analytics Dashboards predict future incidents 30 minutes in advance using machine learning algorithms and historical service health scores. The top five contributing service metrics are displayed to guide troubleshooting.
Service modeling and service decomposition
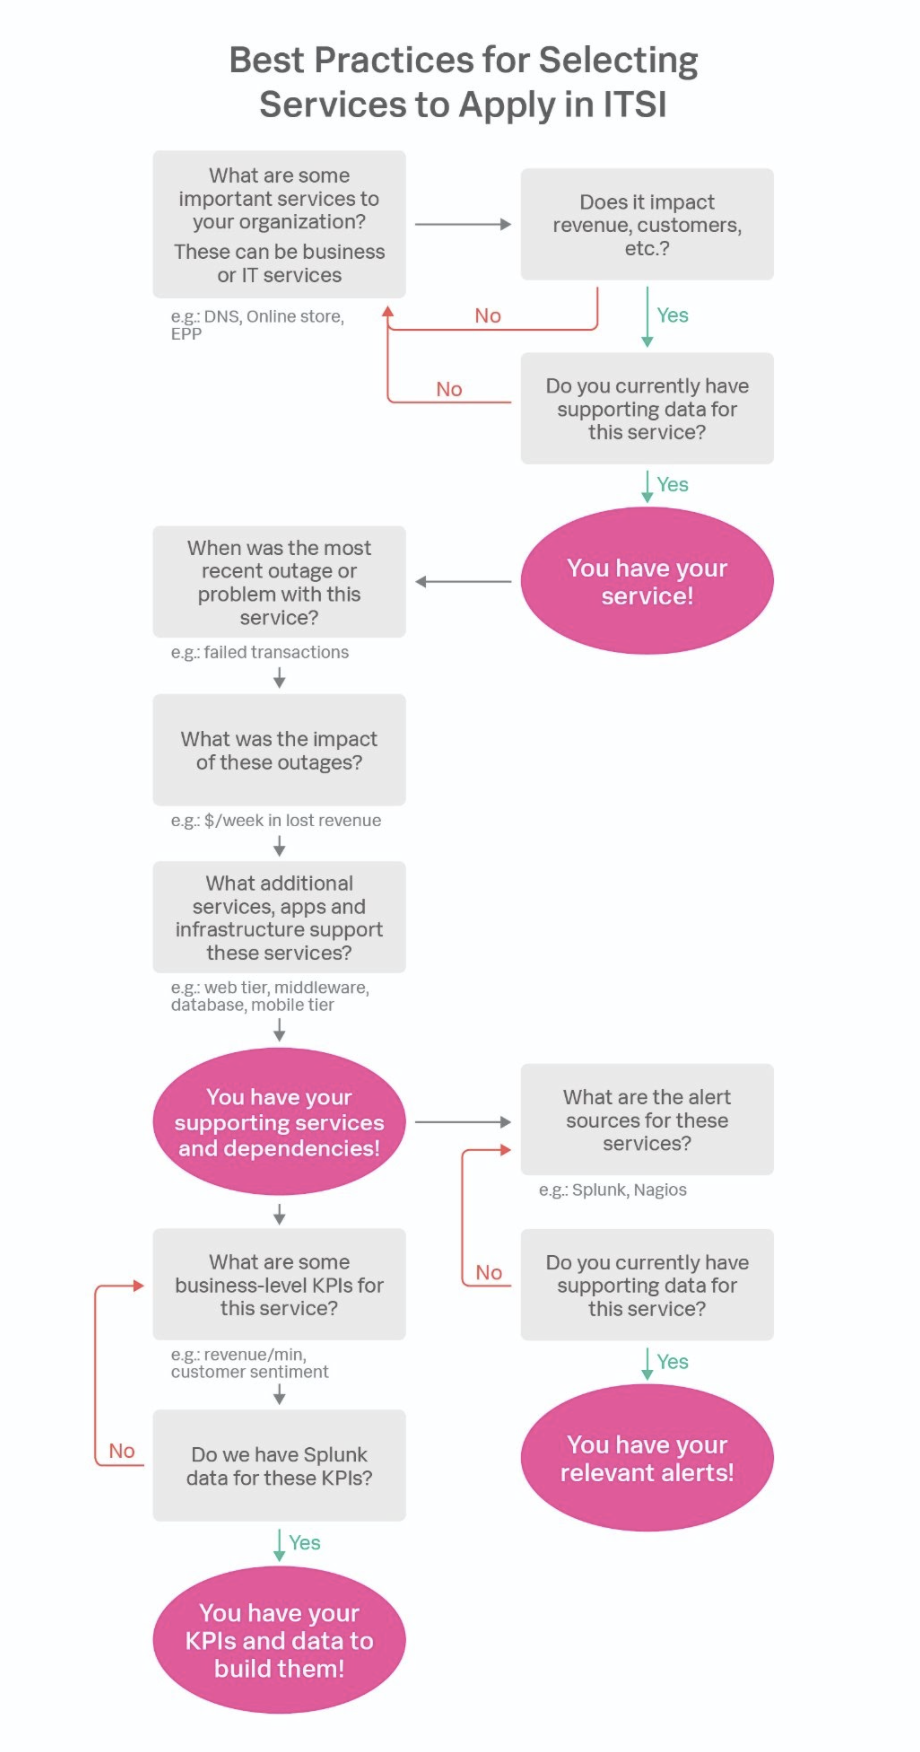
Before you are ready to set up your dashboards and services in Splunk ITSI, it’s important to identify what services will provide the most value.
Best practices for selecting the right services to apply in Splunk ITSI
Create KPIs for your services
Every service you map in ITSI will have at least one KPI. KPIs are recurring saved searches that return the value of an IT performance metric. They are created within a specific service and define everything needed to generate searches to understand the underlying data, including how to access, aggregate, and qualify with thresholds. There are two types of KPIs: business and technical.
Doing pre-work with service decomposition to correctly identify what services are most valuable to the organization is a good first step to identifying appropriate KPIs to map to these services. Please schedule time with your account team to go through the service decomposition workshop.
Best practices for choosing KPIs
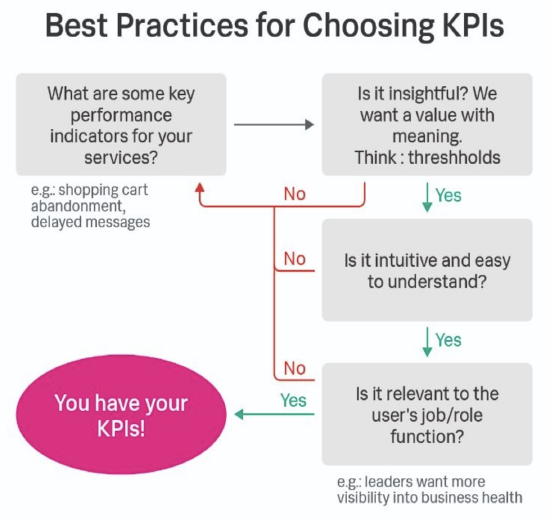
Good KPIs have the following characteristics:
- Provide data regularly
- Self normalizing data
- Data with deltas, not counters
You can also use Splunk App for Content Packs and Content Packs for preconfigured services and KPIs. Here are some KPIs available in the Microsoft 365 Content Pack:
|
Availability KPIs |
Performance KPIs |
Group Administration Activities KPIs |
Login Activity KPIs |
Office 365 Security & Compliance Center |
|---|---|---|---|---|
|
|
|
|
|
After you have your services, entity rules, KPIs, and service dependencies planned out, you can create services in ITSI. There are three ways to do so:
For more information regarding creating services, see the overview of Service Insights in ITSI.
Using the Service Sandbox in ITSI
Service sandboxes in Splunk ITSI are where you can build out services directly from the UI within your existing ITSI environment, accelerating your time-to-value by providing a flexible environment for testing and optimizing IT services.
Key benefits include:
- Accelerated testing and optimization: Allows for rapid prototyping and testing of service configurations without impacting production environments.
- Reduced risk: Minimizes the risk of service disruptions during the development and optimization phases.
- Enhanced collaboration: Facilitates collaboration among teams by providing a dedicated space for experimentation.
Check out this step-by-step guide to put this feature to use, including setup and best practices.
Additional resources
- Product tip: The definitive guide to best practices for IT Service Intelligence
- Splunk Docs: How service health scores are calculated
- Product Tour: Splunk IT Service Intelligence