Benchmarking website performance against competitors
You are responsible for your organization's website performance. You're interested in establishing benchmarks for the performance and availability of your website. Doing so could help in a number of different situations:
- You need to establish realistic service level agreements (SLAs) for the performance and availability of your website.
- You want to show that you have better website performance metrics than a competitor.
- You've been asked to make your website more like a similar website, and are interested to learn how that website's user experiences are quantified so you know what to work on to get your website performing as well or better.
How to use Splunk software for this use case
This article describes two methods to follow to complete this process:
- For Splunk Observability Cloud Synthetics users with access to create comparative testing and custom views
- For Rigor users with access to the benchmarking feature. Note that Rigor will reach end of life on Feb 28, 2025. For more information, see the Frequently Asked Questions.
Splunk Observability Cloud Synthetics
If you want to see how competitors or similar websites to yours are performing for end users, you can run synthetic browser tests and pull KPIs into custom dashboard charts. Here are some suggestions for you to smoothly implement this process:
- Remember to make your comparisons as close as possible. Factors to match might include:
- Type of page tested
- Device and connection speed
- Testing location
- Frequency
- Custom headers like cookies
- After you have a configuration and naming convention you like for one test, create a copy of that test but change the URL and the site-specific part of the test name.
- Test infrequently, for example once a day.
- Focus on single-page browser tests rather than long transactional tests.
- Create a dedicated dashboard with charts on the KPIs you want to monitor, and add labels and descriptions.
- You can create many types of views, for example a separate single-value chart per test, as well as a graph containing a signal for each test to compare to each other.
- After you have one chart or signal configured the way you want, copy the charts or clone the signals to more quickly create these views.
Keep in mind that your testing could be blocked by bot detectors doing their job.
The screenshot below shows example Splunk Observability Cloud Synthetics dashboard charts.
Rigor
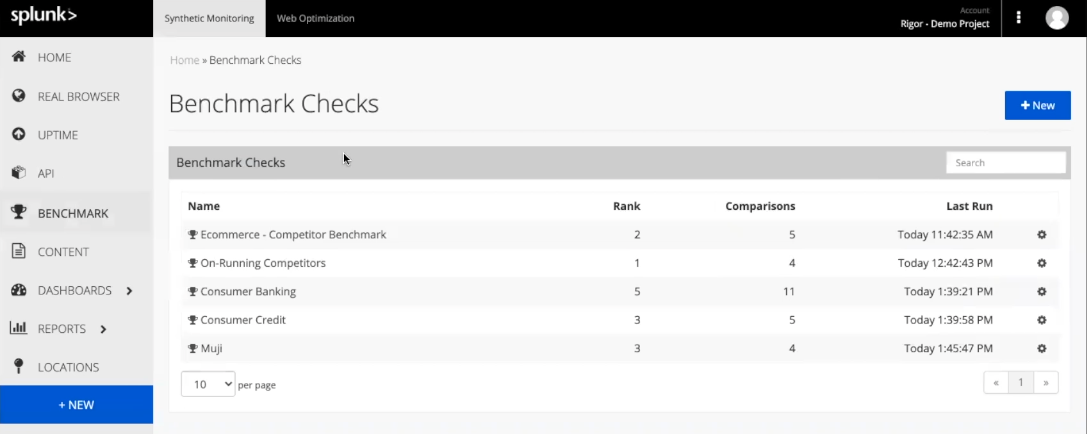
You can use Splunk Synthetic Monitoring to set up benchmark checks to compare the performance of different pages. Typically, you'd want to compare your homepage performance to the homepages of your competitors.
- Open Splunk Synthetic Monitoring and click Benchmark.

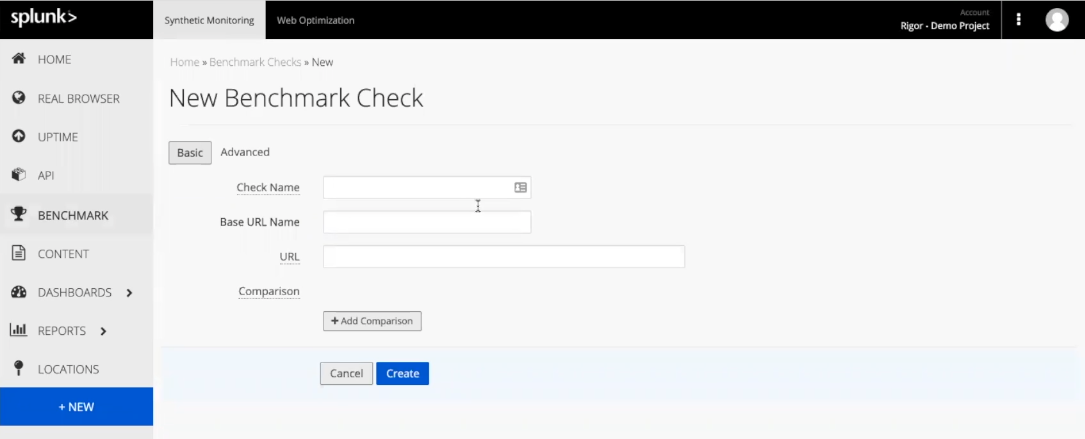
- Click New.
- In the New Benchmark Check menu, enter the following details:
- A name for the check that describes what you're checking (for example, "Competitor homepage check")
- The name of your own URL that you will use a basis for the competitor checks (for example, "Our homepage")
- Your own URL

- To add names and URLs for competitor sites to compare against your URL, click Add Comparison.
- To set up the check, click Create.
After it is created, the Benchmark check updates automatically once per day and compares competitor websites to determine appropriate SLAs.
Next steps
These Splunk resources might help you understand and implement this use case:
- Getting Started Guide: Splunk Synthetic Monitoring
- Use case: Identifying slowly loading web pages

