Assessing the financial impact of eCommerce checkout errors
Splunk Log Observer is no longer available for sale. For new customers interested in this functionality, we recommend you look into Log Observer Connect, which is free for Splunk Enterprise or Splunk Cloud Platform customers.
You are a site reliability engineer working in a cloud-native environment that runs several microservices to support an online store. Yesterday, your customer support team received a number of complaints from customers who were experiencing checkout delays. Using Splunk Observability Cloud, you located the source of the problem and implemented a fix.
Now, your organization's executive team has heard about the problem, and they have asked you to report on whether any financial loss was incurred because of the outage. You need to first look for differences in payment trends around the time of the problem, and if there is a difference, report a dollar value.
Data required
How to use Splunk software for this use case
- Make sure you have fully troubleshooted and fixed the problem that caused the checkout delays. This article breaks down a typical example of this process. In that example, a new version deployment was causing errors in the paymentservice node, and deployment needed to be rolled back.
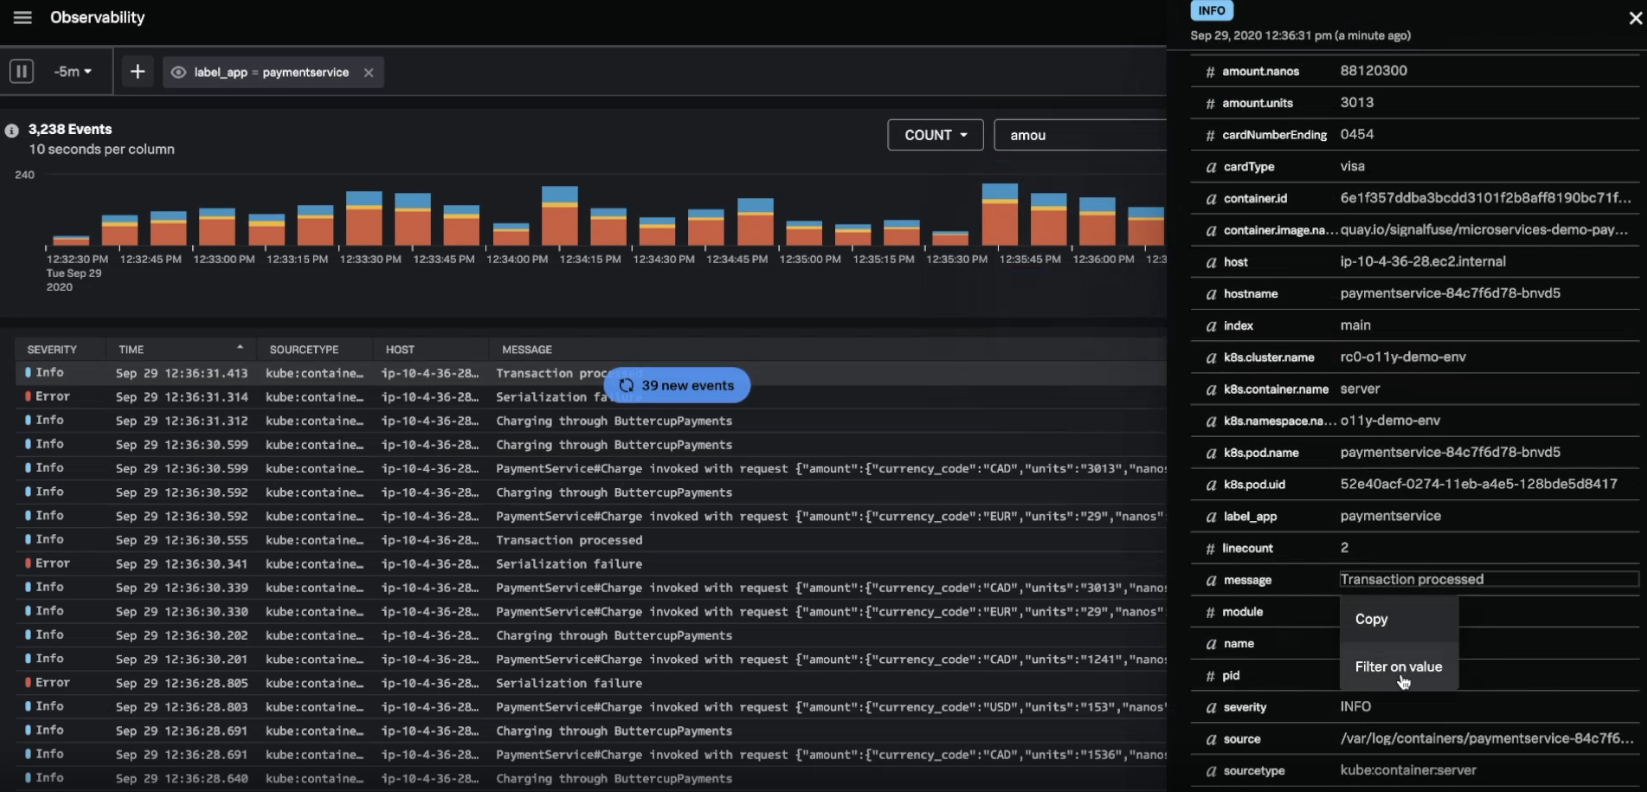
- Open Splunk Log Observer and filter for the paymentservice node.
- Filter for the value Transaction processed. An easy way to do this is to click on a log that reads Transaction processed.
- Scroll down and locate Transaction processed in the message field. Right-click on it and select Filter on value.
- In the Visual Analyzer, sum amount.units and group them by amount.currency_code. This brings up a line chart showing the value of transactions for the timeframe you have selected. You can filter for a specific currency, if needed, by using the currency key on the right of the chart.
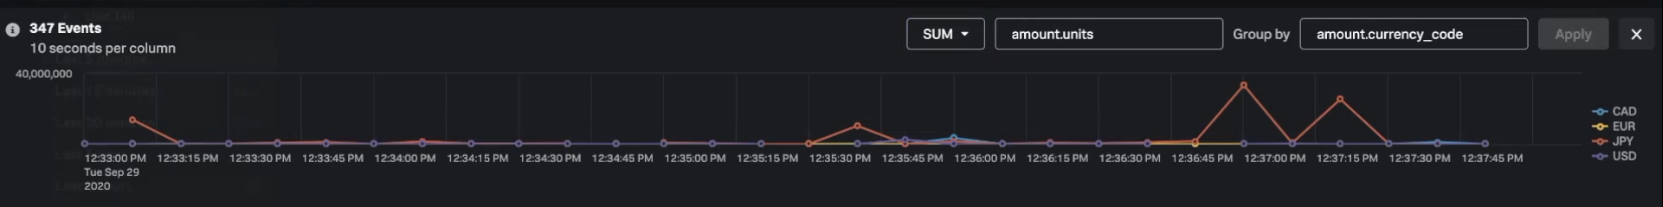
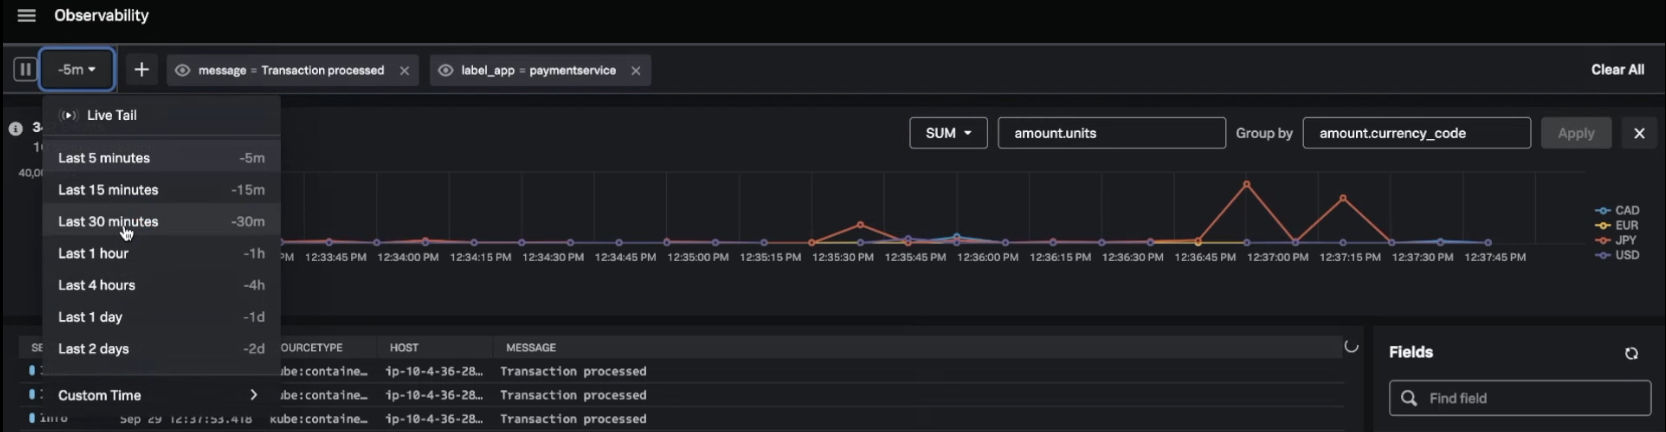
- Adjust the time frame shown to focus on transactions processed before and after the outage. If there is a lower payments trend caused by the problem this can be seen by looking at the line chart in this area, moving your cursor over the points in the chart to see the exact values in the currency you have chosen.
Additional resources
The content in this guide comes from a .conf2020 talk, Logging for Observability, one of the thousands of Splunk resources available to help users succeed. In addition, these Splunk resources might help you understand and implement this use case: