Bringing episode data into service scores
Information from Splunk ITSI (ITSI) episodes can be extremely useful in pinpointing problems and focusing operations time on issues that need resolving immediately.
By default, ITSI allows users to link high and critical severity episodes to services, but it doesn’t allow episodes to affect service scores out-of-the-box.
This article shows you a method of having any open episode contribute to service health. This technique can be useful if you want the service tree to reflect open episodes that aren’t necessarily critical or high in severity, which wouldn’t ordinarily be flagged at the service level.
- The decision to adopt this approach won’t be right for every environment. Most times, if you want to affect service health then the usual KPI method will suffice.
- Before you begin this process, make sure you are familiar with how correlation searches, notable events, aggregation policies and episodes in ITSI work. You should ensure you understand the complete configuration from correlation searches to the NEAP that services generated notable events.
Default behaviour example - Service health not affected by an episode
Let's start by looking at how episodes work by default in ITSI, where service health is not affected by episodes and Service Analyzer only shows “Critical” or “High” alert episodes.
In this example we'll use the same correlation search as that shown in Bringing alerts from Prometheus Alertmanager into ITSI episodes.
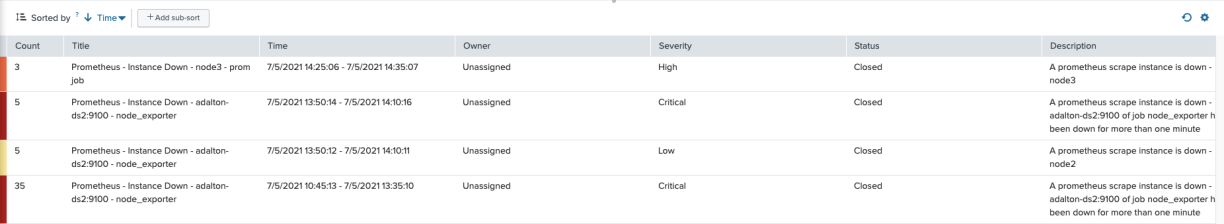
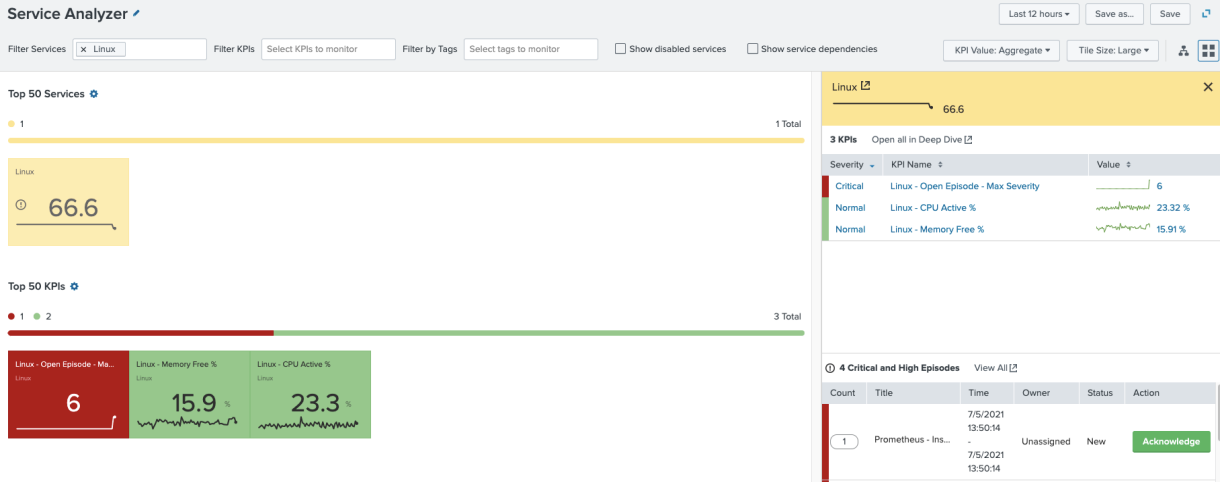
This correlation search looks for any events from Prometheus Alertmanager that tells you that a scrape target is down. The correlation search is associated to a service called “Linux”. The Episode Review dashboard shows the open episode:
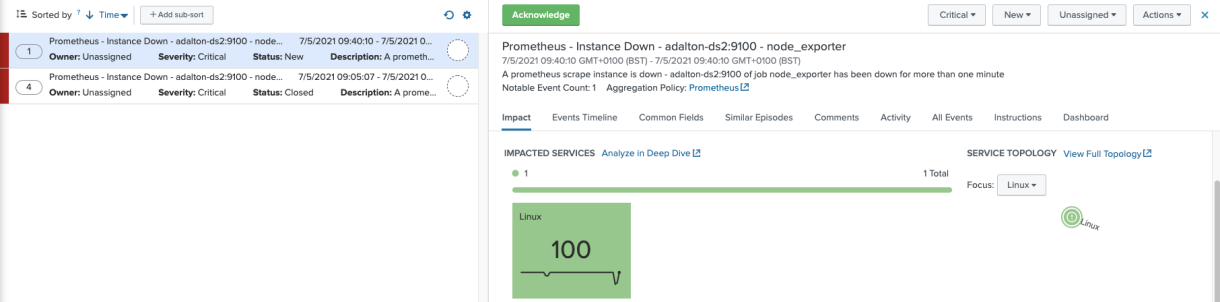
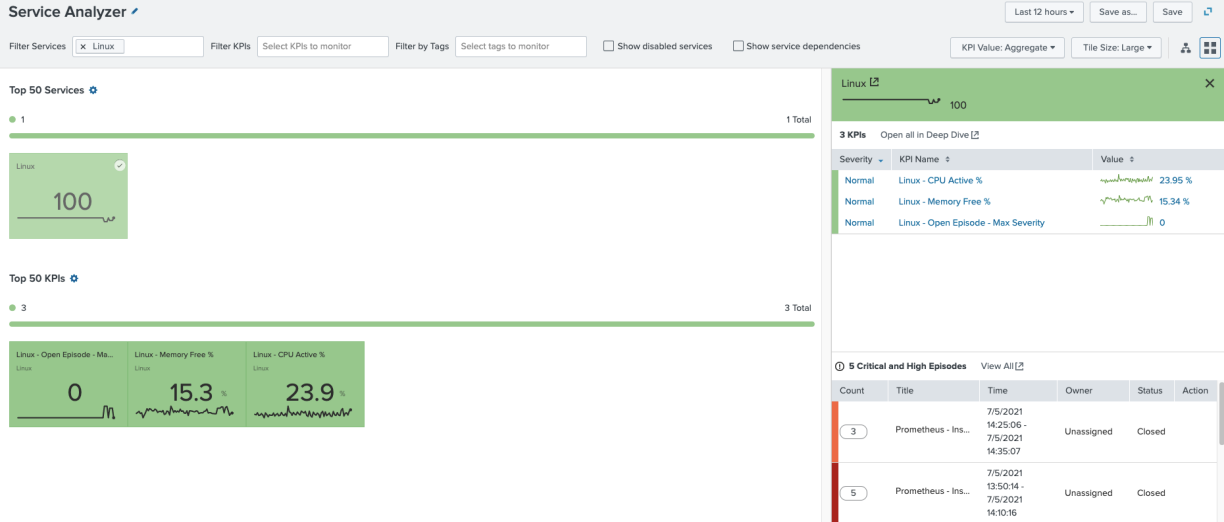
The Service Analyzer shows that the service has an open Critical or High severity episode. Drilling into the service shows the episode.
Custom behavior example - Service health is affected by an episode
This technique can be used if you want any open episode, regardless of severity, to affect service health. There are some important caveats to this method that you should be aware of.
- Although this technique will allow any episode to affect the service health score, episodes lower than the high severity will still not be shown in the drill-down view.
- In order to track episodes, you need to use the ITSI summary indexes provided with the product. This means that tracking of the episodes is only ever as recent as the underlying correlation search that is run.
- For example, if you run a correlation search once a day, the KPI you create to track open episodes can only ever tell you whether the status of the episode is current once a day. If the once-a-day correlation search created a notable event and subsequent episode at 13:00 for example, and a user manually closed the episode at 13:10, the next available time your KPI could ascertain whether the episode is still open is 13:00 the next day. Potentially, you could see a service score affected for a long period where there is no open episode.
- This issue is also inherent in correlation searches in general. Correlation searches work best when checking for a condition continually over small periods of time and it is over small periods of time that this technique works best. In the example that the correlation search runs every 5 minutes, every time an issue is detected, a notable event is created and feeds an episode. Every 5 minutes, the status of open episodes is also tracked. You know a status event is being raised each time the condition is true, so when you have checked the status events and an event hasn’t been raised for 5 minutes you can safely assume the episode is no longer being updated and it is effectively over.
- This technique alone does not close episodes, as your NEAP settings dictate this.
itsi_grouped_alerts
The itsi_grouped_alerts index is the index that contains live episode data. Each time a correlation search runs and updates an episode, itsi_grouped_alerts houses a new entry for the episode. It is this index you will search over to look for open episodes attached to your service.
Here’s an example of the raw data:
{"drilldown_search_earliest_offset":"-300","event_identifier_fields":"aler t_description","instance":"adalton-ds2:9100","itsi_group_count":"2","event _source":"prometheus","rid":"0","itsi_instruction":"Check alertmanager at http://10.202.33.172:9093/#/alerts?silenced=false&inhibited=false&active=t rue&filter=%7Balertname%3D%22InstanceDown%22%7D","itsi_is_first_event":"fa lse","search_name":"Prometheus - Instance
Down","is_entity_defined":"0","itsi_group_description":"A prometheus scrape instance is down - adalton-ds2:9100 of job node_exporter has been down for more than one
minute","orig_time":"1620381006.8076491","orig_rid":"0","entity_key":"N/A" ,"mod_time":"1620381006.8076491","alert_description":"adalton-ds2:9100 of job node_exporter has been down for more than one
minute","itsi_group_severity":"6","drilldown_uri":"Check alertmanager at http://10.202.33.172:9093/#/alerts?silenced=false&inhibited=false&active=t rue&filter=%7Balertname%3D%22InstanceDown%22%7D","search_type":"basic","it si_service_ids":"e994a71a-d2ab-4a44-abeb-94d7002e328f","drilldown_search_l atest_offset":"300","itsi_group_id":"eea66032-bbe8-4a01-8623-dfa8054276b0" ,"itsi_group_instruction":"Check alertmanager at
http://10.202.33.172:9093/#/alerts?silenced=false&inhibited=false&active=t rue&filter=%7Balertname%3D%22InstanceDown%22%7D","itsi_is_last_event":"fal se","itsi_split_by_hash":"alert_description:adalton-ds2:9100 of job node_exporter has been down for more than one
minute:","orig_description":"A Prometheus scrape instance is down: adalton-ds2:9100 job name:
node_exporter","status":"1","itsi_first_event_time":"1620380713.888","enti ty_title":"adalton-ds2","is_use_event_time":"0","description":"A prometheus scrape instance is down - adalton-ds2:9100 of job node_exporter has been down for more than one minute","title":"Prometheus - Instance Down - adalton-ds2:9100 -
node_exporter","itsi_earliest_event_time":"1620380713.89","host_entity":"a dalton-ds2","itsi_parent_group_id":"9833ca3a-b945-43b0-b985-48c063e54127", "is_service_aggregate":"0","event_field_max_length":"10000","itsi_group_ti tle":"Prometheus - Instance Down - adalton-ds2:9100 -
node_exporter","severity":"6","owner":"unassigned","entity_lookup_field":" host_entity","itsi_group_assignee":"unassigned","itsi_group_status":"1","i s_entity_in_maintenance":"0","itsi_first_event_id":"ec06e9aa-af18-11eb-88f 0-0a358b1d0c8b","event_id":"9a9ed66c-af19-11eb-b0b8-060bec41cfef","job_nam e":"node_exporter","itsi_policy_id":"764b5e64-92fb-11eb-907f-060bec41cfef" ,"instruction":"Check alertmanager at
http://10.202.33.172:9093/#/alerts?silenced=false&inhibited=false&active=t rue&filter=%7Balertname%3D%22InstanceDown%22%7D","orig_status":"0","itsi_l ast_event_time":"1620381006.808","event_identifier_hash":"8749b8a444a31fbd 73224eb4ff6f23a25f4f86e0c40cdaccca253245e34b5134","event_identifier_string ":"adalton-ds2:9100 of job node_exporter has been down for more than one
minute","orig_severity":"6","orig_sid":"scheduler__admin__itsi__RMD518641b 3841291c1d_at_1620381000_12983_C1904F46-E235-41D9-AD9F-6EDD98B720B1"}
Creating the KPI
In order to affect service health in ITSI, you need to create a KPI. Your KPI is going to look over the itsi_grouped_alerts index for any episodes that are linked to the service you are interested in.
The highest severity open episode is what dictates the severity of your KPI. The severity of your KPI affects the service health score.
- Start to create a new KPI in the service you are interested in by navigating to your service, select the KPIs tab and the New dropdown, then select Generic KPI. Click through step 1 to step 2.
- Complete KPI Source, Search and Threshold Field in step 2 of the wizard. In the example shown below, a KPI called “Linux - Open Episode - Max Severity” is created as a generic KPI using an ad-hoc search.
- The search uses the
getservicecommand to fetch the service ID as the itsi_grouped_alerts_index uses the service_id rather than name to track episodes. - The search looks back 6 minutes for status. This is because the correlation searches for this service all run on a 5 minute schedule, so by setting your KPI search to 6 minutes you can ensure you always catch the status event.
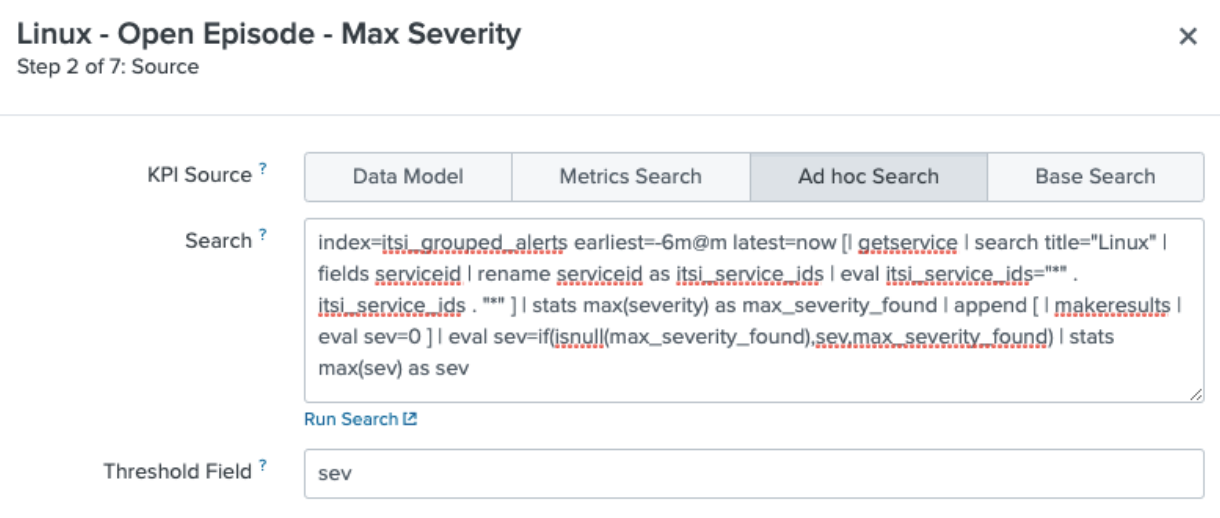
index=itsi_grouped_alerts earliest=-6m@m latest=now [| getservice | search title="Linux" | fields serviceid | rename serviceid AS itsi_service_ids | eval itsi_service_ids="*" . itsi_service_ids . "*" ]
| stats max(severity) AS max_severity_found
| append [ | makeresults | eval sev=0 ] | eval sev=if(isnull(max_severity_found),sev,max_severity_found)
| stats max(sev) AS sev
- The search uses the
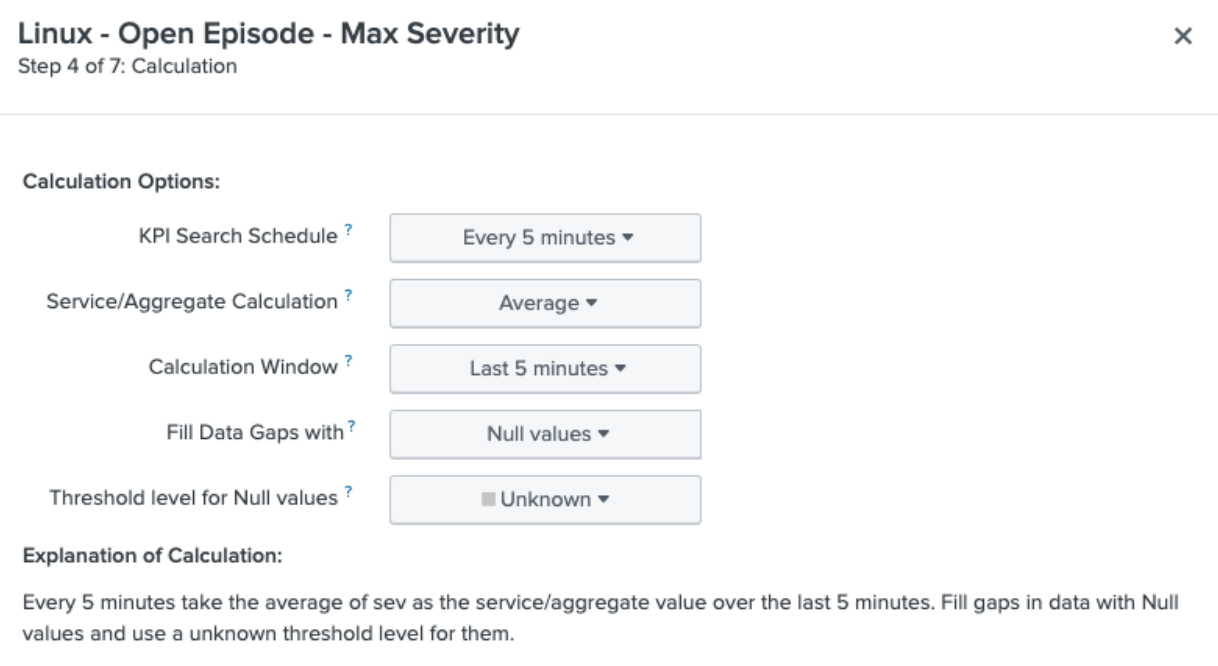
- Continue to configure the KPI, clicking through step 3 then completing step 4 as shown below. You do not need to split or filter by entity for this KPI. Set the Search Schedule to run on a 5 minute cycle. Although the Calculation Window is set to 5 minutes here, by embedding the earliest and latest times in your search you will override this setting.
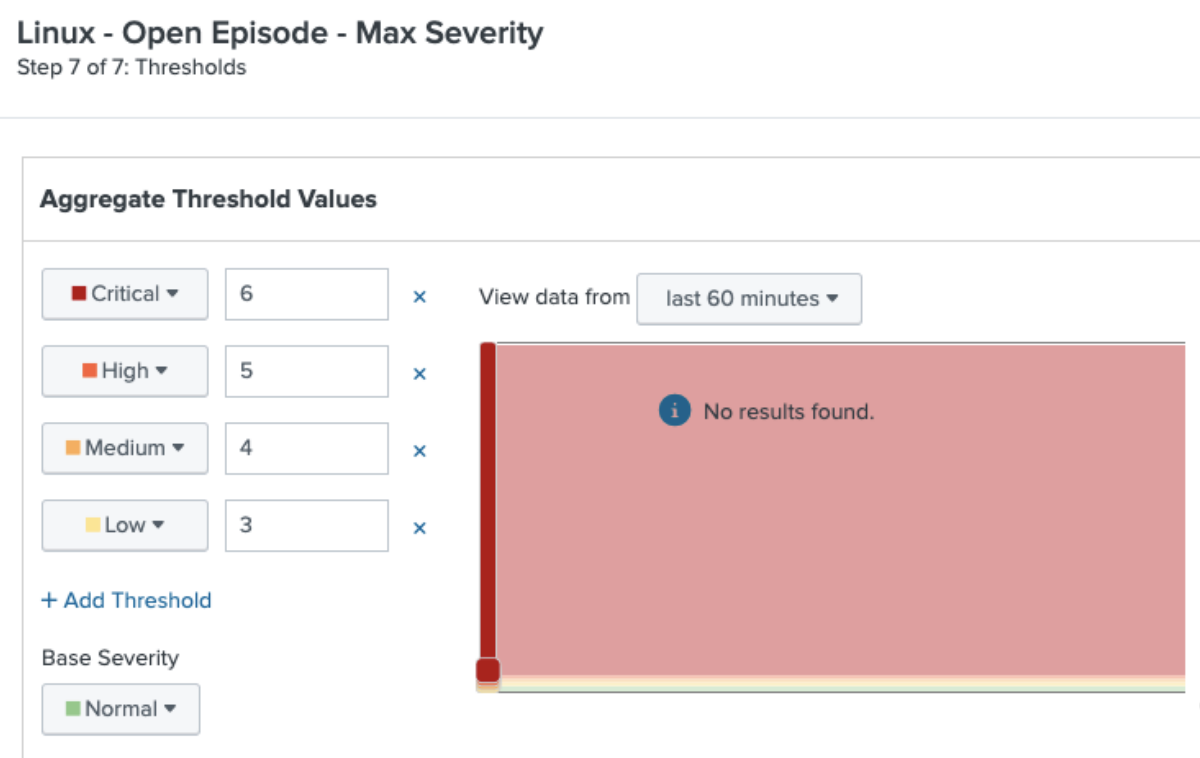
- Continue to configure the KPI, clicking through steps 5 and 6 then completing step 7 as shown below. Set the following threshold values to map your KPI severity to the severity of the highest open severity episode.
Results
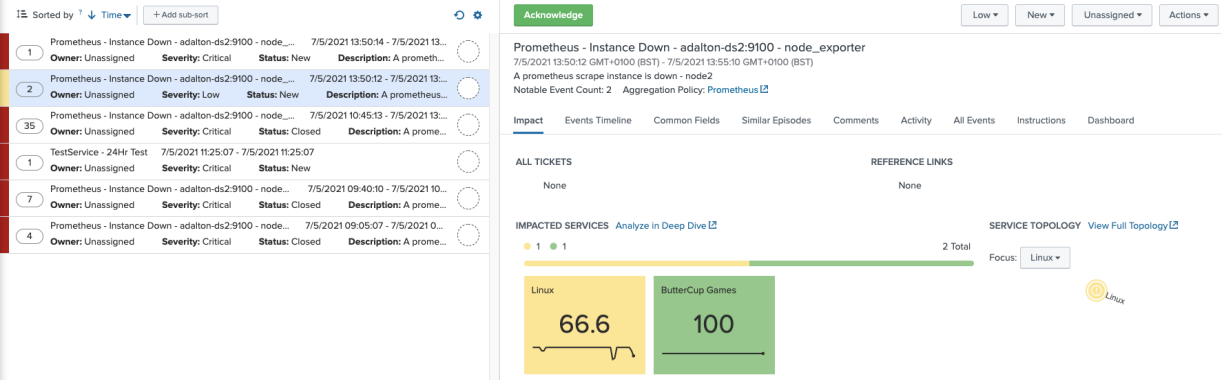
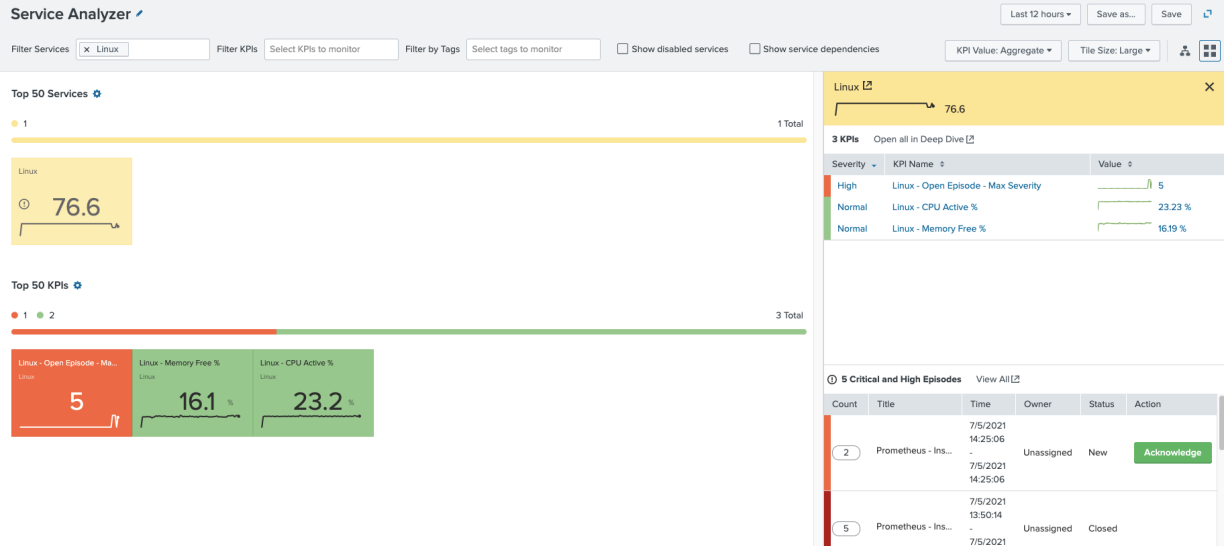
Now if you view Episode Review, an open episode for the Linux service would look like this:
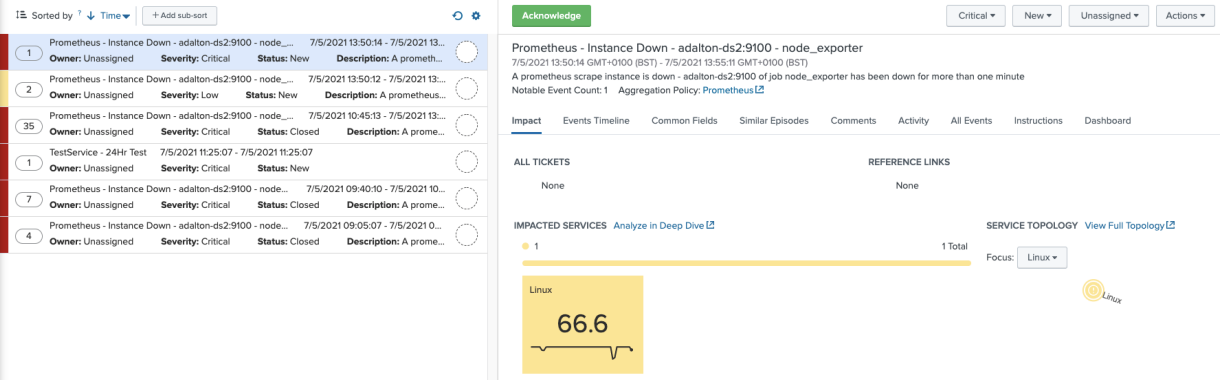
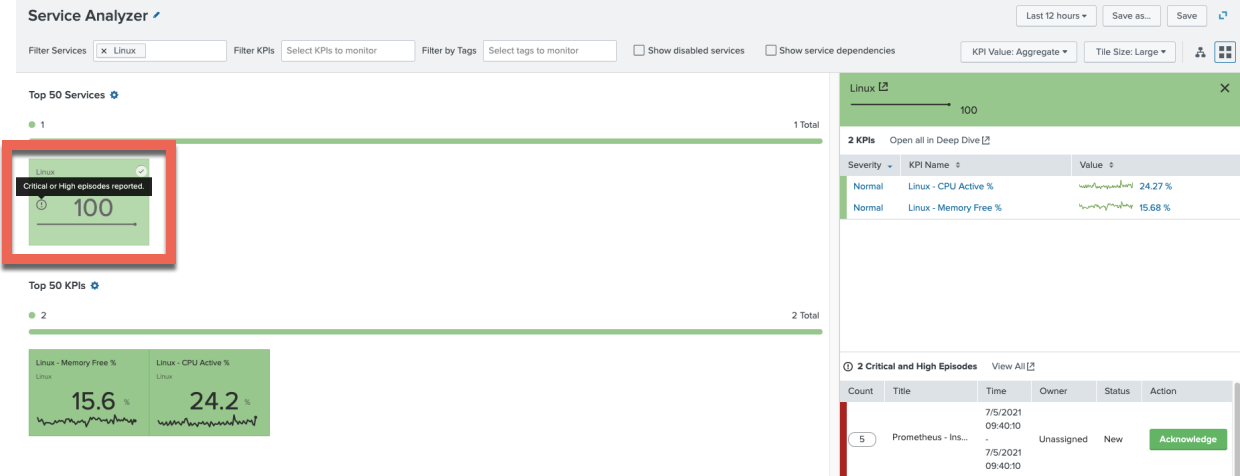
Looking at your Linux service, you see your new KPI fired at the Critical severity and affects service health score accordingly.
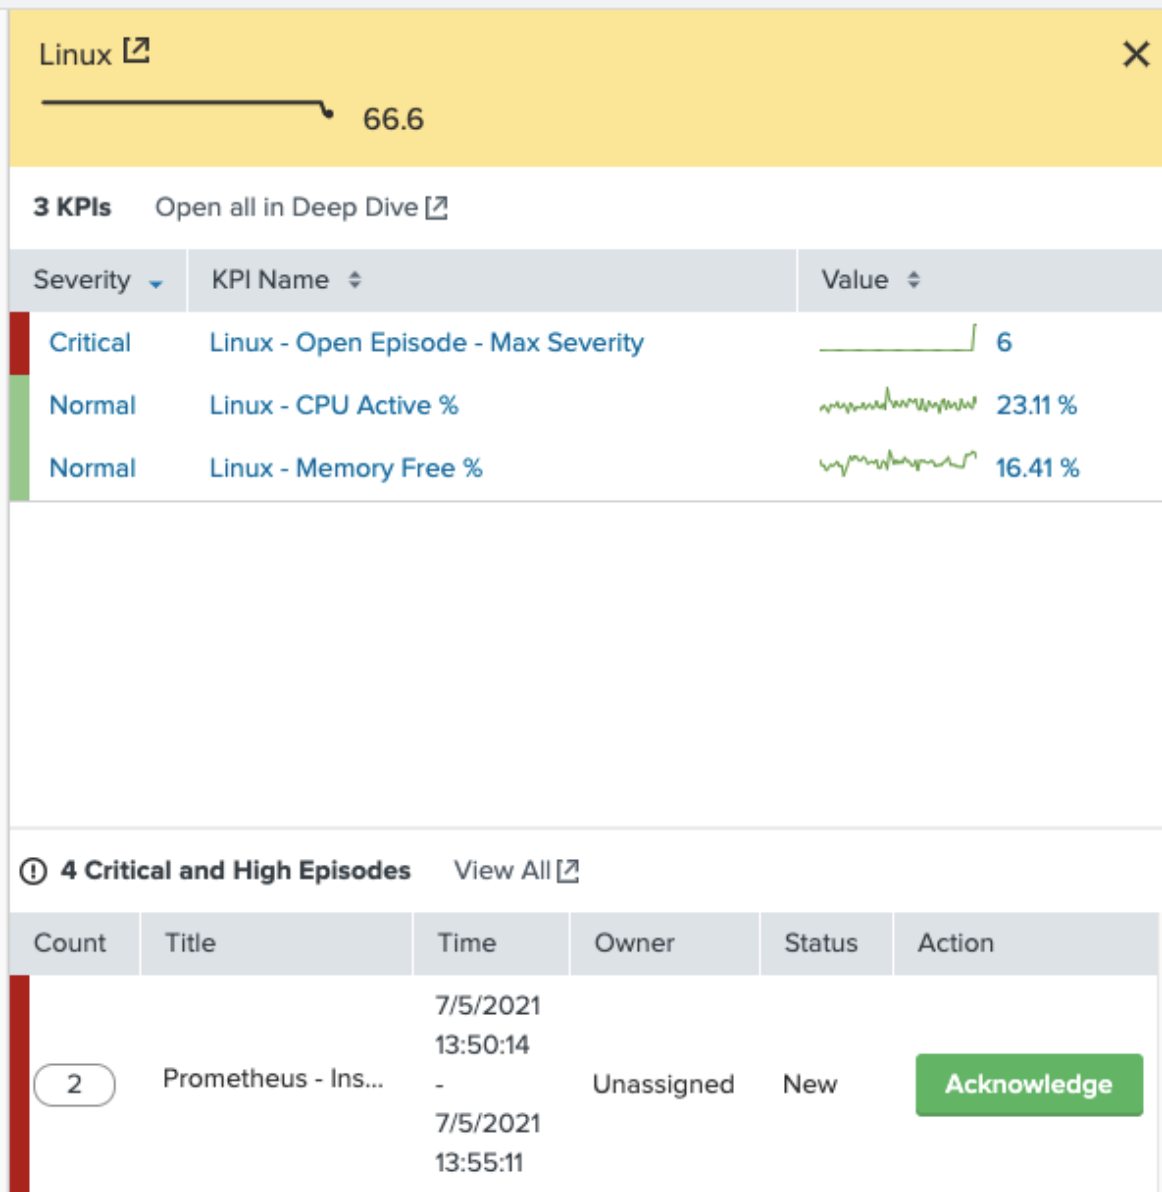
To test out that the system is only using the highest severity KPI, you can create a new episode to fire at Low severity, which shows that only the highest severity is used. This episode is also linked to another service, so that could be why it's only a Low severity.
The Service Analyzer view is still affected by the highest severity open episode. You’ll also notice that the Low severity episode is not being shown in the drilldown view, only the Critical episode.
In the event that there is only a “Medium” severity open episode with the KPI severity adjusting along with the service health score, the screen you'll see looks like this:
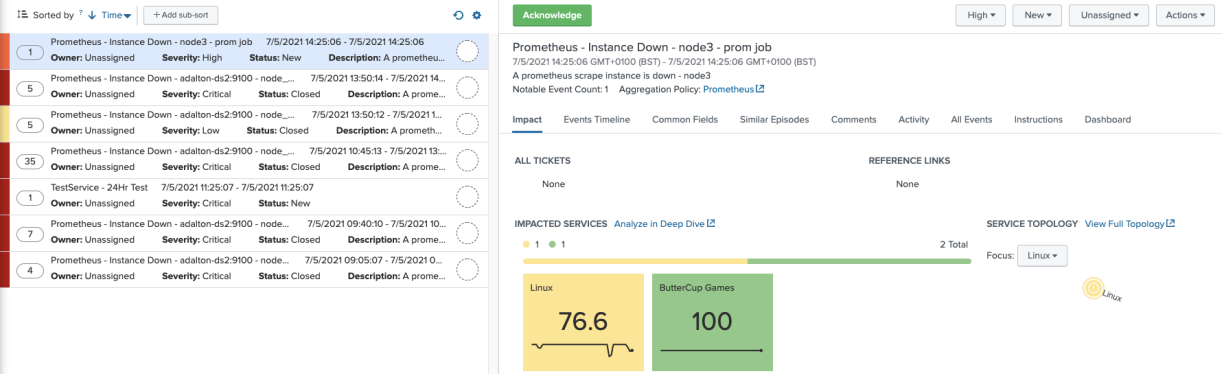
Service Analyzer shows the new severity and the health score has improved slightly. This time, as the episode is either High or Critical, you will see it show up in the drilldown.
Finally, when no episodes linked to the service are open, the KPI and the service score update accordingly.