Minimizing alert storms in cloud and hybrid IT environments
Detectors and real-time alerting are critical pieces of Splunk Observability, allowing you to receive notifications when something needs your attention. However, if a detector is not set up correctly, you might not receive alerts at the right time or you might receive too many alerts in an alert storm. It is important that detectors are configured correctly so your team is able to respond to the right issues quickly, without any notification fatigue.
Solution
Splunk Observability Cloud detectors can both help lessen alert fatigue and improve notification context when they are configured correctly. Detectors look at metric time series (MTS), also known as signals, to evaluate when an alert should be fired. In a simple detector, an alert is fired whenever the signal goes above or below a threshold. When an alert is fired, a notification can optionally be sent to different outbound integrations including Splunk On-Call, Slack, ServiceNow, PagerDuty, Jira, and custom webhooks.
AutoDetect is a set of out-of-the-box detectors that are automatically created to cover standard infrastructure components and intelligent anomaly detection without requiring additional work from users. Users can customize AutoDetect by filtering to the subset of components that are most important, adjusting thresholds, and modifying the messages sent in notifications.
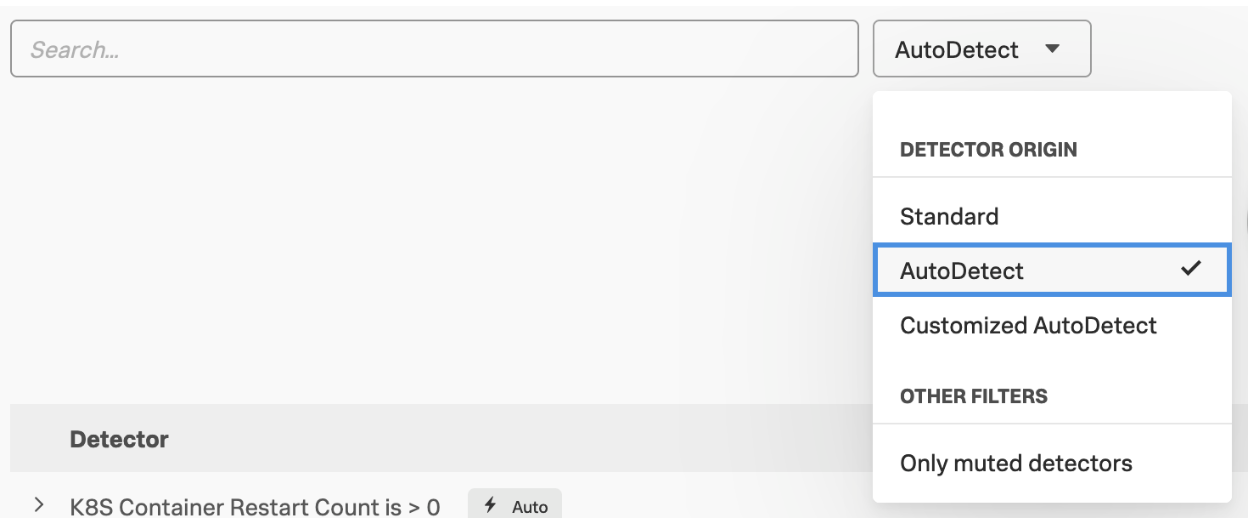
AutoDetect is available for many common infrastructure components and cloud providers, in addition to Splunk Observability Cloud system and subscription limits. To find out-of-the-box alerting in your organization, go to the Detector page and use the dropdown to filter to AutoDetect.
While AutoDetect covers many of the alerting use cases you may be looking for, you may still need to create custom detectors. You can create custom detectors in context to a chart you’re viewing or create them from scratch using the New Detector button. When creating new custom detectors, it’s important to keep a few things in mind:
- Quantify your goal in natural language. When should an alert fire? If it’s not easy to express these times, it will be more difficult to configure the detector correctly.
- Monitor symptoms of problems, not causes. Since your customer’s user experience is ultimately what matters, fire alerts on signs of their user experience, whether that is too many errors, pages loading too slow, or outages causing downtime to your application. If you alert on all of the known causes of those issues, you will likely end up with alert fatigue from so many potential issues.
- Provide appropriate context to alert responders. Will the person receiving a notification from this detector know what steps to take to begin troubleshooting the issue?
- Leverage features in Splunk Observability Cloud to improve alerting. For example, the alert preview estimates how many alerts will fire based on recent history. In addition, AutoClear automatically clears the alerts if the infrastructure sending the data churns and the alerts aren’t present anymore.
Even keeping these best practices in mind, there are additional, advanced steps you can take to further improve alerts.
Follow advanced best practices
Many of these concepts require a better understanding of the data you send in. Follow these steps to become an expert-level detector editor:
- Delayed data can cause unpredictable alerting behavior. If datapoints do not arrive on time because of a network or pipeline issue, those datapoints will not be included in the detector. Advanced settings allow you to ensure the right data is included in the detector.
- By default, alerts are cleared whenever their firing condition is not true anymore. By switching into the SignalFlow editor, you can create custom conditions to define when the alerts should be cleared.
- Detectors work best when datapoints arrive regularly. Aperiodic data is data that doesn’t arrive on a regular interval. To create detectors with aperiodic data, you may want to consider these options:
- In the UI, you can configure a zero extrapolation policy.
- In SignalFlow editor, you can specify a resolution in your data block.
- Leverage the SignalFlow library for aperiodic detectors.
Provide the right context
To provide the right context for your alerts, find the line between too much and too little information. Use the following two guidelines to create your alerts, and then use the Alert Preview feature, which lets you estimate how many alerts your detector configuration will create based on historical data. Then you can adjust as needed.
- Keep it simple. Providing too much information to dig into can lead to increased troubleshooting time.
- Include context and next steps in the alert message. Include relevant details about customers, links to runbooks, the failure, etc. This allows the responder to jump right into troubleshooting mode.
Next steps
Now that you understand how detectors reduce alert storms, watch the demo in this .Conf22 Talk (Monitor and Troubleshoot Across Cloud and Hybrid IT to Minimize Alert Storms) to learn more.
These additional Splunk resources might help you understand and implement this product tip:
- Splunk Video: Set up detectors and alerts for actionable insights
- Splunk Developer Docs: Observability API - Detectors