Using metrics to create KPIs in Splunk ITSI
Using metrics to support key performance indicators (KPIs) can deliver performance savings at both the source and ingestion layers, as well as help with standardizing methods of bringing your KPIs online in Splunk ITSI (ITSI).
This article shows you how to approach creating metrics-based KPIs. It is intended as a starting point for experienced ITSI users to start thinking about using metrics rather than logs to drive service monitoring.
Adopting this type of approach provides opportunities to create standards to help you bring new metrics online more easily, while also allowing you to streamline the workload in ITSI.
- Using metrics won’t always be the right approach, and for some users, using logs will be preferable.
- This article assumes that you have some ability to manipulate the data source prior to generating and sending the metrics to Splunk ITSI (in this case, AWS Lambda).
Scenario
You have been asked to onboard log data that contains sales figures for your organization, Buttercup games. The service owner would like to monitor these figures per region in ITSI. At this time, there is no requirement for alerting or service dependency mapping, only the ability to track these metrics via KPIs and view them in ITSI.
The service owner knows the data is periodically uploaded to an AWS S3 bucket as a flat file.
The service owner is expecting these metrics, sorted per region:
- Revenue
- Profit
- Online sales
- Total sales
Getting data in and generating the metrics
Splunk provides robust solutions for ingesting from AWS S3 using an SQS based input that will ingest the whole file. As a Splunk administrator, you then manipulate the data with the traditional methods Splunk provides (field extractions, search-time manipulation, etc.)
However, for a metrics-based approach, assume that an AWS Lambda function has been created to run each time the S3 bucket is updated.
The development of the Lambda function is out of scope for this article, but for this particular use case the Lambda function will:
- ascertain the ITSI entity ID
- build a JSON payload containing the relevant metrics
- send the metric payload to the Splunk HTTP Event Collector
The file arriving at the S3 bucket looks like this:
Regional Sales Figures
*** North-East Region ***
Revenue: 98,664
Profit: 16,876
Online Sales: 54
Total Sales: 221
*** North-West Region ***
Revenue: 48,444
Profit: 6,276
Online Sales: 39
Total Sales: 149
*** East Region ***
Revenue: 23,723
Profit: 2,766
Online Sales: 64
Total Sales: 228
*** West Region ***
Revenue: 18,432
Profit: 9,659
Online Sales: 23
Total Sales: 187
*** South Region ***
Revenue: 108,123
Profit: 25,282
Online Sales: 134
Total Sales: 268
The Lambda function should create five separate metric payloads, one for each region, to send to the HTTP Event Collector. An example in Python for the south region is:
body={
   "time": epochTime,
   "event":"metric",
   "source":"lambda",
   "host":"aws",
"fields":{"itsi_entity":”South”,"region":”South”,"metric_name:Revenue":108123,"metric_name: Profit":25282,"metric_name:OnlineSales":134,"metric_name:TotalSales":268}
}
# build request
createurl="https://localhost:8088/services/collector"
request = urllib2.Request(createurl, data=json.dumps(body))
request.add_header("Authorization", "Splunk eb7bdb87-1ff6-40c3-b6a4-deff1ad42443")
response = urllib2.urlopen(request)
Creating the entity discovery search
Now that your metric data is generated and in a metrics index, you can start to build out your ITSI configuration. You need to be able to create ITSI entities for each of the regions the service owner has requested data on.
Create the entity discovery search using the itsi_entity field as the Entity Title. If you ensure each payload containing metrics includes the itsi_entity field and you deliver them to the same index, the entity search below should be enough to cover all entities going forward. Further detail on this is in the Introducing standards for metric-based KPIs section.
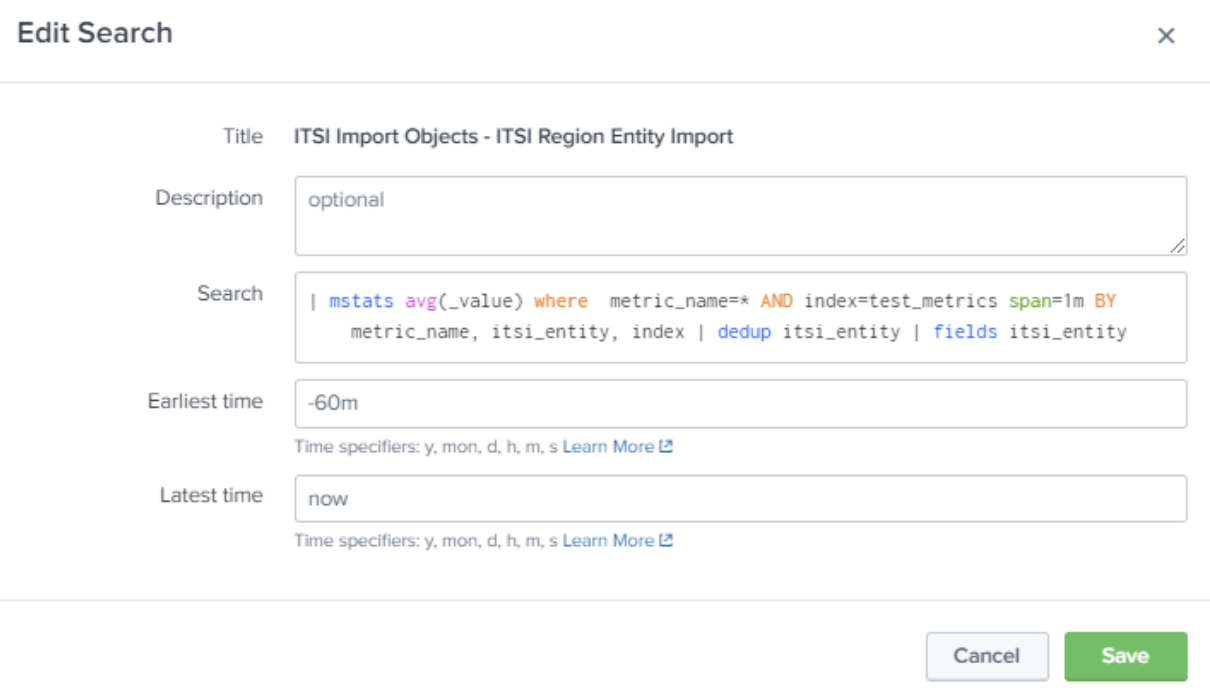
| mstats avg(_value) where metric_name=* AND index=test_metrics span=1m BY metric_name, itsi_entity, index
| dedup itsi_entity
| fields itsi_entity
Creating the KPI base search
Next, create the KPI base search to do the aggregation on the metrics. Your KPI base search should be an Ad hoc search. You should manually add each metric and its associated metric threshold field in the same way as the example below. This will allow you to select each of these metrics when you create your KPIs.
You should also split by entity and filter to entities in service. This will allow you to view KPIs per region, as requested by the service owner.
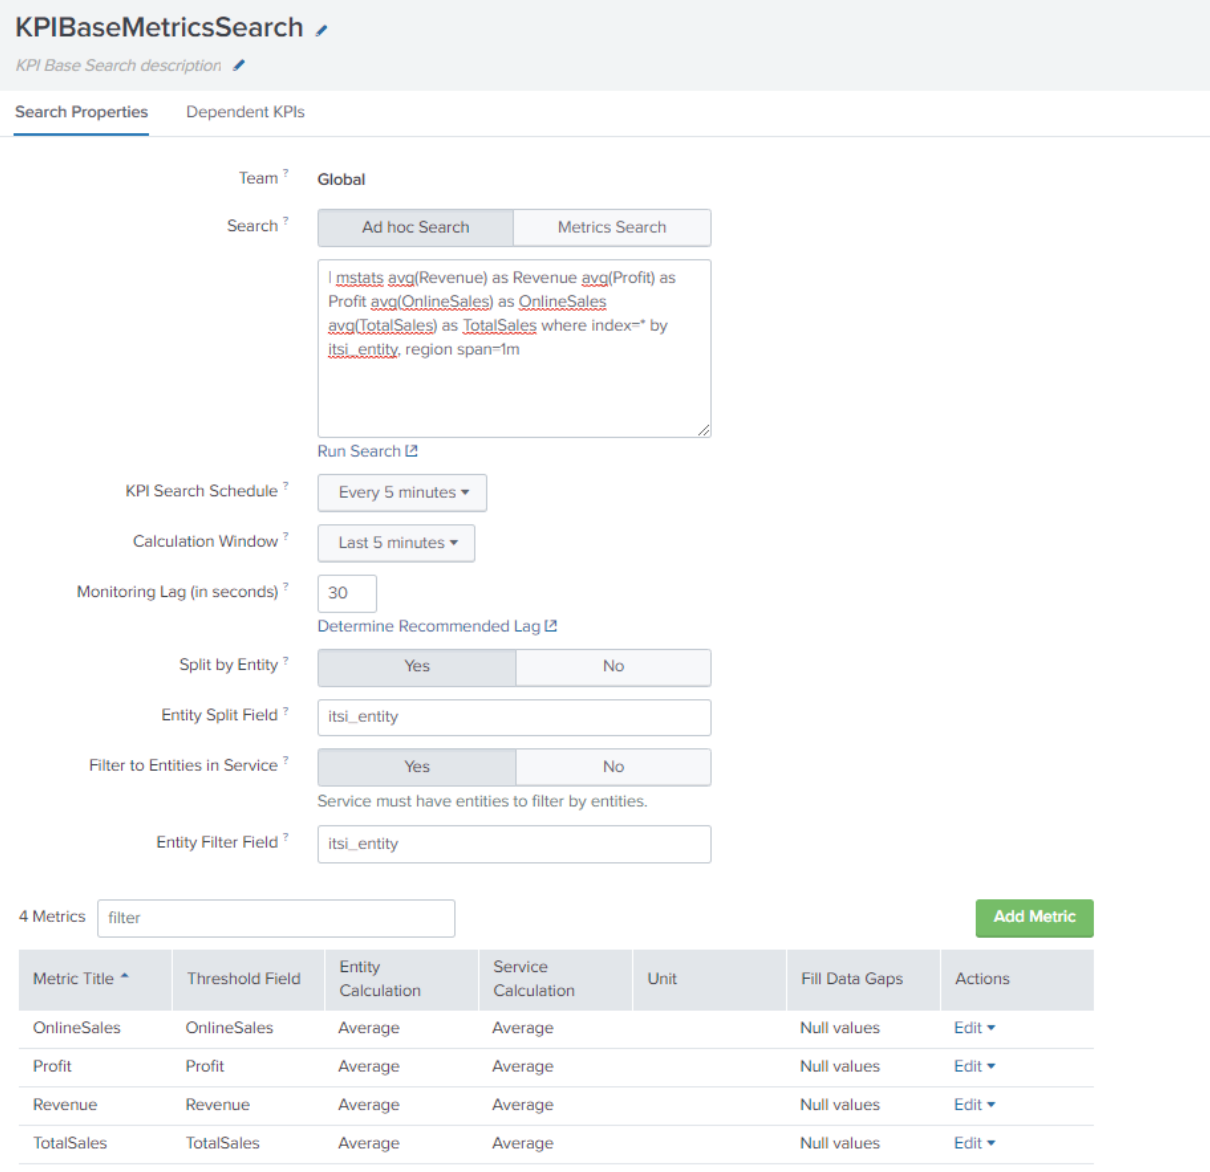
| mstats avg(Revenue) AS Revenue avg(Profit) AS Profit avg(OnlineSales) AS OnlineSales avg(TotalSales) AS TotalSales where index=* BY itsi_entity, region span=1m
Creating the service KPIs
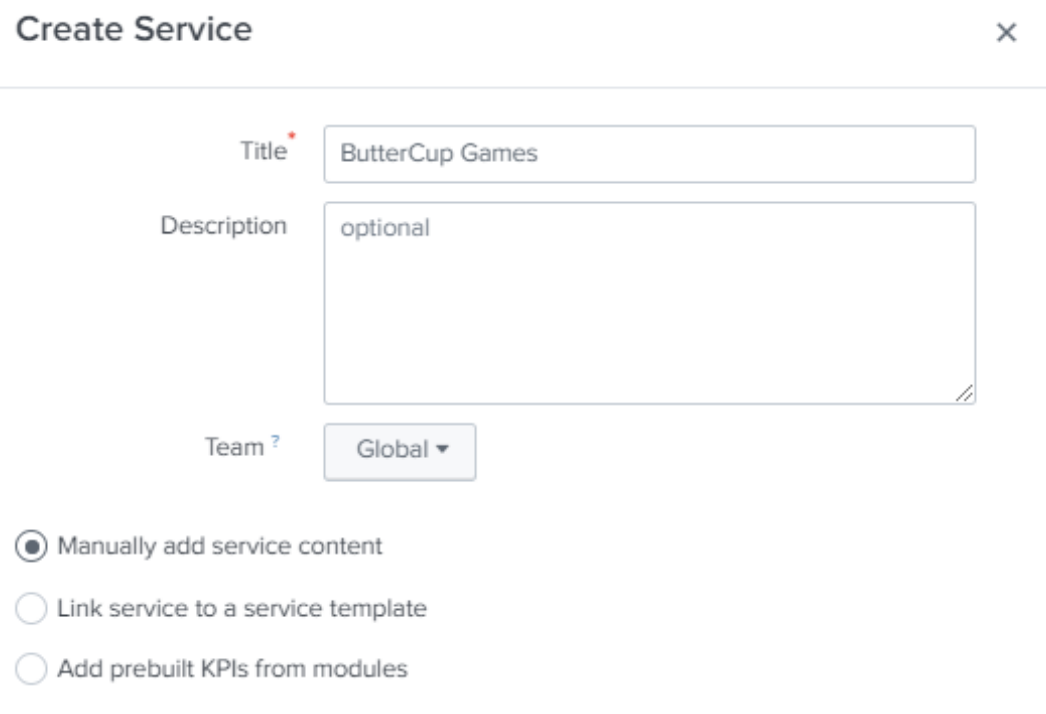
Create your service and select Manually add service content.
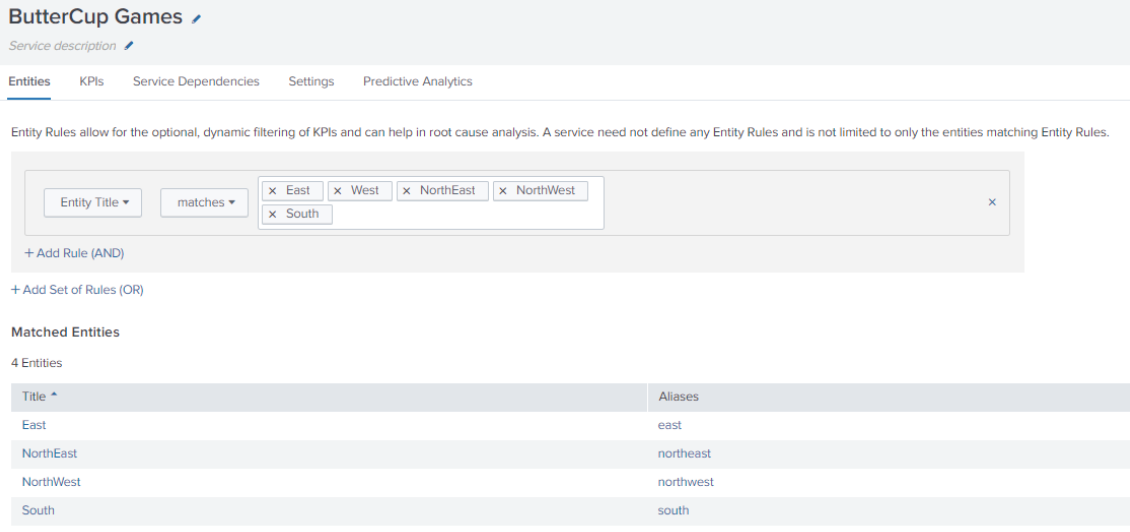
You should now see the entities that have been discovered from the entity search you created. Create entity rules to filter your entities into the service.
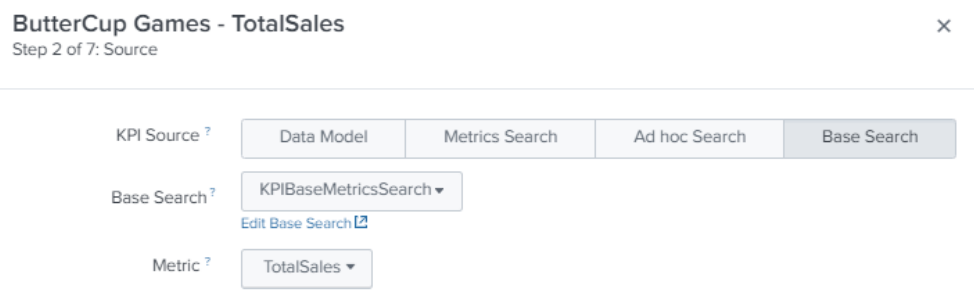
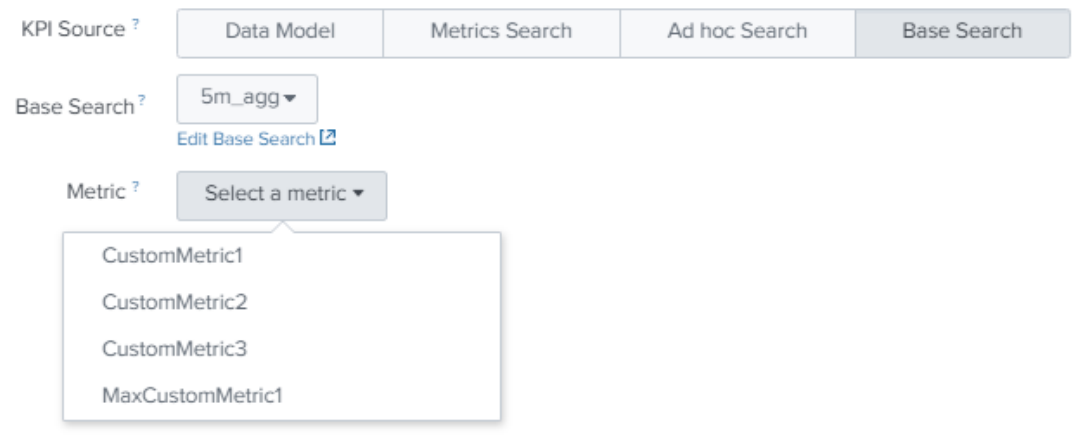
Next, create your KPIs. At Step 2, select Base Search, select the base search you previously created to search the metrics index, then select the metric you require. All other options should be grayed out if you have set the aggregation in the base search, for example, to be split by entity.
Repeat the KPI creation process for each KPI you wish to create. In this example you would need to create four separate KPIs: Revenue, Profit, OnlineSales and TotalSales.
Results
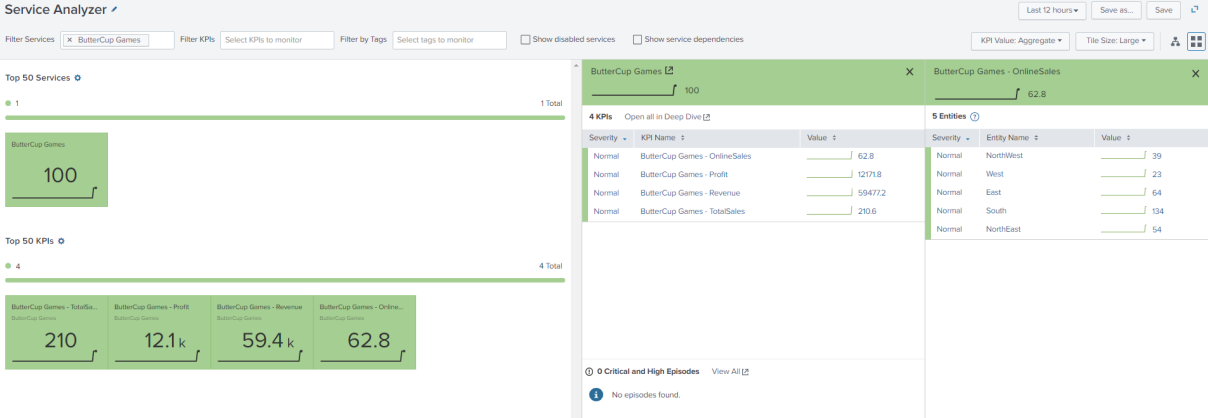
You should now see your service populated and your KPIs split by entity:
Introducing standards for metric-based KPIs
Adopting this type of approach provides opportunities to create standards which help you bring new metrics online more easily, while allowing you to streamline the workload in ITSI.
Standardizing metrics payload
If you ensure all custom metrics sent into your metric index contain a uniform payload that your entity search can always use, then you won’t have to amend your entity search in the future. In the example above, itsi_entity is used as the field to identify entities.
Standardizing metrics indexes
Let’s say all of your metrics need to have statistics produced each 5 minutes. You could have a single metrics index - perhaps called kpi_metrics_5m - that all custom metrics are fed into. If you have a single index, you can standardize not only your entity search but also your KPI base search, which might look something like this and would run every 5 minutes, looking back over the last 5 minutes:
| mstats avg(CustomMetric1) AS CustomMetric1 avg(CustomMetric2) as CustomMetric2 Max(CustomMetric1) AS MaxCustomMetric1 avg(CustomMetric3) AS CustomMetric3 where index=* BY itsi_entity, region span=1m
If you have metrics that require statistical analysis over a different period of time, you could push those metrics to a different index (for example, called kpi_metrics_1h) and have the KPI base search run accordingly. The aim is to have just one KPI base search across all metrics in each metrics index.
A KPI base search that aggregates over five-minute periods might be sufficient even if you require your KPI to use a different time period. If you have a base search that summarizes data, you can use the ITSI summary index for your actual KPI search.
Standardizing metric onboarding
Let’s assume you’ve adopted the model above of having distinct metrics indexes that determine the time period of aggregation. You have two separate indexes:
- kpi_metrics_5m. Metrics aggregated each five minutes
- kpi_metrics_1h. Metrics aggregated each hour
Entity creation across metrics indexes could be as simple as a single search across all metrics indexes. If you have standardized your metrics payload, you should have uniform fields that can be used, for example, itsi_entity.
Create a macro for your entity search:
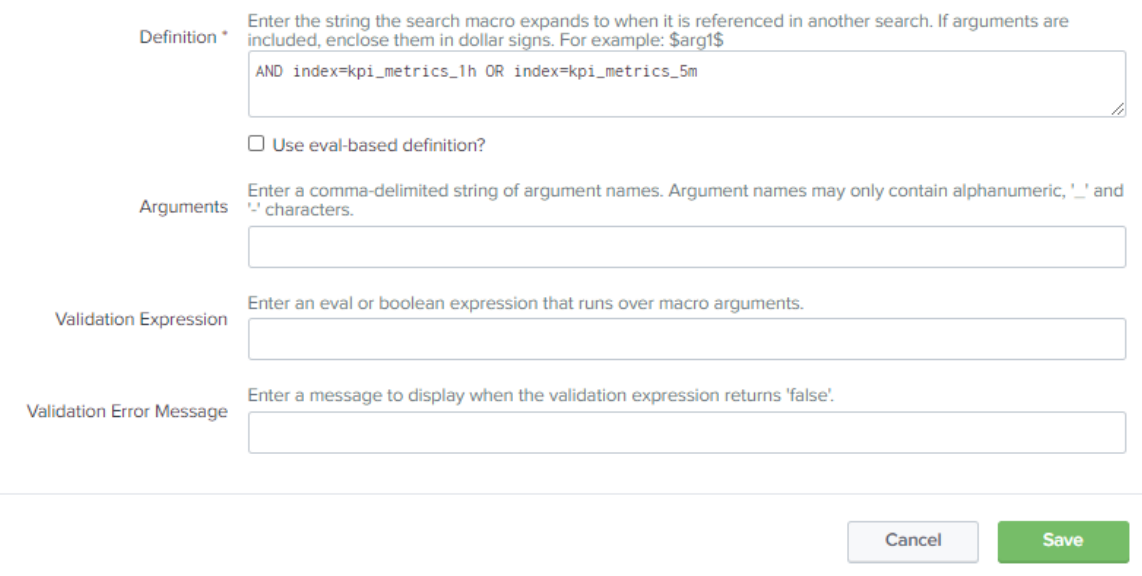
AND index=kpi_metrics_1h OR index=kpi_metrics_5m
Your KPI entity search now looks like this:
| mstats avg(_value) where metric_name=* `custom_metric_indexes` span=1m BY metric_name, itsi_entity, index
| dedup itsi_entity
| fields itsi_entity
In future, if you create a new index to house a different aggregation period, you only need to update the macro.
Standardizing aggregation period by index lets you consolidate your KPI base search. Again, you can use a macro to house the specific stats you require for each metric type.
| mstats avg(CustomMetric1) AS CustomMetric1 avg(CustomMetric2) AS CustomMetric2 Max(CustomMetric1) AS MaxCustomMetric1 avg(CustomMetric3) AS CustomMetric3 where index=* BY itsi_entity, region span=1m
Let’s assume you’ve called the macro kpi_5m_agg. Your KPI base search definition looks like this:
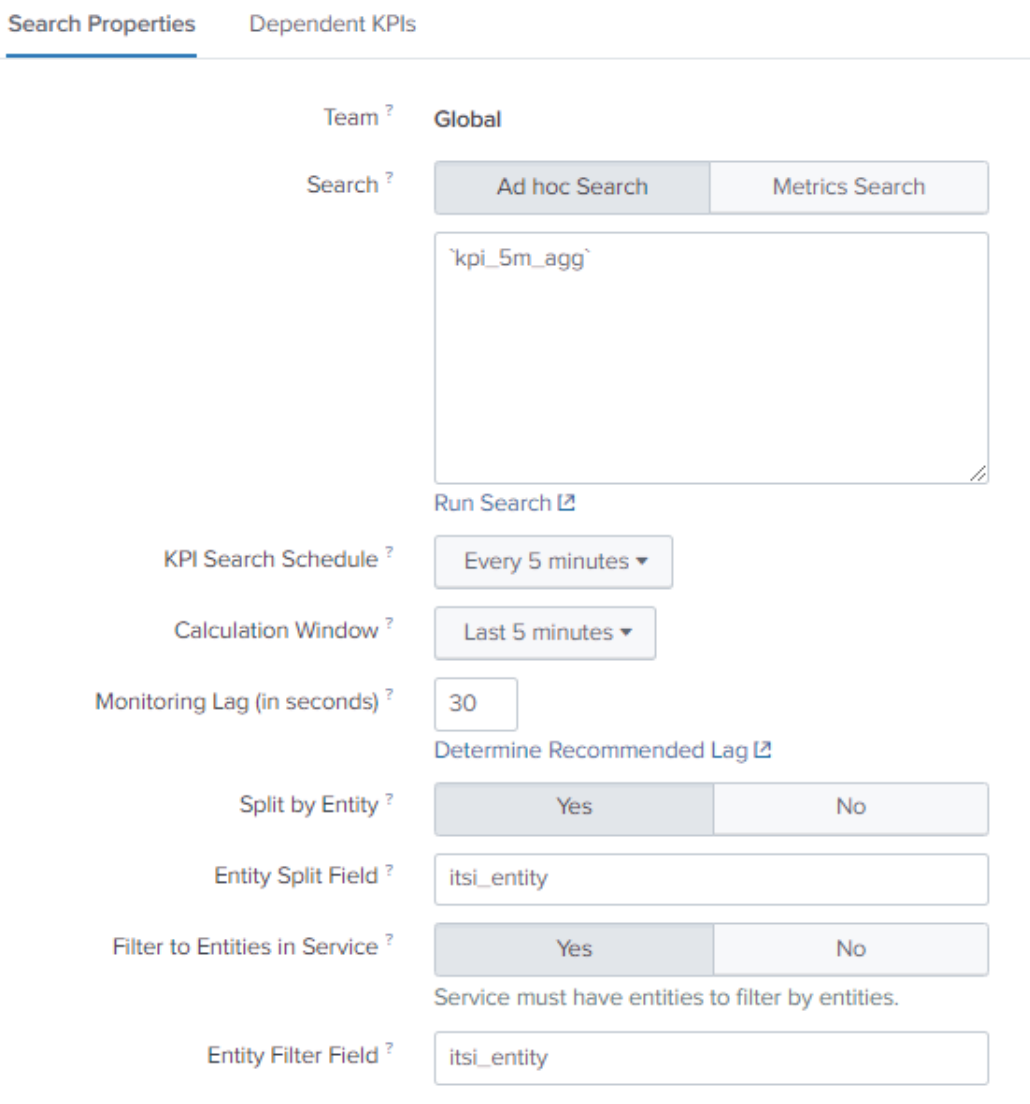
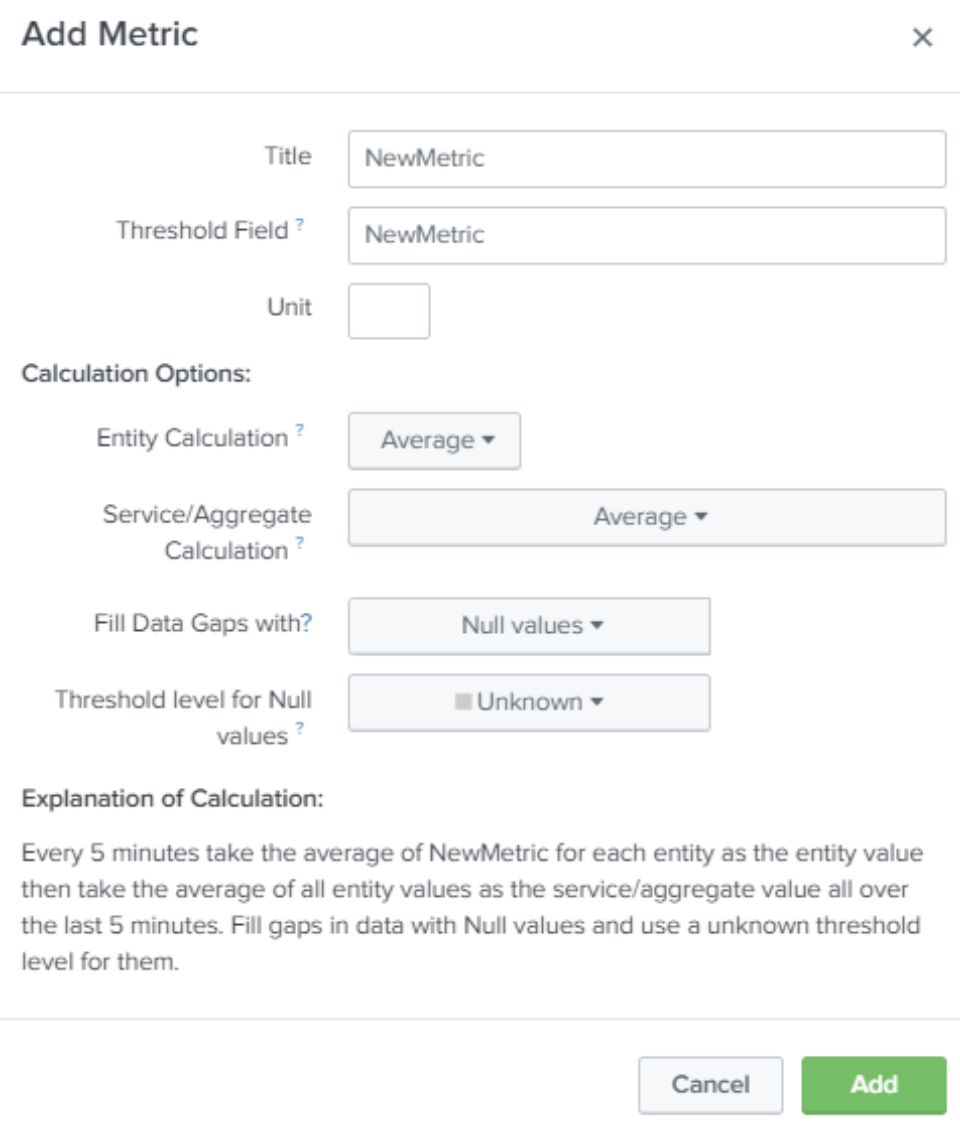
You will still need to manually add the metrics you need from the search in the Add Metric section:
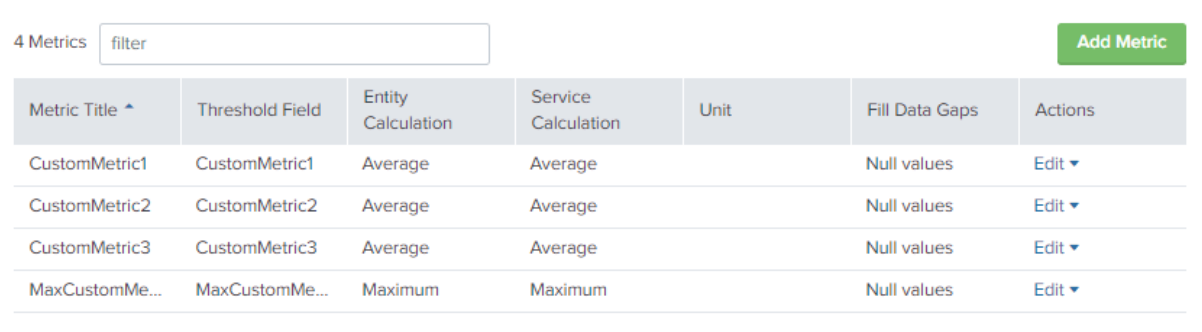
After you have created your base search, it will be available for you to create KPIs from:
After you have completed this process, the steps to onboard new metrics ready for KPI creation are:
- Update the base search macro with additional stats for your new metrics, for example, avg(NewMetric) as New Metric
- Update the KPI base search definition to include the new metric
This makes onboarding metric data very quick and provides the performance benefits of running a single KPI base search across the metrics index to service every KPI as your deployment grows.